Article Text

Abstract
Developments in artificial intelligence (AI) have led to an explosion of studies exploring its application to cardiovascular medicine. Due to the need for training and expertise, one area where AI could be impactful would be in the diagnosis and management of valvular heart disease. This is because AI can be applied to the multitude of data generated from clinical assessments, imaging and biochemical testing during the care of the patient. In the area of valvular heart disease, the focus of AI has been on the echocardiographic assessment and phenotyping of patient populations to identify high-risk groups. AI can assist image acquisition, view identification for review, and segmentation of valve and cardiac structures for automated analysis. Using image recognition algorithms, aortic and mitral valve disease states have been directly detected from the images themselves. Measurements obtained during echocardiographic valvular assessment have been integrated with other clinical data to identify novel aortic valve disease subgroups and describe new predictors of aortic valve disease progression. In the future, AI could integrate echocardiographic parameters with other clinical data for precision medical management of patients with valvular heart disease.
- echocardiography
- heart valve diseases
This is an open access article distributed in accordance with the Creative Commons Attribution Non Commercial (CC BY-NC 4.0) license, which permits others to distribute, remix, adapt, build upon this work non-commercially, and license their derivative works on different terms, provided the original work is properly cited, appropriate credit is given, any changes made indicated, and the use is non-commercial. See: http://creativecommons.org/licenses/by-nc/4.0/.
Statistics from Altmetric.com
Introduction
The global incidence of valvular heart disease (VHD) has increased by 45% in the last 30 years, with an annual incidence of 401 new cases per 100 000 people.1 This is due to an expanding ageing population and age-related VHD.1 Echocardiography is the most common imaging modality used to identify patients with VHD as it is non-invasive, portable, widely available and cost-effective, and provides real-time assessment of cardiac structure and function.2 Currently, there are over seven million echocardiograms performed annually in North America.3 4 Despite this, there is evidence that a number of patients with VHD are underdiagnosed.5 Merely increasing the number of echocardiograms performed to provide screening to the millions of people at risk of developing VHD is not feasible within current clinical practice paradigms and budgetary limits.6 Even the advent of handheld/point-of-care ultrasound machines may not address this need, as diagnostic quality image acquisition and interpretation for VHD require training and expertise.7–9 Moreover, busy clinicians must incorporate multimodal imaging and clinical and biochemical patient data for decision-making.
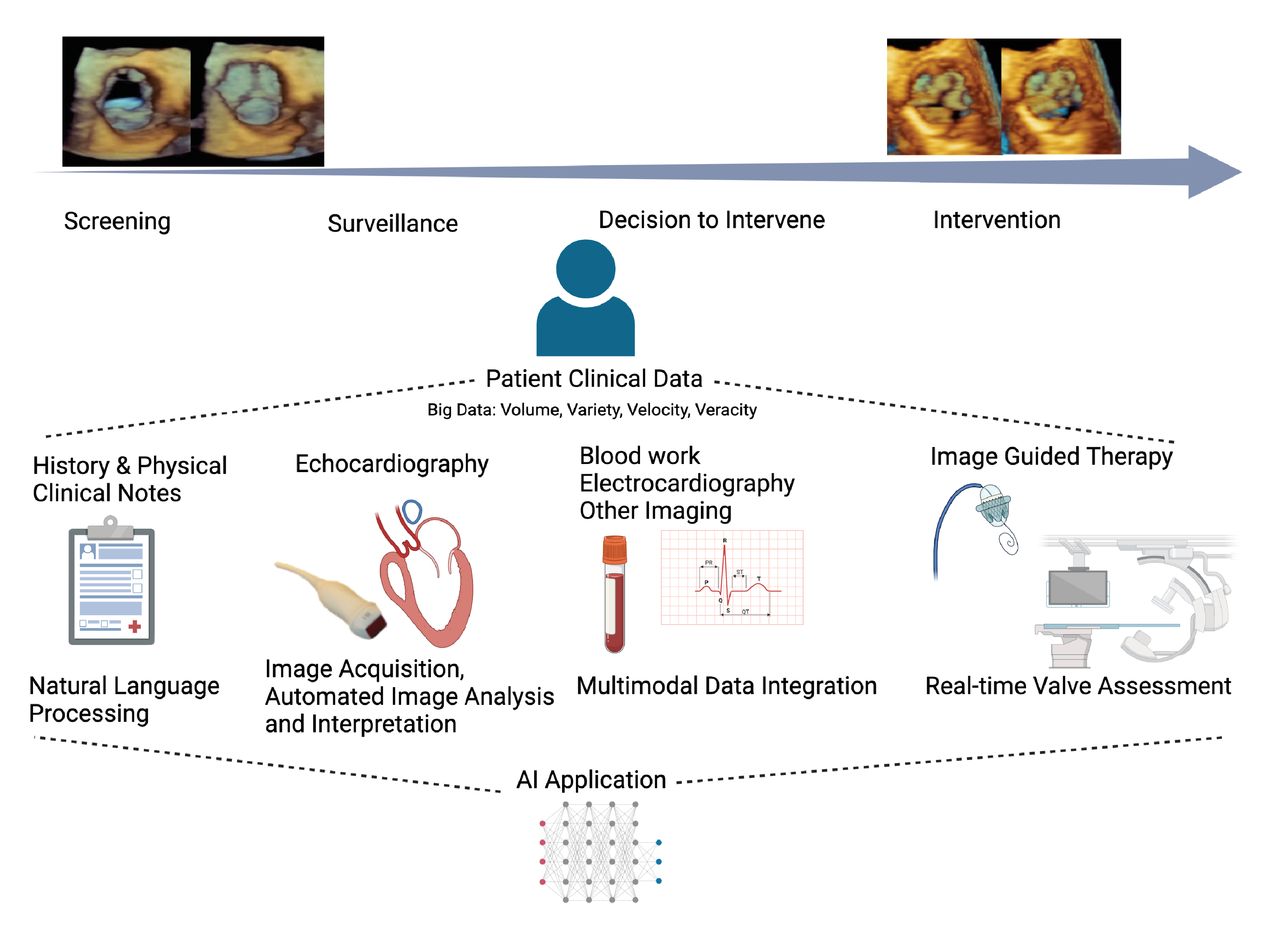
Developments in the field of artificial intelligence (AI) hold great promise in transforming how patients with VHD are assessed and managed as it can simulate the complex, multimodal decision-making required (figure 1). It is already changing how echocardiographic images are acquired, processed and quantified. AI methods can also be applied to the wealth of information contained in the images, measurements and clinical data obtained that are not currently considered during assessment. In this review, we will discuss the emerging work of AI in VHD assessment. First, we will provide a summary of AI concepts related to medical imaging and the contemporary implementation of AI to echocardiographic valvular image assessment. Then we will examine the AI methods used for phenotyping VHD and assess the studies in this area. Finally, we will discuss the future directions of AI echocardiography and valvular assessment.

Pathway of a patient with valvular heart disease and areas of care where AI can improve assessment and management. The top left and right images are three-dimensional TTE images of the aortic valve in short axis during systole and diastole representing progression from a normal to a diseased state. Below are the stages of care (screening, surveillance, decision to intervene, intervention). AI can be applied to any type of patient data (ie, clinical notes, echo images) obtained at any of these stages. In turn, the collective set of data can be used by AI to improve management at various care stages. AI, artificial intelligence; TTE, transthoracic echocardiogram.
AI in cardiac imaging
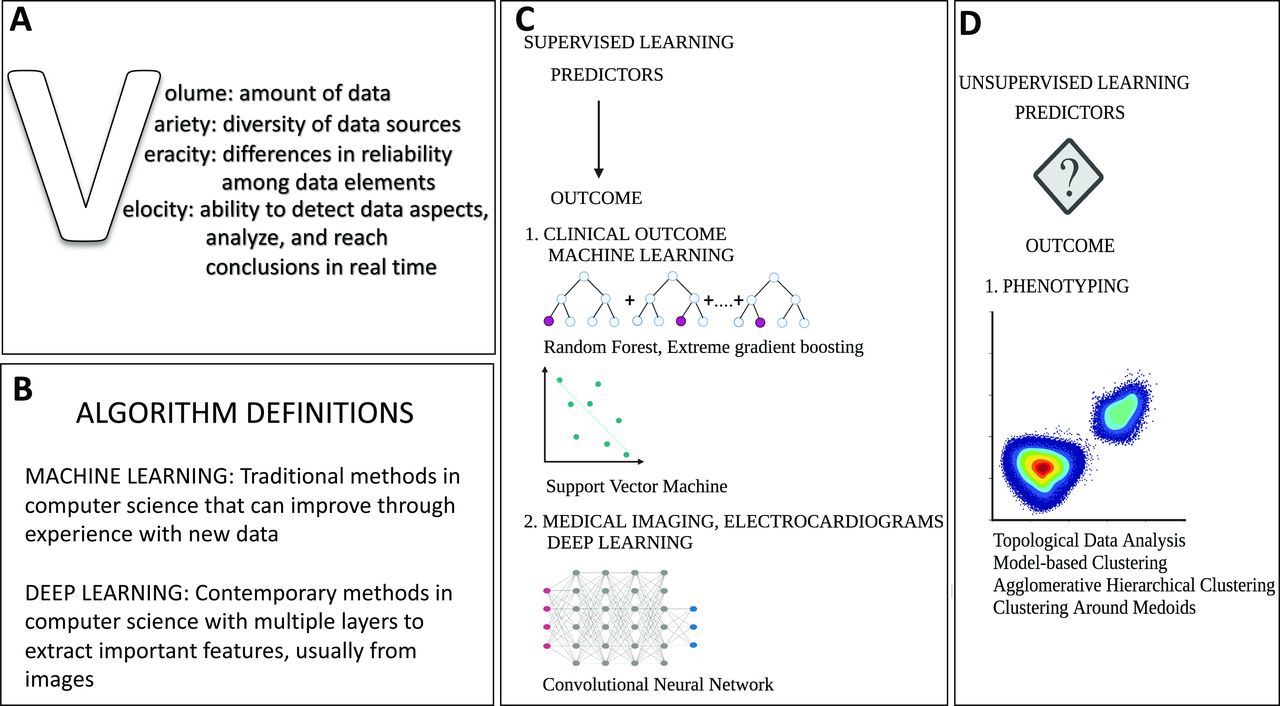
AI is a method used to identify patterns of associations between predictors and outcomes. Its power comes from its ability to find these associations from large amounts of data and, with no prior knowledge of associations, draw non-linear relationships between a wide variety of predictors with an outcome of interest. These large amounts of data, termed ‘big data’, are characterised by the 4Vs: volume, variety, velocity and veracity (figure 2).10 Patient data collected today can be considered ‘big data’ and AI is potent in its ability to perform multidata integration and generate predictions using clinical, imaging, electrophysiological and genomics information. With improved access to significant computing power and therefore the capacity to process large amounts of data, AI can perform complex decision-making in a fraction of the time needed by humans.11

(A) Characteristics of big data. (B) Common AI definitions. (C) Common model architectures used in AI depend on the purpose of modelling. With supervised learning, predictors are mapped to a known outcome. When the outcomes of interest are clinical, machine learning methods such as random forest and support vector machine are used. When the outcome of interest is imaging-based, then deep learning methods such as convolutional neural networks are used. (D) With unsupervised learning, the predictors are visualised on a plot to find natural clustering of the data. A typical use in valve disease studies has been in phenotyping to identify higher risk phenotypes. Methods used with unsupervised learning include topological data analysis, model-based clustering, agglomerative hierarchical clustering and clustering around medoids. AI, artificial intelligence.
Based on the type of problem, different AI algorithms can be applied to clinical and imaging data (figure 2). However, the most widely implemented model has been the convolutional neural network (CNN) due to its success in medical imaging. CNN architecture is modelled based on the visual cortex of the brain and involves identifying crucial image features that allow for image identification. By applying different filters, or sieves, to an image, image features can be extracted and correlated with the outcome of interest. This form of modelling can be extremely accurate but requires significant computational power and many images to train a model to build associations.12
AI is currently encountered in automated ECG interpretation, cardiac CT and MRI chamber measurements, and most recently two-dimensional (2D) echocardiography strain analysis and Doppler tracing.13 Given the dominant role of echocardiography in VHD, this review will focus on this modality. Echocardiograms are ideal for AI applications as each echocardiographic study contains several acquisition modes, multiple views and numerous frames generating a large amount of data, of which only a fraction are clinically appreciated. AI on these big data can generate gains in echocardiographic valve imaging assessment and identification of novel disease markers through phenotyping.
AI to improve echocardiographic image valve assessment
The application of AI to echocardiographic images in patients with VHD falls into four main categories: (1) image acquisition, (2) view recognition, (3) image segmentation and (4) disease state identification.
Image acquisition
In patients with VHD, the echocardiographic study is focused on acquiring images that allow the diagnosis of valve disease severity and the impact on related cardiac structures. Thus, in addition to the cardiac chambers, acquired images should allow clear visualisation of the valve leaflets/cusps, the jet origin and extent in regurgitant lesions, the source of the flow acceleration for stenotic lesions, and the complete continuous wave (CW) Doppler signal of the maximal flows. Acquisition of such images requires training, especially when regurgitant jets are eccentric or wall-hugging or gradients are highest in non-traditional off-axis planes. Some laboratories have addressed specific quality issues such as the acquisition of maximal aortic stenosis (AS) gradients by implementing ‘buddy’ systems.14 However, this is time- and labour-intensive.
AI has the potential to improve valve assessments through the development of programs that guide image acquisition. Currently the focus of such AI-assisted image acquisition has been on basic non-colour images such as the parasternal or apical views.15 16 One such developed AI algorithm has been assessed by comparing the quality of images acquired by novice nurses scanning patients with AI guidance against expert sonographers.15 The percentage of evaluable images of the aortic, mitral and tricuspid valves obtained by the novice users were 91.7%, 96.3% and 83.3%, respectively. Future iterations of these early-stage programs can be used in patients with mitral or tricuspid regurgitation or guide Doppler interrogation in AS.
View identification
Similar to its current use to identify left ventricular (LV) views, AI could improve valve assessment by identifying images containing valve data to allow for reading in ‘stacks’, automated measurements, and even aid interpretation using current guideline criteria.9 This could offer significant time savings and potentially improve report quality by increasing severity assessment agreement between readers, which can be as low as 61% for mitral regurgitation (MR) severity.17 The first step for such AI programs would be to identify the views that include valve information.18 While many papers have been published on standard view identification, few have been published identifying specific valve anatomy or Doppler signals. One publication has described using AI to identify and track mitral and tricuspid valve leaflets in the apical four-chamber view to identify the presence of pathology.19 This paper reported that their program could detect mitral valve leaflets with accuracy of 98% and tricuspid valve leaflets with accuracy of 90%. Studies have also reported overall success in identifying Doppler data of 94%.20 A separate AI program has found that accuracy of identification of CW Doppler signal images was better at 98% compared with pulsed-wave (PW) images, which had an accuracy of 83% because a PW signal can look similar to a faint CW signal.21
Image segmentation
AI-driven automated image analysis to provide measurements would greatly increase quantitative assessments, accuracy and reproducibility. This can be achieved through image segmentation, which refers to recognising a specific structure in the image, identifying its boundaries and performing measurements. Application of image segmentation can be applied to 2D and three-dimensional (3D) echocardiographic chamber images with the goal to automate size and function measurements. Note, most of this work has been performed using labelled images, but there are some studies developing programs without manual image delineation.22–24 In addition, segmentation can be performed of the valve annulus, leaflets/cusps, jets and Doppler spectral profiles.
Valve annulus and leaflet
Commercial and non-commercial programs have been developed that use AI methods to provide automated valve measurements from 3D aortic, mitral and tricuspid echocardiographic images (table 1). It must be noted that early programs in this area were based on computational methods, which apply mathematical rules for automation, rather than AI methods such as CNNs. Due to the proprietary nature of commercial software packages, details on the included AI algorithms are not available, although it is likely that current iterations include some form of AI analytics (online supplemental table 1).25–27 Overall, these commercial packages have a few limitations. Some are technically semiautomated processes that require expert initialisation and others can only be applied to images generated from echocardiographic machines produced by the same vendor (figure 3).27
Supplemental material

Example images of commercial valve analysis software. Mitral valve models from (A) GE, (B) Philips and (C) TomTec. (D) An aortic valve model from Siemens. A, anterior; AL, anterolateral; Ao, aorta; L, left coronary cusp; N, non-coronary cusp; P, posterior; PM, posteromedial; R, right coronary cusp.
Summary of AI applications by valve
Non-commercial programs have also been developed to aid valve annular and leaflet segmentation (table 2). These programs focus on CNN development using mitral valve images. These methods’ Dice coefficients (measurement of accuracy in the setting of image identification) for mitral valve segmentation were modest to good, ranging from 0.48 to 0.79.28 Error rates of these automated program measurements were low at 6.1%±4.5% for annular perimeter measurements and 11.94%±10% for area measurement.29 The strength in these algorithms is their performance on low-quality images, while their limitations arise from their overestimation of mitral valve borders and false structure identification caused by image artefact.
Non-commercial AI-driven algorithms for valvular detection in echocardiography
Doppler
One study has been published applying AI segmentation to colour Doppler images. Zhang et al 22 studied 1132 patients with expert reader-defined MR, ranging from mild to severe, to train an algorithm that can quantify MR from 2D echo colour images. On an external validation data set of 295 patients, the accuracy of classification was 0.90, 0.89 and 0.91 for mild, moderate and severe MR, respectively. Similarly, little has been published on AI automation of CW and PW measurements. From one publication, compared with a board-certified echocardiographer, AI automation of CW and PW measurement of peak velocity, mean gradients and velocity time integral showed excellent correlation, with all correlation coefficients greater than 0.9.30 Commercial software has been developed to perform semiautomated 3D proximal isovelocity surface area (PISA) measurements with good accuracy and reproducibility, as multiple measurements can be made, although it is unclear if AI is used in modelling.31
Disease state identification
Deep learning approaches are powerful in that they can automatically encode features from data for recognition that are beyond human perception.32 In the case of disease state identification, echo images do not need to proceed through the traditional AI workflow of image identification and segmentation as diseases can be directly linked to the echocardiographic images. Using a cohort of 139 patients with no, mild, moderate and severe MR, Moghaddasi and Nourian33 developed an algorithm that can automatically quantify MR severity with 99.52%, 99.38%, 99.31% and 99.59%, respectively, for normal, mild, moderate and severe MR. Similarly, AI programs can automatically identify rheumatic heart disease involving the aortic and/or mitral valves with 72.77% accuracy.34 These algorithms are also able to effectively recognise prosthetic mitral valves as demonstrated by Vafaeezadeh et al,35 who developed and tested 13 different CNN algorithms, all of which had excellent area under the receiver operator curve (AUC) values of at least 98%.
AI VHD phenotyping
During a routine echocardiogram, a large volume of potentially diagnostic data are generated, which are further increased with 3D imaging and speckle tracking strain analysis. The totality of data available can be difficult for the busy cardiologist to parse and interpret and are likely underutilised.36 It is unknown how many ‘hidden’ variables exist within an echocardiogram and AI can help discover the value of these variables.7 This is especially relevant when discussing VHD, as currently the assessment is predominantly focused on valve haemodynamics. However, cardiac changes that occur in response to VHD could also be informative to severity assessment. Using AI for phenotyping allows for identification of novel disease groups and novel predictors of these disease groups. There have been considerable efforts in phenotyping VHD as practitioners are increasingly recognising the heterogeneity of our current classification groupings. Phenotyping can help identify a high-risk subgroup that may require more timely intervention.
Methodological considerations for phenotyping in studies in valve disease
To evaluate phenotyping studies, there are five methodological components that are helpful in their evaluation (figure 4). In determining the inclusion criteria, the disease group has to present a heterogeneous phenotype with a subgroup that experiences worse outcomes. Attention should be paid to the inherent biases, such as those related to sex, or race, that can affect the population included in a data set.37 Predictors should be derived from various data sources as the use of AI to amalgamate data from echocardiograms, other imaging, ECG and patient clinical data can boost identification of high-risk groups from higher data granularity. During algorithm choice, unsupervised learning can be used to derive clusters that can be studied and compared with other clusters to identify high-risk groups and novel predictors of these groups. Performance metrics should include measurements of improved performance of classification.38 Model validation is important to ensure the model can perform on non-training examples and is generalisable to its task. This measure is important as training data can be skewed and can contribute to bias in modelling. Validation can take many forms and is tailored to the purpose of the modelling.

(A) Deep learning workflow in automated image analysis. (B) A stepwise approach to assessing machine learning phenotyping studies from the study population and the data/predictor selection to the algorithm choice and assessment metrics. 2D, two-dimensional; 3D, three-dimensional; ROC, receiver operator curve.
AI phenotypic studies in aortic valve disease
VHD phenotyping using machine learning (ML) is an emerging field with only three studies, all on AS, published (table 3). One study, not discussed in detail, identified aneurysmal proximal aorta phenotypes in 656 patients with bicuspid aortic valve (AV) disease using CT.39 The three AS papers, to be discussed in further detail, all investigated heterogeneity in patients with AS to identify high-risk subgroups.
Phenotyping studies using echocardiographic-derived parameters
Casaclang-Verzosa et al 40 used unsupervised ML to create a patient–patient similarity network to describe the progression between mild and severe AS from 346 patients using 79 clinical and echocardiographic variables. A Reeb graph, where distances between patients define their similarities, was created using topological data analysis. Two subtypes of patients with moderate AS were visualised, with one group being male with lower ejection fraction and more coronary artery disease, while the other group had a lower peak AV velocity and mean gradients but higher LV mass indexes and left atrial volumes. In follow-up post aortic valve replacement (AVR), the patients’ loci in the Reeb graph regressed from the severe to the mild position. The model was then validated in a murine model of AS, with similar findings to the human Reeb graph. From this analysis, a subset of patients with moderate AS who experience aggressive deterioration of LV function were identified. This superior stratification supports the use of changes in LV and AV function along a continuum in disease management.
In Sengupta et al,41 the investigators sought to identify a high-risk group among a cohort of 1052 patients with mild or moderate AS and a discordant AS group which is the traditional low-flow, low-gradient group. Topological data analysis based on echocardiographic parameters derived a high-risk phenotype which had higher AV calcium scores, more late gadolinium enhancement, higher brain natriuretic protein and troponin levels, greater incidences of AVR, and death before and after AVR. These relationships remained true when the data set was restricted only to discordant AS. Model validation included developing a supervised ML model with an AUC of 0.988, which had better discrimination (integrated discrimination improvement of 0.07) and reclassification (net reclassification improvement of 0.17) for the outcome of AVR at 5 years compared with our traditional grading of valve severity. This paper showed that, using echocardiographic measurements and ML, there can be improved risk stratification in discordant AS where risks can be identified without the need for additional tests.
Kwak et al 42 used model-based clustering of 398 patients with newly diagnosed moderate and severe AS, with 11 demographic, laboratory and echocardiographic parameters, to identify a high-risk subgroup that may not benefit from valve intervention. They found three patient clusters that differed by age, LV remodelling and symptoms. These clusters had different risks of mortality, with one group experiencing higher all-cause mortality and another group having high cardiac mortality. When the cluster variable was added to modelling predicting 3-year all-cause mortality, there was improved discrimination (integrated discrimination improvement 0.029) and net reclassification improvement (0.294). Important findings from this paper include the integration of non-echocardiographic measurements and non-traditional measures of disease severity in risk-stratifying patients with AS. This paper suggests that patients at high risk of non-cardiac death could warrant a different therapeutic strategy.
Limitations
Although there are many avenues for AI to improve echocardiographic VHD assessment, there are some limitations to this approach (table 4). AI is sensitive to data quality and valvular data can be challenging as the components are mobile and the images are prone to noise and artefact. Thus, training data must include a wide variety of images of varying quality to develop implementable AI solutions. AI models can have significant model complexity, rendering it a ‘black box’ and uninterpretable to the user. Measures such as saliency maps, which show which parts of the images are analysed for classification, can help the user understand how the algorithm functions.43 Widespread AI implementation has also been limited by questions related to patient privacy and consent, algorithmic bias that could cause diagnostic/management errors, algorithm scalability, data security and an agreed-upon implementation strategy.44 45
Limitations in echo imaging that make artificial intelligence implementation in valve disease more challenging
Summary and future directions
The application of AI to echocardiographic valvular assessment is growing and will become essential given clinical time constraints and the increasing volume of patient data. Echo automation using AI can reduce structural and economic barriers to VHD care, democratising access to disease screening, point-of-care valvular evaluation and potentially referral for intervention.34 46 47 For example, conditions such as rheumatic heart disease, which is underdiagnosed among marginalised populations, could benefit from automated disease detection and help connect patients with healthcare services.48 Additionally, platforms such as federated cloud computing can allow for automated image acquisition in low access areas with real-time image interpretation/consultation occurring elsewhere in a private and trustworthy manner.49 AI applications in phenotyping could be used in other circumstances where valvular assessment on echo can be challenging, such as in identifying low-flow, low-gradient AS, or in disease quantification in mixed valve disease. Overall, AI can create efficiencies in the use of echo in healthcare that allows for enhanced valve disease identification, diagnosis and management, giving more patients access to timely, accurate and goal-directed treatment.
Ethics statements
Patient consent for publication
Ethics approval
This study does not involve human participants.
References
Supplementary materials
Supplementary Data
This web only file has been produced by the BMJ Publishing Group from an electronic file supplied by the author(s) and has not been edited for content.
Footnotes
Funding The authors have not declared a specific grant for this research from any funding agency in the public, commercial or not-for-profit sectors.
Competing interests None declared.
Provenance and peer review Not commissioned; externally peer reviewed.
Supplemental material This content has been supplied by the author(s). It has not been vetted by BMJ Publishing Group Limited (BMJ) and may not have been peer-reviewed. Any opinions or recommendations discussed are solely those of the author(s) and are not endorsed by BMJ. BMJ disclaims all liability and responsibility arising from any reliance placed on the content. Where the content includes any translated material, BMJ does not warrant the accuracy and reliability of the translations (including but not limited to local regulations, clinical guidelines, terminology, drug names and drug dosages), and is not responsible for any error and/or omissions arising from translation and adaptation or otherwise.