Article Text

Abstract
Background Haemodynamic exercise testing is important for evaluating patients with dyspnoea on exertion and preserved ejection fraction. Despite very different pathologies, patients with pressure (aortic stenosis (AS)) and volume (mitral regurgitation (MR)) overload and diastolic dysfunction after recent acute myocardial infarction (AMI) reach similar filling pressure levels with exercise. The pressure–flow relationships (the association between change in cardiac output (∆CO) and change in pulmonary arterial wedge pressure (∆PAWP) may provide insight into haemodynamic adaptation to exercise in these groups.
Methods and results One hundred sixty-eight subjects aged >50 years with a left ventricular ejection fraction of ≥50% underwent invasive exercise testing. They were enrolled in four different studies: AS (40 patients), AMI (52 patients), MR (43 patients) and 33 healthy subjects. Haemodynamic data were measured at rest, at 25 W, 75 W and at peak exercise. In all groups, PAWP increased with exercise. The greatest increase was observed in patients with AMI (from 12.7±3.9 mm Hg to 33.1±8.2 mm Hg, p<0.0001) and patients with AS (from 11.8±3.9 mm Hg to 31.4±6.1 mm Hg, p<0.0001), and the smallest was observed in healthy subjects (from 8.3±2.4 mm Hg to 21.1±7.5 mm Hg, p<0.0001). In all groups, the relative pressure increase was greatest at the beginning of the exercise. CO increased most in healthy patients (from 5.3±1.1 to 16.0±3.0 L/min, p<0.0001) and least in patients with AS (from 5.3±1.2 L/min to 12.4±2.6 L/min, p<0.0001). The pressure–flow relationships (∆PAWP/∆CO) and differed among groups (p=0.02). In all groups, the pressure–flow relationship was steepest in the initial phase of the exercise test. The AMI and AS groups (2.3±1.2 mm Hg/L/min and 3.0±1.3 mm Hg/L/min, AMI and AS, respectively) had the largest overall pressure–flow relationship; the healthy group had the smallest initially and at peak exercise (1.3±1.1 mm Hg/L/min) followed by MR group (1.9±1.4 mm Hg/L/min).
Conclusion The pressure–flow relationship was steepest in the initial phase of the exercise test in all groups. The pressure–flow relationship differs between groups.
Trial registration numbers NCT01974557, NCT01046838, NCT02961647 and NCT02395107.
- Mitral regurgitation
- Aortic stenosis
- Myocardial Infarction
- Heart Failure, Diastolic
Data availability statement
Data are available upon reasonable request.
This is an open access article distributed in accordance with the Creative Commons Attribution 4.0 Unported (CC BY 4.0) license, which permits others to copy, redistribute, remix, transform and build upon this work for any purpose, provided the original work is properly cited, a link to the licence is given, and indication of whether changes were made. See: https://creativecommons.org/licenses/by/4.0/.
Statistics from Altmetric.com
WHAT IS ALREADY KNOWN ON THIS TOPIC
Haemodynamic response to exercise is a valuable tool for distinguishing between cardiac and non-cardiac aetiologies when evaluating patients with unexplained dyspnoea. Single-pressure point cut-off has often been used to separate normal versus abnormal haemodynamic responses.
WHAT THIS STUDY ADDS
Pressure–flow relationship is not linear. At a lower level of exercise, there is an initial greater increase in pressure compared with flow, and this relationship is inversed at peak exercise.
Healthy subjects have a less steep increase in pressure–flow relationship compared with patients with aortic stenosis, mitral regurgitation and diastolic dysfunction.
HOW THIS STUDY MIGHT AFFECT RESEARCH, PRACTICE OR POLICY
The differences between patient groups imply that, on average, these individuals do not have similar haemodynamic responses to similar levels of submaximal exercise. This may have clinical implications for threshold of symptoms and has implications for exercise testing and research using submaximal levels of exercise.
Introduction
Assessment of the haemodynamic response to exercise is a valuable tool for distinguishing between cardiac and non-cardiac aetiologies when evaluating patients with unexplained dyspnoea and near-normal left ventricular ejection fraction (LVEF).1 In many invasive exercise studies, pulmonary arterial wedge pressure (PAWP) has been used as an endpoint due to the clear separation between healthy and symptomatic subjects during exercise.2 3 Often, studies have used a single absolute cut-off point of PAWP to define abnormal haemodynamic response to exercise.2 However, there is a physiological rationale for assessing pressure relative to flow, given the increase in PAWP with the increase in cardiac output (CO). The systemic pressure–flow relationship (change in pulmonary arterial wedge pressure (∆PAWP)/change in cardiac output (∆CO)) and pulmonary pressure–flow relationship (change in mean pulmonary arterial pressure (∆mPAP)/∆CO) provides prognostic and complementary information in heart failure with preserved ejection fraction and pulmonary arterial hypertension.4–6 A ∆PAWP/∆CO increase above 2 mm Hg/L/min has been proposed as being preferable to a single absolute cut-off point of PAWP to define abnormal response to exercise7 8 in heart failure with preserved ejection fraction. We have previously performed invasive exercise tests in different cohorts of subjects with preserved LVEF: healthy subjects over different age spans,9 patients with impaired myocardium after myocardial infarction,10 patients with pressure overload of the LV due to aortic stenosis (AS)11 and patients with volume overload due to mitral regurgitation (MR).12 All these studies demonstrated similar peak exercise PAWP despite apparent differences in pathologies. The pressure–flow relationship may provide further insight into haemodynamic adaptation in different pathologies. Hence, the objective of this study was to describe the pressure–flow relationship in healthy subjects, patients with pressure overload (AS), patients with volume overload (primary MR) and patients with impaired myocardial function (diastolic dysfunction after acute myocardial infarction (AMI)).
Methods
A symptom-limited semisupine exercise test was performed at baseline in four distinct prospective studies assessing the haemodynamic response to exercise. The LAVIAS (left atrial volume index in asymptomatic aortic stenosis) study assessed patients [AS] with asymptomatic AS (aortic valve area <1 cm2 and peak aortic valve velocity >3.5 m/s)11; the HEMI (hemodynamic stress test in severe mitral regurgitation) study assessed patients (MR) with significant organic MR (LVEF >55% and effective regurgitant orifice (ERO) >0.3 cm2)12; the SIDAMI (sildenafil and diastolic dysfunction after acute myocardial infarction) study assessed patients (AMI) with diastolic dysfunction after AMI (LVEF >45%, E/e′ between 8 and 15 with a left atrial volume index >34 mL/m2)13; and the HemReX (the effect of age on the hemodynamic response during rest and exercise in healthy humans) study assessed healthy subjects (Healthy) over a wide age range.9 To limit age-related bias to LV filling pressure, as described in the HemRex study, only participants older than 50 years of age and with LVEF of >50% were analysed. The same investigators performed all four studies at two Danish university hospitals (online supplemental file 1).
Supplemental material
Patient involvement
Patients or the public were not involved in the design, conduct, reporting or dissemination plans of the study.
Right heart catheterisation
Right heart catheterisation was performed using a 7 F triple lumen dual thermistor Swan-Ganz catheter (Edwards Lifesciences, Irvine, California, USA). The catheter was introduced through an 8 F sheath into the internal jugular vein and advanced to the pulmonary artery (PA). Measurement of right atrial pressure (RAP) and systolic pulmonary artery pressure/diastolic pulmonary artery pressure (dPAP)/mean pulmonary artery pressure pressures (mPAP) was performed. PAWP was assessed at end expiration at rest. During exercise, PAWP was averaged over 10 s. CO was measured using thermodilution, which was performed and averaged over three measurements with <10% variance,14 and CO was indexed to body surface area (BSA)as a cardiac index (CI). ∆PAWP/∆CO was calculated as (peak PAWP–resting PAWP)/(peak CO–resting CO); ∆mPAP/∆CO was calculated as (peak mPAP–resting mPAP)/(peak CO–resting CO); and ∆RAP/∆CO was calculated as (peak RAP–resting RAP)/(peak CO–resting CO); similarly, ∆PAWP_25 W/∆CO_25 W was calculated as PAWP_25 W–resting PAWP)/(CO_25 W–resting CO). Brachial blood pressure was measured non-invasively by sphygmomanometry at baseline and every 3 min until maximum workload was reached. BSA was estimated using the Mosteller formula.15 Mean arterial pressure (MAP) was calculated as systolic pressure/3+(2×diastolic pressure/3), and diastolic pulmonary gradient was calculated as dPAP–PAWP. Pulmonary vascular resistance (PVR) was calculated as (mPAP–PAWP)/CO, and systemic vascular resistance was calculated as (MAP–RAP)/CO. Stroke volume (SV) was calculated as CO/heart rate (HR), and pulse pressure (PP) was calculated as systolic pressure–diastolic pressure. Systemic and pulmonary compliances (total arterial compliance and pulmonary arterial compliance (PAC)) were calculated as SV/systemic or pulmonary PP. Transmural filling pressure (TMP), an estimate of LV preload, was calculated as the gradient between PAWP and RAP.
Protocol and interventions
All participants performed a semisupine cycle ergometer exercise. Participants were examined in the non-fasting state and were asked to refrain from consuming caffeine products on the day of the examination. After voiding, non-invasive and invasive equipment was placed (sphygmomanometer cuff, pulse oximeter, five-lead ECG, sheath and Swan-Ganz catheter).
After baseline data were acquired in the supine position with the legs resting flat on the surface, the haemodynamic assessment was performed during exercise. Patients with cardiac impairments (AS, MR and AMI) performed symptom-limited exercise starting at 0 W with 25 W increments. At 25 W, not all participants had the balloon inflated to measure PAWP, but all other variables were measured. Participants were encouraged to exercise until exhaustion (Borg score >18).16 Healthy subjects exercised at three intervals corresponding to 25%, 50% and 75% of peak VO2. The peak VO2 of the healthy subjects was obtained from a standard cardiopulmonary exercise test performed less than 2 weeks before the invasive exercise test (performed only on healthy subjects). Participants were encouraged to maintain a pedalling speed of 60 rpm during the exercise phase. Sampling points were chosen as rest, 25 W, 75 W and peak exercise. For healthy subjects, 75% of peak VO2 was chosen as peak exercise.
Statistical methods
The results are reported as the mean±SD or number (%) for normally distributed and categorical variables and as the median (IQR) for non-normally distributed variables unless otherwise indicated. To test differences between groups and the effects of exercise, multivariate analysis of variance (MANOVA) with repeated measures (Hotelling-Lawley trace) was applied to all the sampling points (rest, submaximal and peak exercise). MANOVA was also used to adjust for covariates. ANOVA with Tukey’s honestly significant difference test was used at single sampling points to assess group differences for normally distributed data. Paired t-test was used when comparing paired variables. The Wilcoxon rank-sum test with Bonferroni correction was used to assess differences between group means in the case of non-parametric data. Pearson χ2 test was used in the case of categorical data. Pearson’s correlation coefficient was calculated to assess correlations.
At 25 W, PAWP was missing in patients with AS and MR (83 (49%)); all other variables were available. The missing values of PAWP at 25 W were imputed using regression imputation based on the linear least square regression of the diastolic pressure gradient as a function of exercise based on participants with measurements available in all four trials at rest, 25 W, 75 W and peak exercise. Using the estimated diastolic pressure gradient (eDPG) at 25 W, PAWP was calculated as dPAP−eDPG. All tests were two-sided and adjusted for multiple comparisons. All analyses were conducted using JMP V.14 (Wittington House, Buckinghamshire, Great Britain).
Results
In total, 168 participants were included in the analysis: 33 healthy subjects, 52 patients with AMI, 40 with AS and 43 patients with MR. Patients with AS were significantly older and had a higher prevalence of hypertension than those in the three other groups. Patients with AMI were heavier than patients with AS or MR. Healthy controls and patients with AS had smaller left ventricular (LV) end-diastolic diameters than patients with MR and AMI (p<0.001). By design, sex of the healthy subjects was evenly distributed as opposed to that of patients with AS, MR and AMI, who were more likely to be male (table 1).
Baseline characteristics
Resting haemodynamics
There were no between-group differences in resting HR, SV, CI, vascular resistance, RAP or MAP. Patients with AS, MR and AMI had significantly higher resting mPAP, PAWP and TMP than healthy subjects. No healthy subjects had abnormal resting PAWP. Resting PAC was higher in healthy individuals and patients with AMI than in patients with AS and MR (table 2). Abnormal resting PAWP (> 15 mm Hg) was observed in 16% (7/43) of patients with MR vs 13% (5/40) of patients with AS vs 21% (11/52) of patients with AMI (p=0.54).
Invasive haemodynamics at rest and during exercise
Systemic haemodynamic effects of exercise
Exercise induced significant increases in all haemodynamic variables (figure 1) in all four groups. Patients with AS achieved a significantly lower peak exercise level than healthy controls and patients with MI and AMI (p=0.0002, p=0.04 and p<0.0001, respectively), but after adjustment for age, this difference was no longer significant (p=0.27). PAWP and CO increased significantly from rest to peak exercise (all p<0.0001) in all four groups. Patients with AS and AMI reached the highest level of PAWP at peak exercise, followed by patients with MR and healthy subjects who had the lowest PAWP at peak exercise. Despite patients with MR having higher PAWP at peak exercise, the relative increase in PAWP (∆PAWP) with exercise was similar between patients with MR and healthy subjects. The increase in CO (∆CO) differed significantly between groups (p<0.0001), as patients with AS and MR had the lowest increase in CO and the lowest peak CO (figure 2).
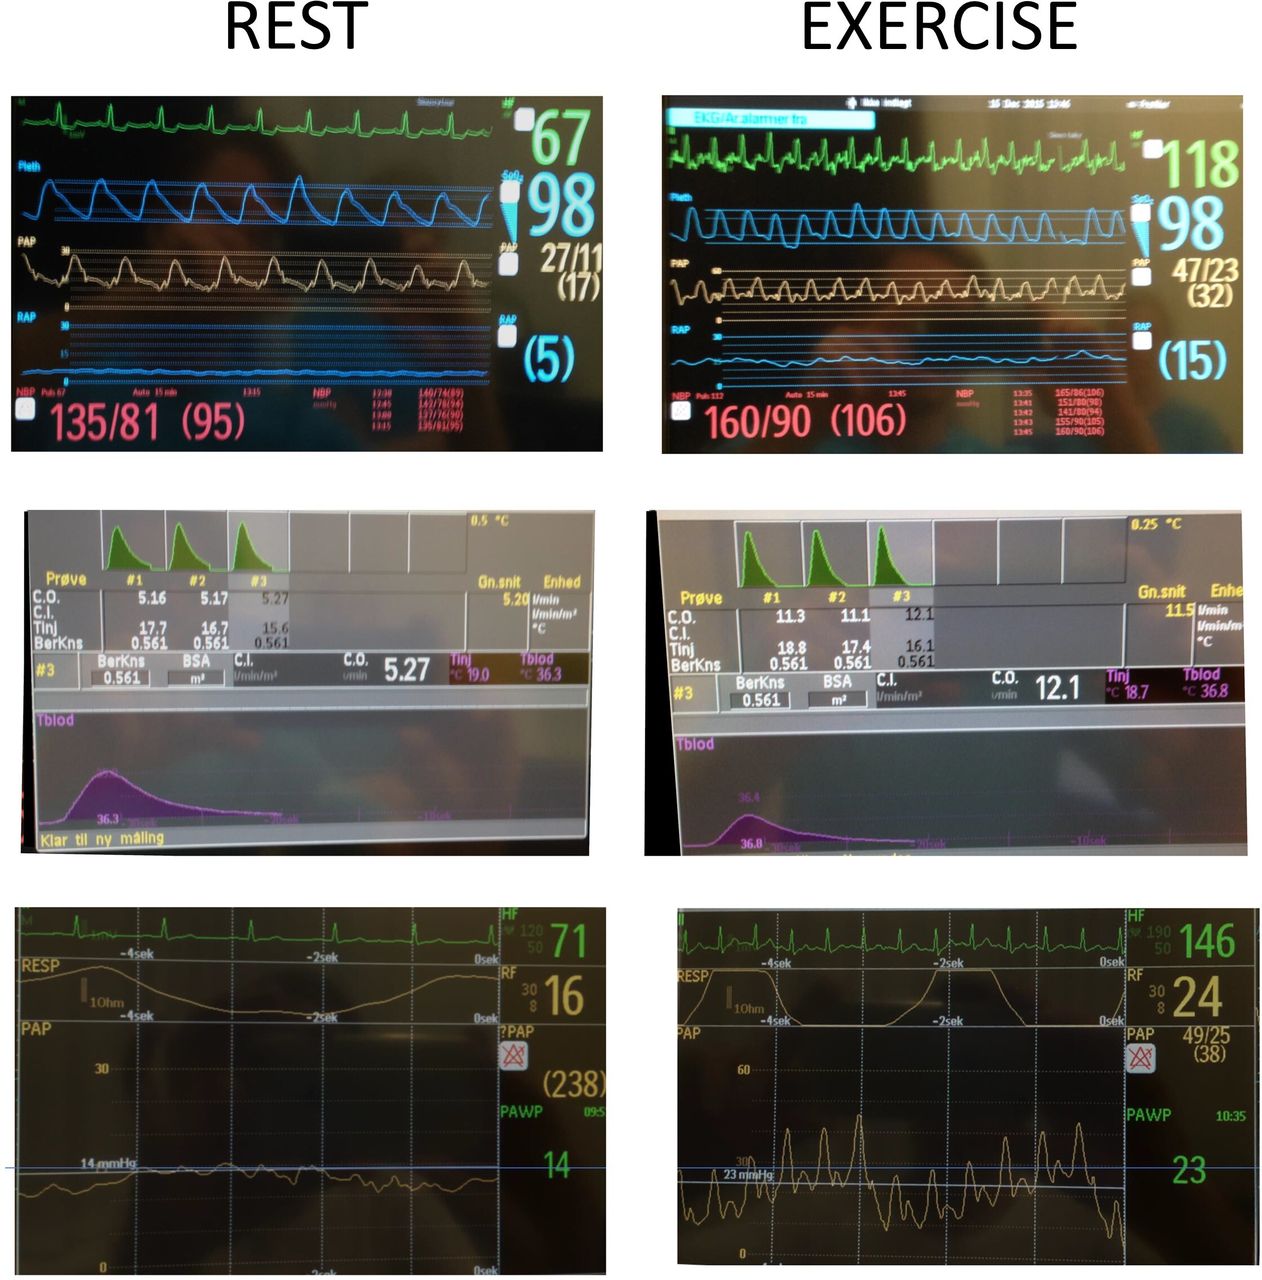
Pictures of the haemodynamic tracings from a patient with mitral regurgitation. Left column shows measurements performed at rest; right column shows measurements performed during exercise; top row shows heart rhythm (green), pulse oximetry (blue), pulmonary artery pressure (yellow), right atrial pressure (blue) and non-invasive blood pressure (red). Middle row shows the individual thermodilution cardiac output tracings. Bottom row shows heart rhythm (green), respiratory tracing (top yellow) and pulmonary arterial wedge pressure (bottom yellow). Note the marked V wave during exercise.

Box plot showing (A) peak PAWP in the healthy, AMI, MR and AS groups. The dotted line represents a PAWP cut-off at 25 mm Hg. (B) Absolute ∆PAWP and (C) ∆CO. All data points are shown. Error bars reflect the minimum and maximum values. *P<0.05 vs healthy, ‡P<0.05 vs AMI, †P<0.05 vs MR. Between-group differences were tested by analysis of variance and Tukey’s multiple comparisons test. ∆CO, change in cardiac output; ∆PAWP, change in pulmonary arterial wedge pressure; AMI, acute myocardial infarction; AS, aortic stenosis; MR, mitral regurgitation; PAWP, pulmonary arterial wedge pressure.
When comparing the pressure–-flow relationships (∆PAWP/∆CO), healthy subjects had the lowest increase (1.3±1.1 mm Hg/L/min), followed by patients with MR (1.9±1.4 mm Hg/L/min), whereas patients with AMI and AS had the steepest increase (2.3±0.7 mm Hg/L/min and 3.0±1.3 mm Hg/L/min, AMI and AS, respectively), analysis of all data points revealed significant differences between groups (p=0.004). This difference persisted after adjustment for age, sex and body mass index (BMI) (p=0.02, figure 3). It was not affected by the severity of ERO in MR, LVEF in AMI or peak aortic valve gradient in AS assessed by MANOVA.

Slope of the increase in PAWP relative to CO for the healthy (circle), AMI (square), MR (triangle) and AS (inverted triangle) groups at rest, 25 W, 75 W and peak exercise. The dotted line represents a PAWP/CO cut-off at 2 mm Hg/L. Data points represent mean group values. Error bars reflect the SD. Between-group differences were tested by multivariate analysis of variance with repeated measures (Hotelling-Lawley trace) and adjusted for age, gender and body mass index. AMI, acute myocardial infarction; AS, aortic stenosis; CO, cardiac output; MR, mitral regurgitation; PAWP, pulmonary arterial wedge pressure.
Interestingly, the slope was significantly steeper from rest to 25 W than from rest to peak exercise (table 3). More than 50% of the healthy subjects achieved an average pressure–flow relationship above the suggested cut-off of 2 mm Hg/L/min at 25 W. At peak exercise, only ≈20% of them achieved an abnormal value (figure 3). Among the patients with AS and AMI, the proportions were more similar at 25 W and peak exercise. In comparison, ≈20% of healthy subjects achieved a peak exercise PAWP >25 mm Hg, whereas it was >80% of patients with AMI and AS (figure 2A). In general, a numerically larger proportion of tests were abnormal when single cut-off PAWP was used than when the pressure–flow relationship was used in all four groups.
Pressure–flow relationships
Pulmonary haemodynamic effect of exercise
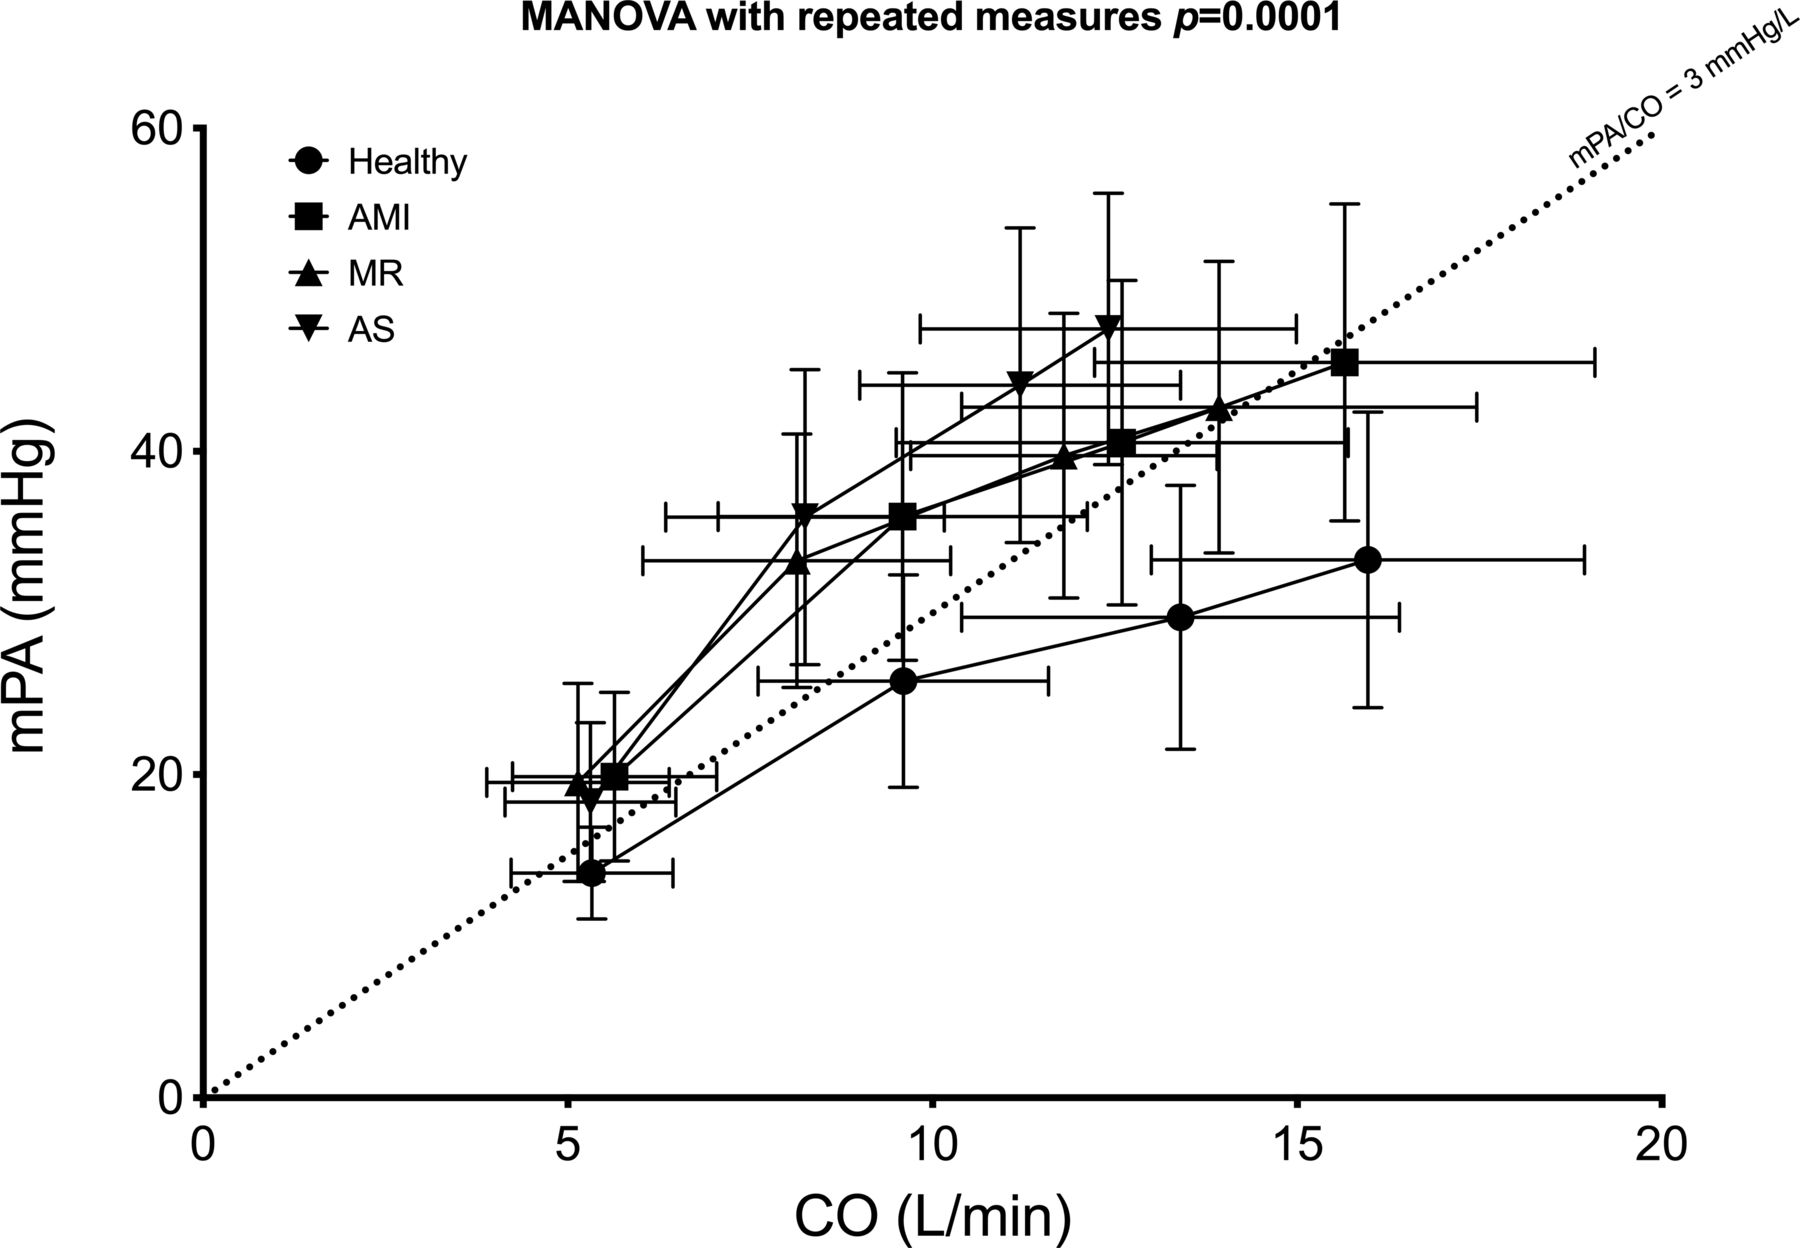
Similar to the effects on systemic circulation, exercise caused significant increases in pulmonary pressures in all four groups. At peak exercise, healthy individuals had significantly lower mPAP and lower ∆mPAP than patients with AS, MR and AMI. The rise in mPAP relative to CO (∆mPAP/∆CO) was steepest in the AS group (4.5±1.8 mm Hg/L/min) compared with that in the AMI (2.8±1.3 mm Hg/L/min) and MR (3.0±1.6 mm Hg/L/min) groups, which were in turn higher than that in the healthy group (2.0±1.5 mm Hg/L/min) (p<0.0001). This difference persisted after adjustment for age, sex and BMI (p<0.0001, figure 4). Similar to the systemic effects, the pressure initially increased faster than the flow, creating a higher initial pressure–flow relationship (table 3). More than 50% (17/33) of healthy individuals achieved an average pulmonary pressure–flow relationship above the suggested cut-off of 3 mm Hg/L/min at 25 W compared with 53% (23/43) of MR, 63% (33/52) of AMI and 70% (28/40) of AS. The pulmonary pressure–flow relationship was not affected by the severity of ERO in MR, LVEF in AMI or peak aortic valve gradient in AS assessed by MANOVA. Despite these changes in pulmonary pressures, higher PAC was observed in healthy controls, and in patients with AMI, it persisted with exercise. PVR decreased significantly in patients with AMI and healthy controls with exercise, whereas it was unchanged in patients with MR and AS. There were no differences in the peak exercise RAP or change in RAP with exercise, unlike the systemic effects on the ∆PAWP:∆CO ratio. Exercise caused a decrease in the ∆RAP:∆CO ratio (p<0.0001), but there were no differences between groups (p>0.2).
Slope of the increase in mPAP relative to CO for the healthy (circle), AMI (square), MR (triangle) and AS (inverted triangle) groups at rest, 25 W, 75 W and peak exercise. The dotted line represents an mPAP/CO cut-off at 3 mm Hg/L. Data points represent mean group values. Error bars reflect the SD. Between-group differences were tested by multivariate analysis of variance with repeated measures (Hotelling-Lawley trace) and adjusted for age, gender and body mass index. AMI, acute myocardial infarction; AS, aortic stenosis; CO, cardiac output; mPAP, mean pulmonary arterial pressure; MR, mitral regurgitation; PAWP, pulmonary arterial wedge pressure.
Discussion
The present study was based on invasive haemodynamic assessment during exercise of 168 participants who had pressure overload, volume overload or myocardial impairment or were healthy: (1) each group had no apparent difference in resting haemodynamics; (2) patients with AS have a steeper systemic pressure–flow relationship than patients with AMI and patients with primary MR, who in turn had steeper slopes than healthy subjects; (3) the pulmonary pressure–flow relationship was steeper in patients with AS than in patients with AMI and MR and was also higher than that in healthy subjects; and (4) all groups had a steeper initial pressure–flow relationship.
Resting right heart catheterisation has a limited ability to differentiate participants with pressure overload from those with volume overload or myocardial impairment despite the different aetiologies; this suggests good haemodynamic adaptation at rest to preserve resting CO at near-normal resting filling pressures irrespective of the underlying cardiac pathology.
Invasive exercise testing has gained significant recognition as a valuable method for revealing and elucidating underlying cardiovascular causes of dyspnoea.17 Traditionally, studies have focused on either flow or pressure as their primary endpoint due to the prognostic implications of these measurements. However, individuals can be conditioned to exercise until a certain level of PAWP, and there is a risk of missing potential clinical benefit or harm. Theoretically, participants in a trial could reach similar pressure levels despite achieving different CO values. In the present study, exercise elicited a clear haemodynamic response and separated the groups. Although PAWP increased as anticipated in all groups, the change was smallest in healthy subjects.10 Both patients with MR and patients with AS achieved lower peak CO and a lower CO reserve than participants in the other two groups. Patients with AS achieved higher peak PAWP and ∆PAWP than patients with MR, and they also achieved a steeper ∆PAWP/∆CO slope, suggesting the need for higher filling pressures to increase CO, which implies differences in haemodynamic adaptation between groups. It has been recommended that the systemic pressure–flow relationship (∆PAWP/∆CO) might be a more reliable endpoint, as it uses paired serial measurements of PAWP and CO and not a single paired measurement at peak exercise.18 Especially, a cut-off point for ∆PAWP/∆CO of 2 mm Hg/L has been suggested5 7 as abnormal and used8 as a marker for heart failure with preserved ejection fraction (HFpEF). The pressure–flow relationship is not linear as the initial increase in PAWP is steep from rest to low-level exercise and more graduated between higher levels of exercise, whereas the increase in CO is more linear. This phenomenon might bias the ∆PAWP/∆CO slope, making it difficult to compare ∆PAWP/∆CO slopes, demonstrating the importance of achieving an adequate level of exercise in each patient assessed by lactate levels or respiratory exchange ratio. Although many subjects with cardiac impairments exhibited an abnormal ∆PAWP/∆CO slope, so did one-fifth of the healthy subjects. No study has shown that the ∆PAWP/∆CO is superior to peak exercise PAWP alone.
The pulmonary vascular response to exercise showed that patients with AS had a significantly steeper pulmonary pressure–flow relationship than participants in the other three groups. Similar to the ∆PAWP/∆CO slope, the ∆mPAP:∆CO ratio in the AS group was considerably higher (4.5 mm Hg/L/min) than that of the other groups and similar to the levels observed in pulmonary vascular disease.19 Patients with MR and AMI had higher slopes (≈3 mm Hg/L/min) than age-matched healthy subjects (2 mm Hg/L/min). Despite a similar pressure–flow relationship between the patients with AMI and patients with MR, PAC was significantly reduced in the MR group compared with the AMI group, revealing differences between the two groups.
The clinical significance of the steeper pressure–flow relationships is unknown and can only be subject to speculation, as this was not assessed in the present groups. A cut-off point of ∆mPA/∆CO of 3 mm Hg/L has been suggested as abnormal18 19 and used6 in patients with scleroderma and pulmonary vascular disease. In pulmonary arterial hypertension, the ∆mPAP/∆CO slope conveys prognostic information,4 6 20 and in HFpEF, the ∆PAWP/∆CO slope has a prognostic impact.5 Patients with AS have a high risk of death and heart failure admissions21 and might be at a higher risk than patients with MR,22 and the steeper ∆mPA/∆CO slope might suggest a more decompensated state of the valvular disease for patients with AS compared with MR.
Limitations
Missing data can potentially lead to bias and loss of precision. In the present manuscript, we accounted for missing data at 25 W in AS and MR by imputation. Although widely used, imputing data has the possibility to introduce new biases. None of the four groups had any evidence of increased diastolic pressure gradient at rest or peak exercise. It is unlikely that patients with AS or MR would develop an increased diastolic pressure gradient at 25 W. The data used for imputation was based on data from all four groups and therefore would tend to diminish between-group differences. Despite this, a difference was still observed.
The four studies were conducted sequentially, and we cannot rule out techniques learnt from the first study that may have impacted later studies. However, the zeroing of the pressure transducers and CO measurements did not change between studies.
When comparing groups during exercise, the peak exercise level (75% of upright ergometer exercise test) in healthy controls is an obvious limitation. However, it is challenging to compare the peak exercise level achieved using a standard upright ergometer with the peak exercise level achieved during invasive exercise using a semisupine ergometer. This has been shown when comparing standard upright ergometer exercise to exercise echocardiography performed using a semisupine exercise ergometer in patients with non-obstructive cardiomyopathy. In this study, patients using semisupine ergometer exercise only reached 78% of the workload achieved during a standard ergometer exercise.23 Furthermore, the between-group differences were apparent at a lower wattage, but lactate levels were similar to those of the controls, so it did not affect our conclusion. Increased RAP affects the left atrial pressure due to atrial interdependency. However, we did not observe any differences in the pressure–flow relationship between RAP and CO, suggesting a limited contribution of atrial interdependency to the increase in PAWP. The gender distributions in AS, AMI and MR were not equal. All three studies included more men than women like previous studies in AS, AMI and MR.24–26 Older women display different haemodynamic response to exercise than men27 We adjusted the statistical model for gender differences but cannot rule out gender bias.
Due to the descriptive nature of this study, the results presented here are hypothesis-generating. Hence, attempts to make any pressure–flow cut-off to discern between groups were not made.
Conclusion
The pressure–flow relationships (systemic and pulmonary) with exercise had distinct slopes according to the underlying disorder, but it is not linear.
Competency in medical knowledge
Pressure–volume relationships, which combine changes in pressure and flow, have distinct slopes according to the underlying disorder.
Transitional outlook
Future work is needed to determine whether pressure–volume relationships are superior to PAWP alone.
Data availability statement
Data are available upon reasonable request.
Ethics statements
Patient consent for publication
Ethics approval
This study involves human participants and was approved by regional science ethic committees for the capital region of Denmark and Southern Denmark. Participants gave informed consent to participate in the study before taking part. All four studies were approved by the local ethics committee’s and were conducted according to the Declaration of Helsinki, registered at the Danish Data Protection Agency and at ClinicalTrials.gov with the previously mentioned identifiers. All participants provided written consent.
References
Supplementary materials
Supplementary Data
This web only file has been produced by the BMJ Publishing Group from an electronic file supplied by the author(s) and has not been edited for content.
Footnotes
Twitter @massaromard
Correction notice This article has been corrected since it was first published. The open access licence has been updated to CC BY.
Contributors The authors contributed to the manuscript with the following. Substantial contributions to the conception or design: MJA, FG and JEM. The acquisition, analysis or interpretation of data: MJA, EW, RB, NC, RC-S, MO, PHF, CH, BB, FG, JSD and JEM. Drafting the work or revising it: MJA, FG, BB, CH, EW, JSD and JEM. MJA is the guarantor of this paper.
Funding Unrestricted grants from the following foundations supported the study: the Danish Council for Independent Research, the Danish Heart Association, the Hartmann Foundation, the Aase and Ejnar Danielsens Foundation, Werner Richter and Wife Foundation, Toyota Foundation, Arvid Nielsen Foundation, Lykfeldts Foundation, the Beckett foundation, the Heede Nielsen Foundation, the Region of Southern Denmark and The Consultants Council of Research Foundation.
Competing interests None declared.
Patient and public involvement Patients and/or the public were not involved in the design, conduct, reporting or dissemination plans of this research.
Provenance and peer review Not commissioned; externally peer reviewed.
Supplemental material This content has been supplied by the author(s). It has not been vetted by BMJ Publishing Group Limited (BMJ) and may not have been peer-reviewed. Any opinions or recommendations discussed are solely those of the author(s) and are not endorsed by BMJ. BMJ disclaims all liability and responsibility arising from any reliance placed on the content. Where the content includes any translated material, BMJ does not warrant the accuracy and reliability of the translations (including but not limited to local regulations, clinical guidelines, terminology, drug names and drug dosages), and is not responsible for any error and/or omissions arising from translation and adaptation or otherwise.