Article Text

Abstract
Objective: To assess the cost effectiveness of primary angioplasty, compared with medical management with thrombolytic drugs, to achieve reperfusion after acute myocardial infarction (AMI) from the perspective of the UK NHS.
Design: Bayesian evidence synthesis and decision analytic model.
Methods: A systematic review was conducted and Bayesian statistical methods used to synthesise evidence from 22 randomised control trials. Resource utilisation was based on UK registry data, published literature and national databases, with unit costs taken from routine NHS sources and published literature.
Main outcome measure: Costs from a health service perspective and outcomes measured as quality-adjusted life years (QALYs).
Results: For the base case, the incremental cost-effectiveness ratio of primary angioplasty was £9241 for each additional QALY, with a probability of being cost effective of 0.90 for a cost-effectiveness threshold of £20 000. Results were sensitive to variations in the additional time required to initiate treatment with primary angioplasty.
Conclusions: Primary angioplasty is cost effective for the treatment of AMI on the basis of threshold cost-effectiveness values used in the NHS and subject to a delay of up to about 80 minutes. These findings are mainly explained by the superior mortality benefit and the prevention of non-fatal outcomes associated with primary angioplasty for delays of up to this length.
- acute myocardial infarction
- primary coronary angioplasty
- thrombolysis
- cost-effectiveness analysis, comprehensive decision analysis
Statistics from Altmetric.com
- acute myocardial infarction
- primary coronary angioplasty
- thrombolysis
- cost-effectiveness analysis, comprehensive decision analysis
Effective and cost-effective management of coronary heart disease in the UK is an NHS priority. In particular, the timely and efficient management of acute myocardial infarction (AMI) comprises the cornerstone of the Coronary Heart Disease National Service Framework.1 Although the management of AMI has improved in the UK, with an associated 16% reduction in mortality between 1999 and 20012 reducing the gap in death rates between this country and others in Europe,3 4 many of these deaths are still considered to be potentially preventable.
Thrombolysis remains the predominant reperfusion strategy for ST-segment elevation myocardial infarction in the UK, but its use has limitations. In particular, normal coronary flow is restored in only 25–50% of patients, depending on the choice of thrombolytic drug.5 The increased use of primary angioplasty has been suggested as one approach to improve further the management of patients with AMI.6 However, the question of whether primary angioplasty should become the first-line treatment in the UK is still the subject of considerable debate.7 8
The Department of Health and the British Cardiac Society have recently set up the National Infarct Angioplasty Project (NIAP), a study to assess the feasibility of implementing a national primary angioplasty service in 10 NHS pilot centres across England.3 9 Apart from the logistic and economic implications derived from any structural change in healthcare provision, one possible reason for the limited use of primary angioplasty in the UK NHS is the lack of evidence about its cost effectiveness: no studies have been published relating to UK practice and expressing outcomes as quality-adjusted life years (QALYs), which facilitate comparison with other uses of health service resources. Our aim was to develop a UK-specific cost-effectiveness model of primary angioplasty compared with thrombolysis on the basis of existing evidence.
METHODS
Overview
A probabilistic decision analytic model was constructed. A systematic review was conducted to update the most comprehensive meta-analysis in this area,10 and Bayesian statistical methods were used to synthesise the effectiveness evidence from 22 randomised control trials.11 The model was developed as a comprehensive decision analysis,12 13 where the individual components of the decision modelling were dealt with simultaneously and evaluated using a Markov Chain Monte Carlo simulation implemented in the specialist software WinBUGS.14
QALYs were used as the measure of health outcome. The structure of the decision analytic model and its underlying assumptions were developed in discussion with a group of clinical advisors, all experienced consultant cardiologists from the UK. The model considered the costs from the perspective of the NHS, using 2003–4 prices, with costs and benefits discounted at 3.5% a year.15 Details of the updated systematic review and evidence synthesis are presented in a companion paper to this.11 Full technical details of all methods can be found in a technical report (available at http://heart.bmj.com/supplemental).
Model structure
The decision model comprised two main elements: a decision tree that captured the short-term events and costs associated with the management of AMI using either thrombolysis or primary angioplasty up to 6 months after an initial AMI episode; and a long-term Markov model,16 which extrapolated the analysis to a lifetime time horizon using an annual cycle. Figure 1 provides a schematic diagram of the model structure. More information about the model and a detailed diagrammatic representation are provided in the technical report.17
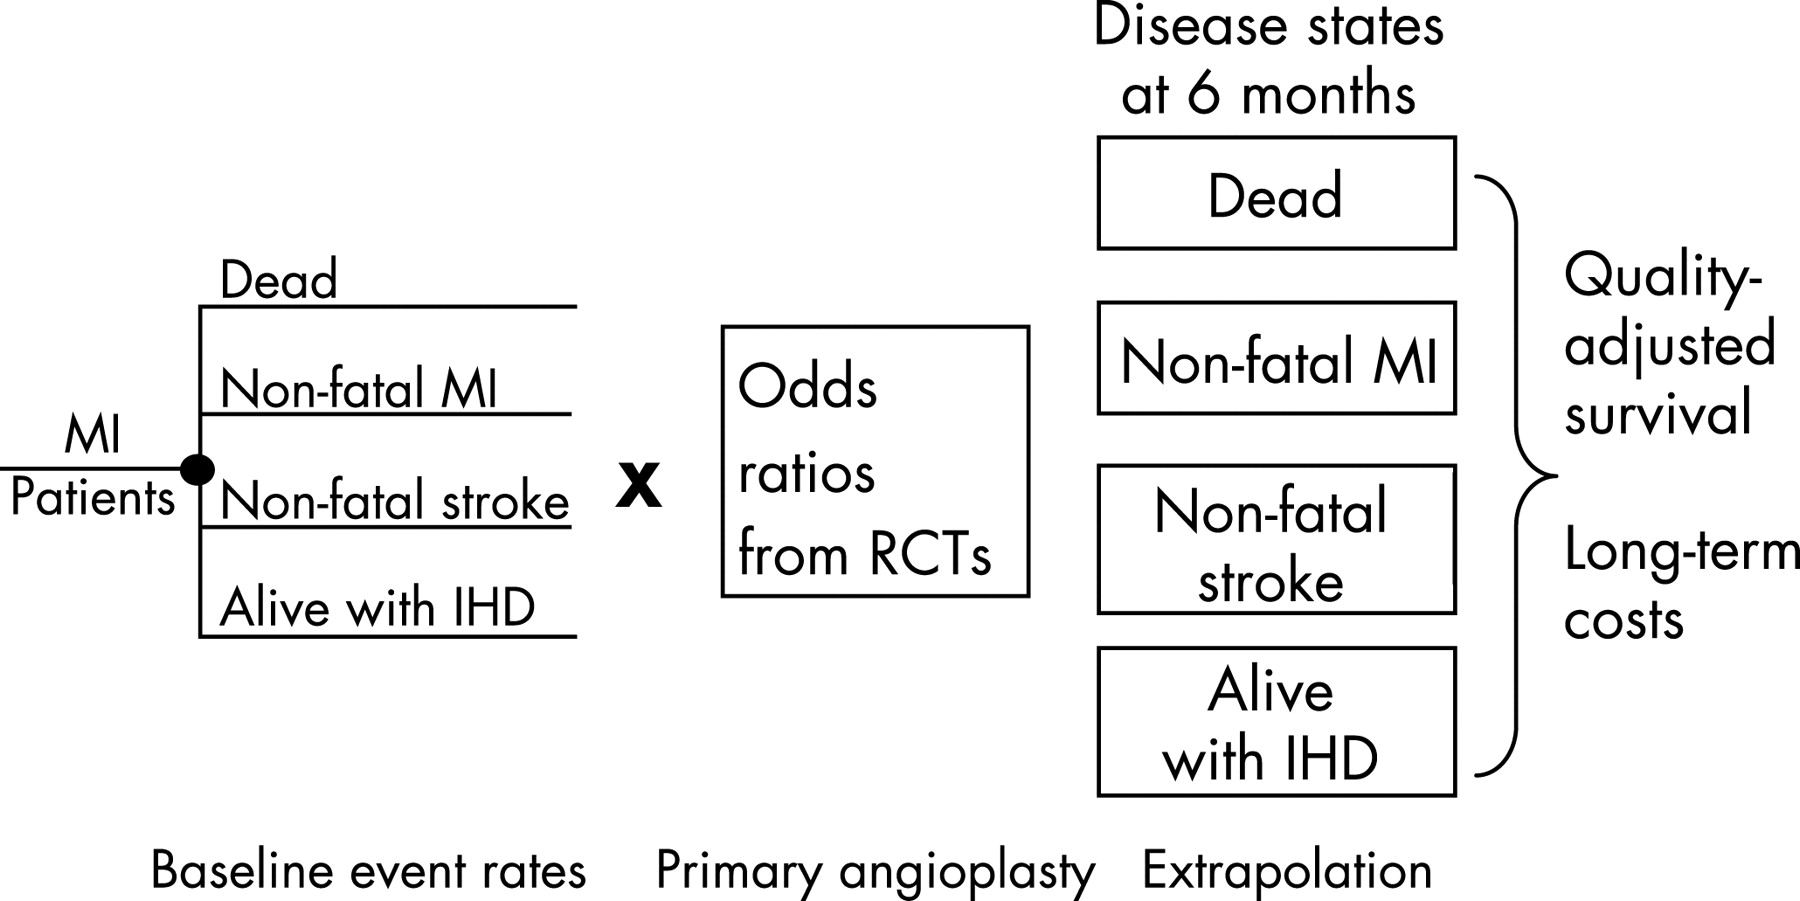
Event rates with thrombolysis (referred to as “baseline” event rates) were multiplied by the pooled odds ratios (ORs) estimated from the evidence synthesis to quantify the absolute effect of primary angioplasty. The possibility of needing a further revascularisation was also modelled. The short-term model was used to determine, for each treatment, the costs incurred during the initial 6 months after treatment. In addition, it established the proportions of patients that entered the different health states of the long-term extrapolation model: death, alive without further events (ischaemic heart disease state (IHD)), repeated non-fatal myocardial infarction (MI) and non-fatal stroke. The long-term extrapolation provided an estimate of lifetime costs and QALYs conditional on surviving the first 6 months.
Model inputs
Clinical effectiveness
Table 1 presents the clinical effectiveness inputs used to inform the cost-effectiveness model. Bayesian evidence synthesis was used to inform the clinical effectiveness measures for the short-term model, based on an average of all streptokinase and fibrin-specific trials.11 Outcomes were estimated as a function of the additional time delay associated with primary angioplasty compared with thrombolysis defined as the mean difference between time-to-balloon in primary angioplasty and time-to-needle in thrombolysis (mean (SE) 54.3 (2.2) minutes).
The base-case analysis establishes the cost effectiveness of primary angioplasty on the assumption that the average patient is treated as in the randomised trials included in the meta-analysis, and in centres that have the necessary infrastructure. As a result, the angioplasty-related time delay applied in the base-case analysis is based on the average figure reported across the trials (54.3 minutes). A series of sensitivity analyses were also undertaken to explore the impact of variation in the estimate of time delay on the cost-effectiveness results. Separate analyses were undertaken for delays of 30, 60 and 90 minutes. Table 1 also shows the pooled odds ratios applied at these different time delays.
Table 2 summarises the main input variables and sources applied in the cost-effectiveness model. The various components are described below.
Resource use and costs during the short-term period (6 months)
The resources considered include those associated with the initial interventions (eg, drug acquisition costs, procedure costs and associated hospital length of stay) and subsequent events occurring over the following 6 months, such as further revascularisations and major clinical events (either repeat MI or stroke). For the base-case analysis, we used national statistics on the average length of hospital stay for patients with AMI based on Hospital Episode Statistics.18 Hence, in the absence of reliable data with which to quantify the potential impact of primary angioplasty on the length of the initial hospitalisation, we applied a conservative approach by assuming that primary angioplasty has no impact on the duration of hospitalisation (ie, we assumed a mean length of stay of 10 days for each strategy). A separate sensitivity analysis was also conducted17 using estimates from a sample of 80 patients from Hammersmith and Charing Cross Hospital, in order to assess the implications of a shorter length of stay with primary angioplasty than with thrombolysis (Morgan K, personal communication, 2005).
We also applied a conservative assumption about resource use and costs for all consumables and adjunctive drugs used with primary angioplasty. The base-case analysis assumed that all patients receiving primary angioplasty would receive an angiogram, adjunctive glycoprotein IIb/IIIa antagonists (GPAs) and stents during the initial procedure, although, in reality, the use of these adjunctive treatments is likely to vary between different hospitals. Reflecting their use in the trials, the unit cost of bare metal stents was used. Drug costs were taken from the British National Formulary,19 based on licensed dosages. Other unit costs were obtained from NHS reference costs20 and published literature.21 22
Long-term event rates and costs
The long-term implications of two short-term (“prognostic”) events were modelled over the long term: non-fatal MIs and non-fatal strokes. In the absence of long-term trial evidence on the prognosis of these patients after primary angioplasty or thrombolysis, UK registry data were used to calculate long-term event rates and associated costs. This “extrapolation modelling” assumed no continued treatment effect difference between thrombolysis and angioplasty beyond 6 months. The Nottingham Heart Attack Registry (NHAR)23 was used to estimate resource use and transition probabilities for the long-term model. NHAR was selected because extensive follow-up data had been collected (5-years’ follow-up) and provided detailed information on both the frequency and timing of recurrent events as well as resource utilisation. Transition probabilities were calculated from the NHAR data using survival analysis techniques. Although non-cardiac mortality was recorded in the NHAR, the probability of non-cardiac mortality was based on UK life tables owing to the small number of these events.2
Quality adjustment
To estimate QALYs, it is necessary to quality adjust the period of time the average patient is alive within the model using an appropriate utility or preference score. In the absence of utility data from the trials and the NHAR, external estimates of utility data were sought in order to differentiate between the health status of patients according to the different states of the model. A literature review was undertaken to obtain estimates of utilities for the different long-term health states. A single utility score for patients with a stroke was applied, which was weighted by the probability that this event was disabling or not.24
Analytical methods
The model was run probabilistically and the uncertainty in the individual measures was fully characterised using the probability distributions summarised in table 2. The results of the model are presented in two ways. First, mean lifetime costs and QALYs for both strategies are reported and their cost effectiveness presented using incremental cost-effectiveness ratios (ICERs).28 Second, decision uncertainty is presented as the probability that each intervention is considered the more cost effective for a given cost-effectiveness threshold.
The following analyses are undertaken. First, the impact on the cost-effectiveness results of a range of alternative time delays (30, 60 and 90 minutes) is explored. Second, the base-case assumption of equal durations of initial hospital stays with both treatments is relaxed and the impact of differential lengths of initial hospitalisation stay (5.8 days (SE 1.6) for primary angioplasty; 12.1 (SE 2.9) for thrombolysis) (Morgan K, personal communication, 2005) assessed. Third, the implications of higher costs for primary angioplasty because of the need to invest in new infrastructure in hospitals without existing facilities are explored.
RESULTS
Clinical effectiveness
The full clinical results from the evidence synthesis have been published.11 Briefly, the results showed that for the average time delay (54 minutes) the mean event probabilities were lower for primary angioplasty for all outcomes. Mortality within 6 months was 5.5% after angioplasty and 7.7% after thrombolysis (OR = 0.70; 95% credible interval (CrI) 0.42 to 1.18). For non-fatal re-infarction, the OR was 0.33 (95% CrI 0.20 to 0.67); and for non-fatal stroke 0.26 (95% CrI 0.08 to 0.72). For all outcomes, the benefit of angioplasty decreased with longer treatment initiation delay (table 1).
Cost effectiveness: base-case analysis
Table 3 presents the base-case results. Primary angioplasty is the most expensive option (mean lifetime costs £12 760 vs £10 080), but it was also associated with a mean lifetime QALY gain of 0.29 (7.12 vs 6.83). The ICER associated with primary angioplasty compared with thrombolysis was £9241 for each additional QALY, hence primary angioplasty will be the optimal treatment provided that the NHS is prepared to pay at least this amount. The probability that primary angioplasty is cost effective is around 0.55 for a cost-effectiveness threshold of £10 000, increasing to almost 1 for a threshold of £30 000 per QALY.
Cost effectiveness: alternative scenarios
Reducing the time delay to 30 minutes improves the estimate of cost effectiveness, with a reduction of the ICER to £6850 per QALY. Furthermore, the probability that this strategy is cost effective is 0.82 at a threshold of £10 000, increasing to close to 1 for a threshold of £20 000 and above. These results are explained by a higher mortality benefit at 30 minutes (OR = 0.54; 95% CrI 0.29 to 0.92) and a slightly higher prevention of non-fatal reinfarction than those estimated based on the average time delay.
As expected, results at 60 minutes were similar to those for average time delay, but increasing the time delay up to 90 minutes resulted in a sevenfold increase in the base-case ICER (£64 750 per QALY) and a substantial reduction in the probability that primary angioplasty was considered cost effective at conventional thresholds considered to represent value for money in the NHS.15 This is explained by the fact that no additional mortality benefit is apparent with primary angioplasty for 90 minutes’ delay in starting treatment.
The alternative setting with lower length of initial hospitalisation with primary angioplasty (5.76 days compared with 12.12 days for the thrombolytic strategy) showed an improvement in the estimate of cost effectiveness, with a reduction of the ICER for all time delays. In this setting, even for a delay up to 90 minutes, primary angioplasty was the optimal strategy for a threshold of £30 000.
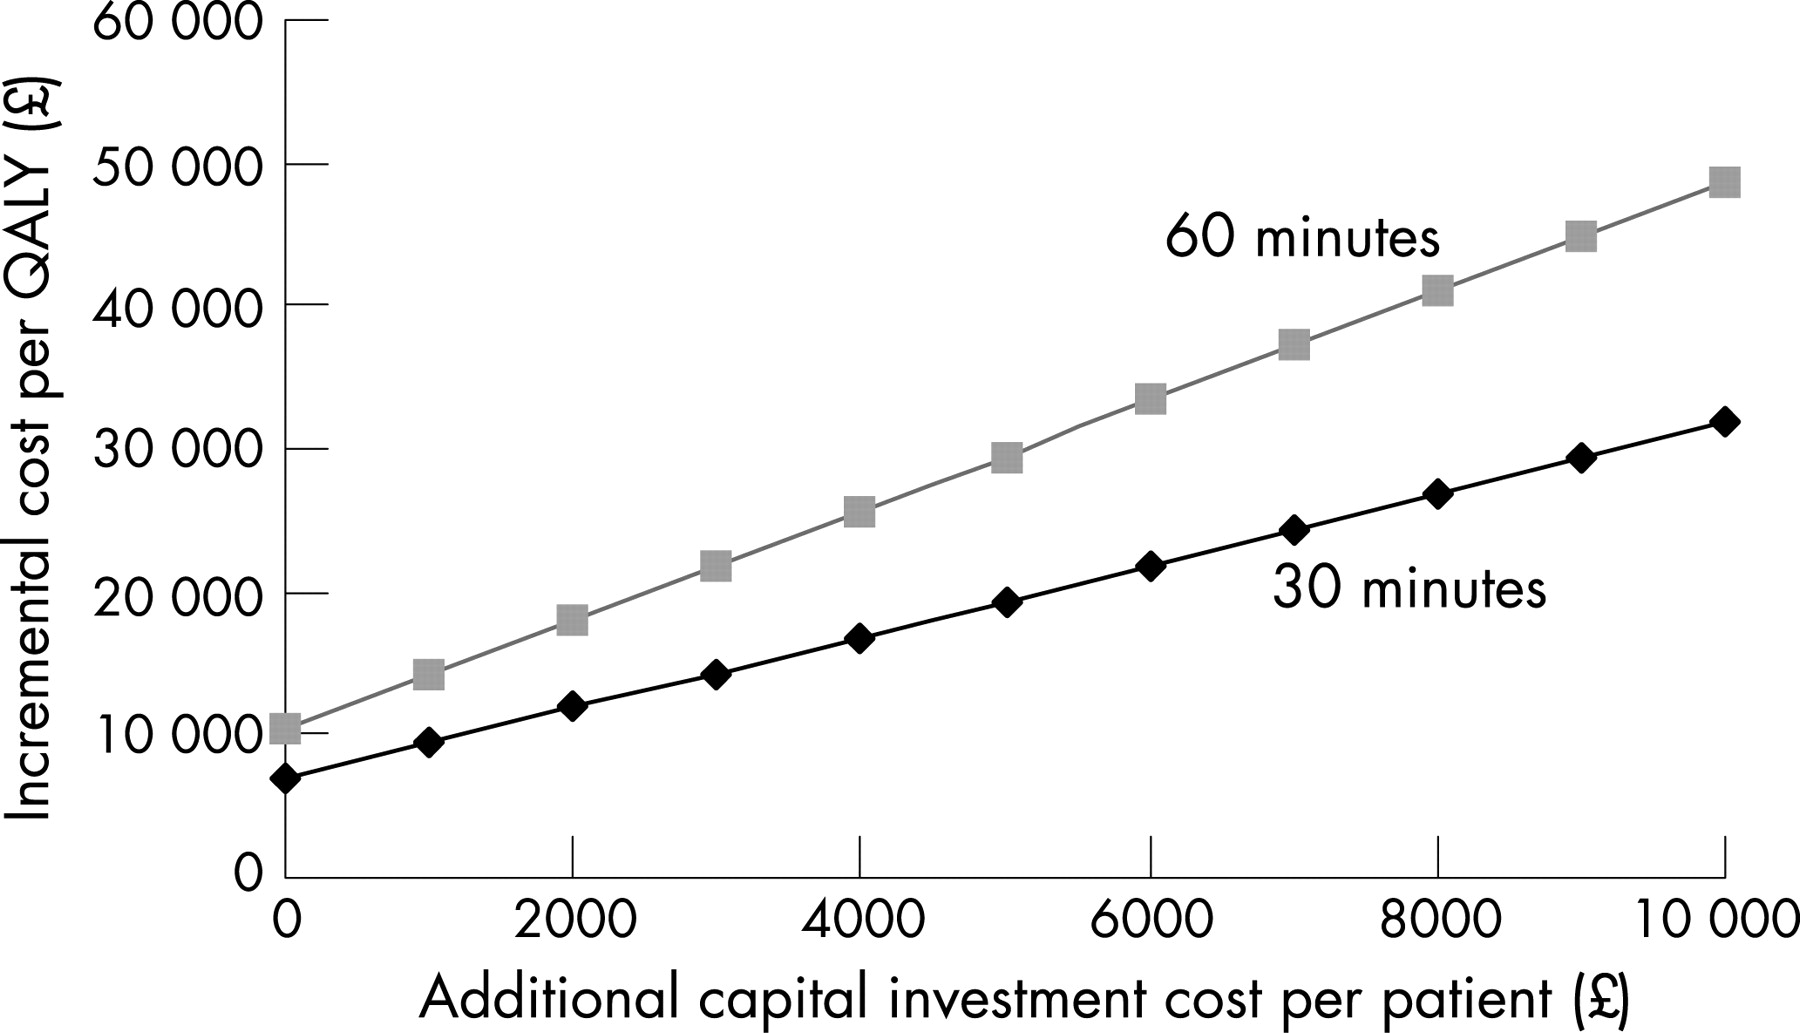
The cost-effectiveness results presented here are based on the assumption that centres already have the necessary infrastructure to provide primary angioplasty. Figure 2 presents a threshold analysis showing the impact of additional investment costs in new facilities for primary angioplasty that may be necessary in some centres. This represents an “up front” capital investment allocated per patient for primary angioplasty. This demonstrates that, in cases where the additional investment costs are up to the equivalent of £9000 per patient and when the additional time delay associated with primary angioplasty over thrombolysis is no higher than 60 minutes, the cost effectiveness of primary angioplasty would be in the region of £20 000 to £40 000 per QALY. In those cases where additional investment cost per patient is higher than £9000, thrombolysis is the optimal strategy.
DISCUSSION
Several studies have looked at the economics of primary angioplasty.29–31 For decision making in the UK NHS, however, a cost-effectiveness analysis should have some key features.15 These include the incorporation of all relevant trial evidence on clinical effects, the expression of outcomes as QALYs for comparison across clinical areas and the use of UK costs. Some studies have been based on systematic reviews of clinical effects,29 two used QALYs30 31 and one UK costs,29 but we are not aware of any existing study with all these features.
Despite hitherto limited evidence for its cost effectiveness, widening the use of primary angioplasty in the UK NHS is already being considered. Findings from the NIAP project, due in 2008, will inform policy on the provision of primary angioplasty as a first treatment for patients who have a heart attack.3 9 Results from the analysis presented here suggest that primary angioplasty is cost effective based on the cost-effectiveness thresholds used by the National Institute for Health and Clinical Excellence (£20 000 to £30 000 per additional QALY15 32). This conclusion, however, is sensitive to the additional time delay associated with primary angioplasty. The results from the different scenarios suggest that primary angioplasty may not be cost effective for an additional delay somewhere within the region of 60 to 90 minutes. An additional analysis was undertaken to identify the time at which primary angioplasty no longer seems to be cost effective compared with thrombolysis. At a cost-effectiveness threshold of £20 000 per QALY, primary angioplasty appears cost effective for delays of less than 79 minutes (and 84.5 minutes at £30 000 per QALY). The cost effectiveness of primary angioplasty may also be sensitive to the set-up costs of the service.
The comprehensive decision modelling methods used in the analyses presented here allow both evidence synthesis and decision analytical models to be combined within a single coherent modelling framework, which not only allows all sources of uncertainty to be appropriately propagated throughout the analysis, and consequently included in the overall cost-effectiveness estimates, but also allows appropriate consideration of the correlation induced when the same evidence source contributes to multiple components of the decision model.12 The Bayesian approach also enables the inclusion of complex data structures and networks of evidence without the need to make distributional assumptions about model inputs.12 13 33
In addition to handling the uncertainty in the evidence, it is also important to reflect variation—for example, in clinical context and practice, resource use and costs between hospitals. Analyses of various scenarios have been used here to assess the implications of additional time delay in providing angioplasty, differential lengths of hospital stay and additional investment cost in new facilities. These show the likely boundaries of the cost effectiveness of primary angioplasty. Each input into the analysis is estimated with uncertainty but, using probabilistic methods, the analysis shows that, for most settings, primary angioplasty has the highest probability of being cost effective even at lower cost-effectiveness thresholds. However, the remaining decision uncertainty may indicate that further primary research into the costs and effects of primary angioplasty would be good value.17
As is often the case in evaluating medical interventions, technologies advance more rapidly than the evidence base. Since the majority of the trials informing this analysis were undertaken, medical practice for the delivery of thrombolysis and primary angioplasty has changed. For example, a large proportion of patients undergoing primary angioplasty today will have stents and GPAs as adjuvant drugs. Where possible, assumptions have been used which are conservative with respect to primary angioplasty (ie, tend to underestimate its cost effectiveness). For example, the use of stents and GPAs has been included as part of the cost of the primary angioplasty procedure, although only a proportion of patients in the most recent trials included in our review used them, and thus their influence on the overall estimated effectiveness was low. A sensitivity analysis (not reported here) has been undertaken using the price of streptokinase and including trials using only fibrin-specific thrombolytic agents, with no major changes in the results.17 Moreover, an increasing proportion of patients undergoing thrombolysis will later receive “rescue” percutaneous coronary intervention to achieve reperfusion or revascularisation before discharge. This would probably affect the cost and effectiveness of a strategy of initial thrombolysis. This is also likely to be true for a large proportion of patients receiving pre-hospital thrombolysis.34
The lack of individual patient data from the trials precludes an analysis of how the relative effectiveness and cost effectiveness of angioplasty varies between subgroups of patients defined by their clinical and sociodemographic factors, so cost effectiveness is presented for the “average” patient reflected in the evidence. Our analysis should not be used to determine whether an individual patient should or should not receive primary angioplasty, but may reflect how cost effective a primary angioplasty service might be, depending on mean call-to-balloon times for the population being served. Furthermore, it has to be recognised that patients in routine practice are likely to show some differences from those included in trials. There is some conflicting evidence on whether primary angioplasty will be more or less effective in routine practice.35 36
Some limitations to the analysis should be noted. First, the time between patients contacting emergency services and receiving thrombolysis is a predictor of efficacy.37 38 However, this likely source of variability in cost effectiveness could not be explicitly included in the analysis owing to inconsistent reporting in the trials. Therefore, results presented here represent average time-to-needle (54.3 minutes), which is similar to the mean time-to-needle in the UK of 67 minutes (personal communication, Dr John Birkhead, UK Myocardial Infarction National Audit Project). Second, given that our systematic review was an update of a previously published meta-analysis,10 neither the effect of publication bias nor study quality were formally assessed. Third, ideally the analysis would have compared the full range of reperfusion strategies, including different thrombolytic agents, alternative modes of administration and the use of rescue or facilitated angioplasty.39 40 These analyses represent significant extensions of the work presented here.
In conclusion, the analysis suggests that primary angioplasty is cost effective for the treatment of AMI, on the basis of threshold values used in the NHS, for a time delay of up to about 80 minutes.
A supplementary technical report is available on the Heart website—http://heart.bmj.com/supplemental
Acknowledgments
We gratefully acknowledge the contribution of our clinical Expert Advisory Group consisting of Drs David Gray, Rob Henderson and Jim McLenachan. The views expressed are those of the authors who are also responsible for any errors.
REFERENCES
Supplementary materials
Files in this Data Supplement:
Footnotes
This study was funded by an unrestricted educational grant to the University of York from Cordis Ltd. The contract ensured the researchers’ freedom to design, implement and publish their work. Mark Sculpher also received funding via a Career Award in Public Health funded by the NHS Research and Development Programme.
Competing interests: Mark Sculpher and Mark de Belder have received research funding and consultancy fees from various manufacturers of medical devices such as coronary stents. No other authors have competing interests to declare.
- Abbreviations:
- AMI
- acute myocardial infarction
- CrI
- credible interval
- GPAs
- glycoprotein IIb/IIIa antagonists
- ICER
- incremental cost-effectiveness ratio
- MI
- myocardial infarction
- NHAR
- Nottingham Heart Attack Registry
- NIAP
- National Infarct Angioplasty Project
- OR
- odds ratio
- QALYs
- quality-adjusted life years
Linked Articles
- Featured editorial
- Editorial