Article Text

Abstract
Objective: To investigate the performance of low-dose, dual-source computed tomography (DSCT) coronary angiography in the step-and-shoot (SAS) mode for the diagnosis of significant coronary artery stenoses in comparison with conventional coronary angiography (CCA).
Design, setting and patients: Prospective, single-centre study conducted in a referral centre enrolling 120 patients (71 men, mean (SD) age 68 (9) years, mean (SD) body mass index 26.2 (3.2) kg/m2). All study participants underwent DSCT in the SAS mode and CCA within 14 days. Twenty-seven patients were given intravenous β blockers for heart rate reduction before CT. Patients were excluded if a target heart rate ⩽70 bpm could not be achieved by β blockers or when the patients were in non-sinus rhythm. Two blinded readers independently evaluated coronary artery segments for assessability and for the presence of significant (>50%) stenoses. Sensitivity, specificity, negative (NPV) and positive predictive values (PPV) were determined, with CCA being the standard of reference. Radiation dose values were calculated.
Results: DSCT coronary angiography in the SAS mode was successfully performed in all 120 patients. Mean (SD) heart rate during scanning was 59 (6) bpm (range 44–69). 1773/1803 coronary segments (98%) were depicted with a diagnostic image quality in 109/120 patients (91%). The overall patient-based sensitivity, specificity, PPV and NPV for the diagnosis of significant stenoses were 100%, 93%, 94% and 100%, respectively. The mean (SD) effective dose of the CT protocol was 2.5 (0.8) mSv (range 1.2–4.4).
Conclusions: DSCT coronary angiography in the SAS mode allows, in selected patients with a regular heart rate, the accurate diagnosis of significant coronary stenoses at a low radiation dose.
Statistics from Altmetric.com
Computed tomography coronary angiography is an accurate method for the non-invasive diagnosis of coronary artery disease (CAD).1–8 Because of the high robustness, performance and clinical implications of the technique, cardiac CT is increasingly performed in more and more centres world wide.9 The recent advances in the spatial and temporal resolution of cardiac CT, however, were obtained at the cost of an increased radiation dose. This was mainly caused by the thin detector widths and the low helical pitch values, the latter being required for data acquisition in the retrospective ECG-gating mode. Recently, serious concerns about the increasing use of CT and the associated increase in the collective radiation dose to the general population have abounded.10
Several techniques for reduction of the radiation exposure of cardiac CT examinations to a degree that is as low as reasonably achievable have been developed. These include the ECG-based tube current modulation algorithm,11 a reduction of tube voltage12 and the implementation of attenuation-based tube current modulation.13 Another algorithm that is associated with a low radiation exposure is prospective ECG triggering, or step-and-shoot (SAS) mode. With this technique, radiation is only applied at a predefined time point of the cardiac cycle, rather than during the entire cardiac cycle as with retrospective ECG gating. The SAS mode is the standard technique of data acquisition of early single-slice sequential CT scanners. Currently, the technique is mainly used for calcium scoring,14 but has been recently reconsidered for CT coronary angiography examinations as well.15 Some recent CT studies have shown that the SAS mode offers a diagnostic image quality of the coronary arteries with substantially reduced effective radiation doses of only 1–4 mSv.16–18 However, no data exist so far to demonstrate the accuracy of CT coronary angiography in the SAS mode for the diagnosis of CAD.19
The purpose of this study was to assess the diagnostic performance of low-dose, dual-source CT coronary angiography in the SAS mode in comparison with quantitative coronary angiography (QCA).
MATERIAL AND METHODS
We prospectively enrolled 130 patients (78 men; 52 women, mean (SD) age 69.8 (8.7) years, range 44–85) who had undergone conventional coronary angiography (CCA) and CT for evaluation of suspected CAD (fig 1). Reasons for referral were atypical chest pain in 87 (67%) and typical chest pain in 43 patients (33%). The majority of the patients (81%) had an intermediate pre-test likelihood of CAD, whereas a low likelihood was found in 19% of the patients.20 All patients underwent both imaging modalities within a time interval of 14 days (mean (SD) 8.2 (1.6) days).
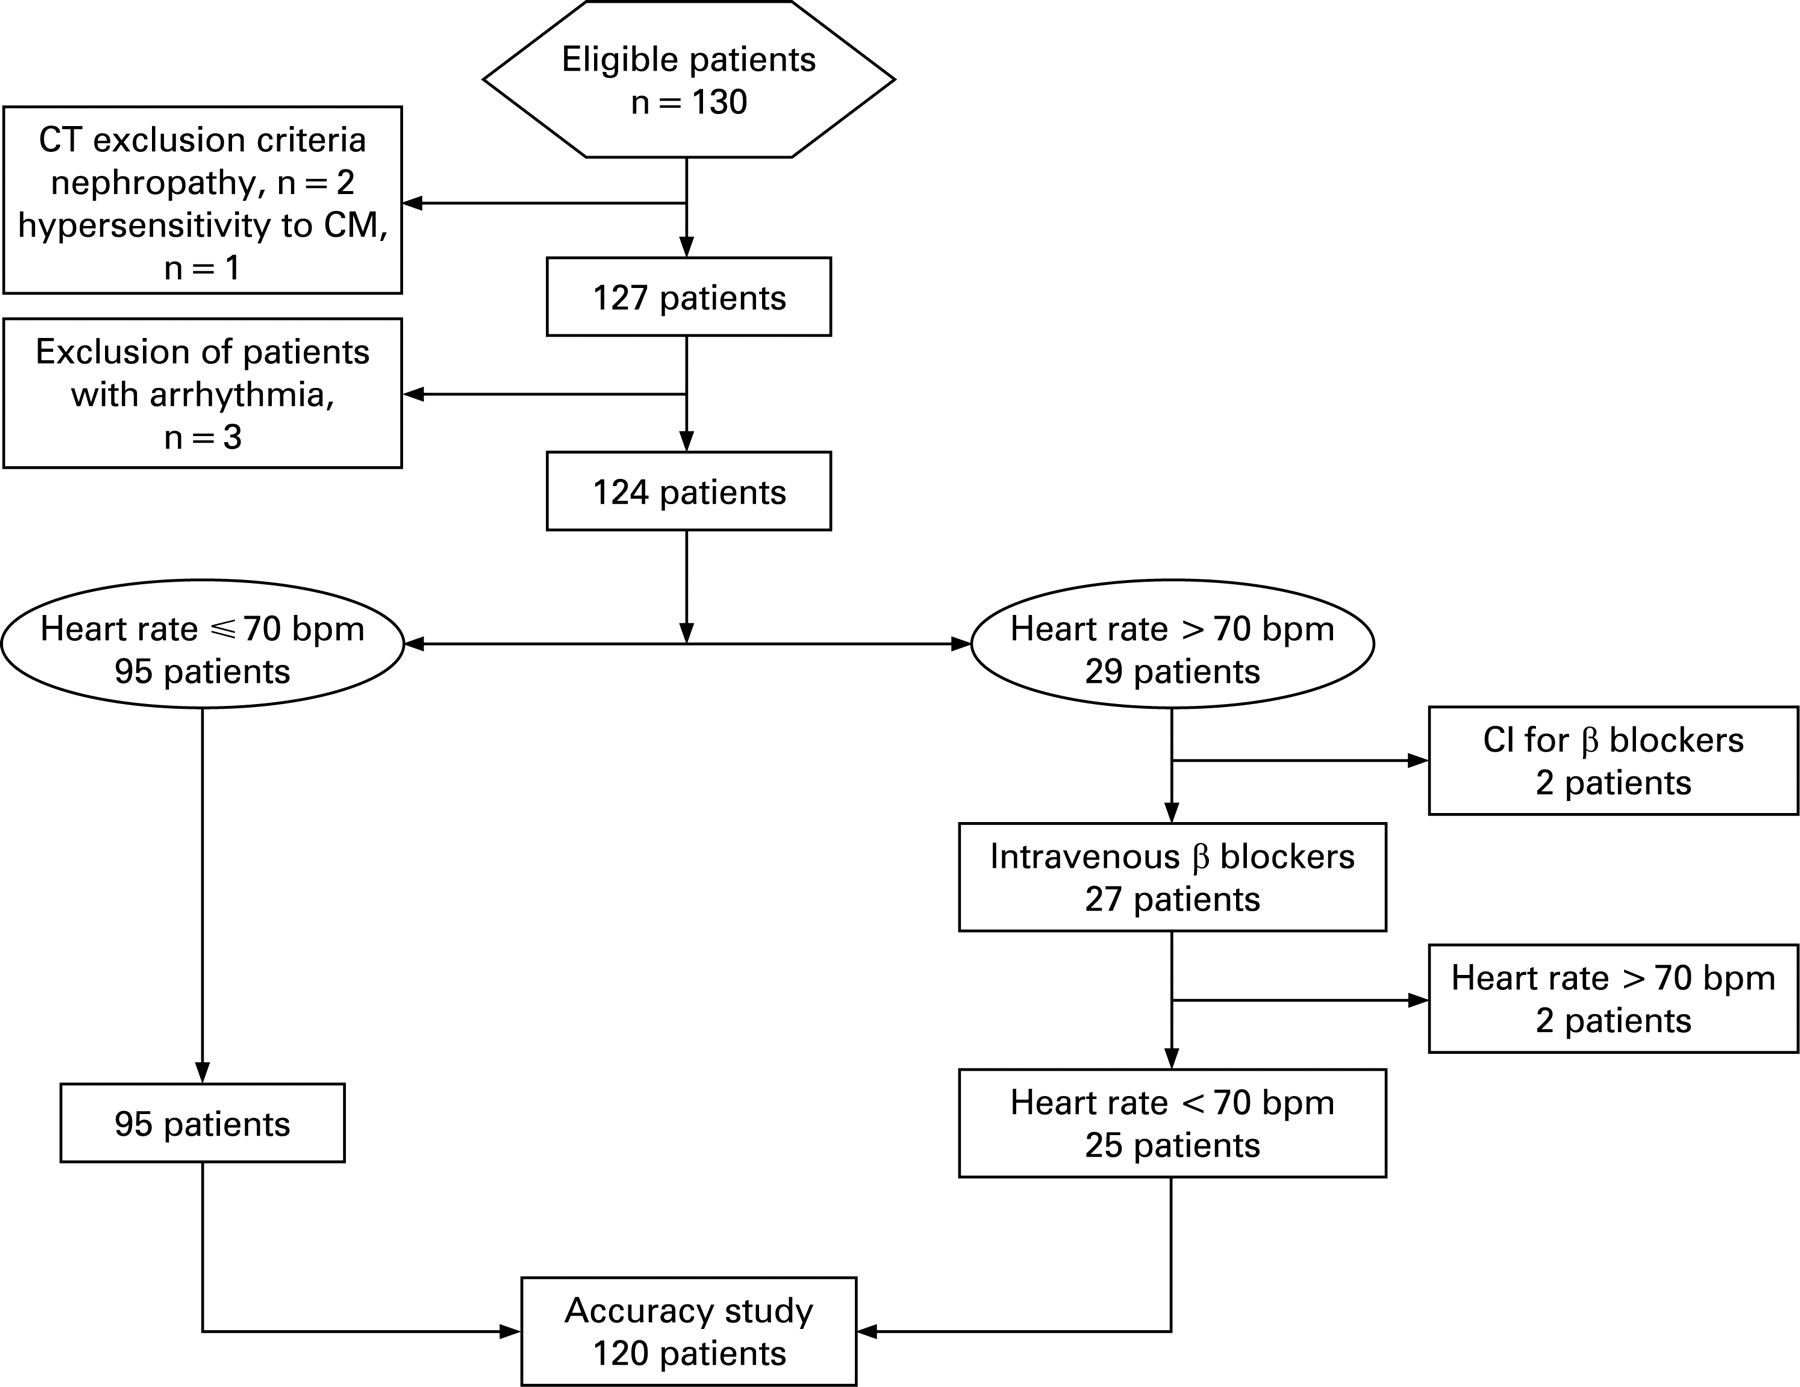
General exclusion criteria for contrast-enhanced CT included nephropathy (serum creatinine level >150 μmol/l) (n = 2) and known hypersensitivity to iodine-containing contrast medium (n = 1). Patients with non-sinus rhythm were excluded from the study (n = 3), because CT scanning the SAS mode requires a regular heart rhythm.15 16 18 Patients were also excluded from this study if a target heart rate ⩽70 bpm could not be achieved after the administration of intravenous (IV) β blockers. Patients with coronary stents and bypass grafts were not included because the focus of this study was to assess the value of the low-dose technique for the diagnosis of CAD.
A total of 95 of the remaining 124 patients (77%) showed heart rates ⩽70 bpm. Thirty-one of these 95 patients (33%) were receiving oral β blockers as part of their baseline treatment. The other 29 patients (23%) showed mean heart rates >70 bpm during the preparation time of CT. Twenty-seven of these 29 patients (93%) received IV β blockers for heart rate reduction before CT; 2 of the 29 patients (7%) had absolute contraindications for the administration of β blockers. The administration of IV β blockers lowered the mean heart rate sufficiently in 25 of the 27 patients (93%) (fig 1). Thus, 120 patients (71 men; 49 women, mean (SD) age 68.2 (8.5) years; range 44–85 years, mean (SD) body mass index (BMI) 26.2 (3.2) kg/m2, range 19.7–36.5 kg/m2) could be included in this study and were scanned in the SAS mode (table 1). Our local ethics committee approved the study; written informed consent was obtained.
CT data acquisition and post-processing
All examinations were performed on a dual-source computed tomography (DSCT) scanner (Somatom Definition, Siemens Medical Solutions, Forchheim, Germany). Data were acquired with a detector collimation of 2×32×0.6 mm, a slice collimation of 2×64×0.6 mm by means of a z-flying spot,21 and a gantry rotation time of 0.33 s. Attenuation-based tube current modulation was used with a reference tube current–time product set at 100 mA per rotation for calcium scoring and 190 mA per rotation for coronary angiography. Patients with a BMI ⩾25 kg/m2 (n = 78) were examined with a tube voltage of 120 kV, whereas patients with a BMI <25 kg/m2 (n = 42) were examined with a tube voltage of 100 kV. This approach was shown to reduce the radiation dose exposure without deterioration in the image quality.12 18 Three minutes before the contrast-enhanced scan, the patients received a single dose of 2.5 mg s.l. isosorbiddinitrate (Isoket, Schwarz Pharma, Monheim, Germany).
The test bolus technique was used to determine the circulation time of the contrast media (10 ml Visipaque 320, 320 mg/ml; GE Healthcare, Buckinghamshire, UK, 50 ml chaser bolus of saline solution) by the use of a dual-head power injector (Stellant; Medrad, Inianola, USA). Contrast media (1.0 ml/kg body weight) was injected at an injection rate of 5.5 ml/s in the 120 kV protocol and 0.8 ml/kg body weight at an injection rate of 4.4 ml/s in the 100 kV protocol.22 All injections were followed by a chaser bolus (same amount as the first phase with a dilution of 1:5 parts saline solution).
Prospective ECG-triggering with DSCT in the SAS mode needed a minimum cycle time of 1.36 s for one acquisition and the subsequent table feed. The temporal resolution was 83 ms. The centre of the data acquisition window was set at 70% of the R–R interval, being the overall best single reconstruction interval.23
Non-enhanced CT angiograms were reconstructed using 3 mm thick non-overlapping slices (reconstruction kernel B35). Images of the contrast-enhanced CT scan were reconstructed with a non-overlapping slice thickness of 0.6 mm, using a medium smooth tissue convolution kernel (B30f). All images were transferred to an external workstation (Multi-Modality Workplace, Siemens) for further analysis.
The mean Agatston score was calculated for each patient from the non-enhanced DSCT data with a detection threshold of 130 HU by using semi-automated software (Calcium Scoring CT, Siemens).
The coronary artery tree was subdivided according to a scheme proposed by the American Heart Association.24 Diameter measurements were performed with an electronic caliper tool. All segments with a diameter of at least 1 mm at their origin were included. All reconstructed images were evaluated by two blinded and independent readers using transverse source images, multiplanar reformations and thin-slab maximum intensity projections on a per-segment basis.
All coronary segments were classified as being diagnostic or non-diagnostic. Causes of image degradation were noted as arterial wall calcifications, motion artefacts, stair-step artefacts or image noise. Motion artefacts were defined as vessel movement resulting in blurred or doubled vessel contours. When one of the two readers classified a vessel segment as being non-diagnostic, the segment was rated as being non-diagnostic independently of an opposite rating of the other reader. Then, both readers assessed all diagnostic segments for the presence or absence of significant coronary stenosis (defined as a diameter narrowing exceeding 50%). Vessel segments distal to occlusions were excluded from analysis. For any disagreement in stenosis rating, consensus agreement was appended.
Quantitative coronary angiography
Angiograms of the target vessels were obtained in at least two orthogonal projections. One reader being blinded to the CT results examined each catheter angiogram using computerised quantitative coronary angiography analysis software (Xcelera, Philips Medical Systems, Netherlands). The angiography catheter width was used as the reference for calibration. After averaging the results from the two orthogonal views, narrowing greater than 50% of the luminal diameter in relation to the reference diameters was defined as a significant stenosis, as previously shown.3 Coronary artery segments were defined according to the scheme of the American Heart Association,24 similar to CT.
Radiation dose estimations
The effective doses of the CT coronary angiography examinations were calculated as previously demonstrated by Hausleiter et al.25 The calculation is based on a method proposed by the European Working Group for Guidelines on Quality Criteria for CT26 that includes the dose–length product (DLP) and a conversion coefficient. The conversion coefficient for the chest (k = 0.017 mSv/mGy.cm) is averaged between male and female models from Monte Carlo simulations.27 The parameters for scanning range, DLP and CTDIvol were obtained from the protocol that summarised the relevant individual radiation exposure parameters of each CT coronary angiography examination.28
Statistical analysis
All statistical analyses were performed by commercially available software (SPSS, release 12.0.1). Continuous variables were expressed as mean (SD) and categorical variables were expressed as frequencies or percentages. The sample size of 120 patients was determined to reach a power level of 90% for detecting a difference of 5% in sensitivity. Interobserver agreements for the detection of coronary artery stenoses were evaluated using κ statistics. Sensitivity, specificity, positive predictive value (PPV) and negative predictive value (NPV) were calculated from χ2 tests of contingency and the 95% CIs were calculated from binomial expression on a per-segment, per-vessel and per-patient basis. QCA was considered the standard of reference. First, per-segment, per-vessel (ie, at least one stenosis identified in the artery) and per-patient (ie, at least one stenosis identified in the patient) based analyses were performed for segments classified as diagnostic. In a second analysis, per-segment, per-vessel and per-patient based accuracy was calculated for all segments, including those previously classified as non-diagnostic. These non-diagnostic segments were rated as positive for stenosis, as previously suggested.6
Comparisons of the protocols using different kilovoltage settings and comparisons of dose estimates were performed by the Mann–Whitney U test. The rate of non-diagnostic segments and the diagnostic accuracy was compared by the non-parametric χ2 test for unrelated variables and the Fisher exact test.
RESULTS
CT examinations in the SAS mode were immediately successful in 118/120 patients (98%). In two patients, the CT examination had to be repeated because of non-diagnostic quality. The mean heart rate of one patient increased from 68 bpm immediately before CT to 84 bpm after the beginning of contrast medium injection and scanning. IV β blockers were re-administered and the heart rate was again sufficiently reduced. Examination was successfully repeated. The other patient had to be re-examined because of insufficient vessel attenuation owing to bolus timing problems.
The CT scans were well tolerated by all patients and all could hold their breath during data acquisition. The mean (SD) scan duration was 15.4 (2.8) s (range 10.4–22.4). The average (SD) heart rate was 59 (6) bpm (range 44–69). Calcified vessel wall deposits were present in 52/120 patients (43%), the median Agatston score was 238 (range 0–2806).
Quantitative coronary angiography
QCA identified 260 significant coronary artery stenoses in 66/120 patients (55%). Single-vessel disease was present in 15/120 (13%), two-vessel disease in 26/120 (22%) and three-vessel disease in 25/120 (21%) patients. Significant coronary artery stenoses were excluded in 54/120 patients (45%) (table 1).
DSCT coronary angiography in the SAS mode
A total of 1803 coronary artery segments were evaluated with CT. Seventy-four segments were missing because of anatomical variants, 27 segments had a diameter <1 mm at their origin and 16 were located distally to an occluded segment.
Of 1803 segments, 1773 (98.3%) were considered to have a diagnostic image quality in 109/120 patients (91%) (fig 2), whereas 30 segments (1.7%) in 11 patients (9%) were considered to be non-diagnostic. Reasons for non-diagnostic image quality were arterial wall calcifications in 3% (1/30) of the segments in one patient having an Agatston score of 455. Motion artefacts occurred in 50% (15/30) of the segments in four patients and stair-step artefacts in 47% (14/30) of the segments in seven patients. Image noise was not found to be the cause of non-diagnostic image quality. The interobserver agreement for the classification of coronary artery segments as being diagnostic or non-diagnostic was good (κ = 0.75).

Diagnostic performance
The κ value for the detection of coronary artery stenosis with DSCT was 0.74, indicating good interobserver agreement.
Including all diagnostic segments into the analysis, DSCT coronary angiography in the SAS mode correctly (true positive (TP)) classified 238/246 significantly obstructed segments (97%) (fig 3). Thirty-one false-positive (FP) and eight false-negative (FN) ratings occurred on a per-segment basis. FP ratings occurred more often in side branches (n = 13) and distal segments (n = 14) than in proximal and mid-coronary segments (n = 4). FN ratings occurred in side branches (n = 2) and distal segments (n = 6). On a per-segment analysis including all segments with diagnostic image quality, the sensitivity, specificity, PPV and NPV were 97%, 98%, 89% and 99%.

On a per-vessel based analysis including all segments with diagnostic image quality, DSCT coronary angiography in the SAS mode correctly (TP) classified 132/133 significantly obstructed vessels (99%). Five FP and one FN ratings occurred on a per-vessel basis. The sensitivity, specificity, PPV and NPV were 99%, 98%, 96% and 100%.
On a per-patient based analysis including all segments with diagnostic image quality, DSCT coronary angiography in the SAS mode correctly (TP) classified 64/64 patients (100%) having at least one significant coronary artery stenosis. Two FP and no FN ratings occurred on a per-patient basis. The sensitivity, specificity, PPV and NPV were 100%, 96%, 97% and 100% (table 2).
On a per-segment based analysis including all segments (irrespective whether of diagnostic of non-diagnostic image quality), DSCT coronary angiography in the SAS mode correctly (TP) detected 252 of 260 significantly obstructed segments (97%). Forty-seven FP and eight FN ratings occurred on a per-segment basis. The sensitivity, specificity, PPV and NPV were 97%, 97%, 84% and 99%.
On a per-vessel based analysis including all segments, DSCT coronary angiography in the SAS mode correctly (TP) classified 140/141 significantly obstructed vessels (99%). Eight FP and one FN ratings occurred on a per-vessel basis. The sensitivity, specificity, PPV and NPV were 99%, 96%, 95% and 100%.
On a per-patient based analysis including all segments, DSCT coronary angiography correctly (TP) classified 66/66 patients (100%) with at least one significant coronary artery stenosis. Four FP and no FN ratings occurred on a per-patient basis. The sensitivity, specificity, PPV and NPV were 100%, 93%, 94% and 100% (table 2).
Radiation dose estimations
No significant differences were found for the scan length (p = 0.49) and the heart rate (p = 0.46) between the two protocols with 100 and 120 kV. The mean (SD) tube current–time product of the protocol with 100 kV was 235 (35) mA (range 168–286) and 237 (36) mA (range 146–298) for the 120 kV protocol. The mean tube current–time products were not significantly different between the protocols (p = 0.74).
The 42 CT examinations with a tube voltage of 100 kV had a mean (SD) CTDIvol of 6.9 (1.9) mGy (range 4.7–10.8) and a mean (SD) DLP of 96.8 (22.7) mGy.cm (range 68.0–144.0). Calculation of the effective dose showed a mean (SD) effective dose of 1.6 (0.3) mSv (range 1.1–2.2) for the 100 kV protocol.
The 78 examinations with a tube voltage of 120 kV had a mean (SD) CTDIvol of 12.5 (1.6) mGy (range 10.0–15.4) and a mean (SD) DLP of 177.7 (30.9) mGy.cm (range 134.0–257.0). The effective dose of the 120 kV protocol was on average 3.0 (0.5) mSv (range 2.3–4.4).
The 100 kV protocol resulted in significantly lower CTDIvol (p<0.001), DLP (p<0.001) and effective dose values (p<0.001) than the 120 kV protocol. The mean (SD) effective dose for all 120 examinations was 2.5 (0.8) mSv (range 1.2–4.4).
The rate of segments with non-diagnostic image quality was not significantly different between both protocols (Fisher exact test p = 0.65). Similarly, no significant differences were found in the segment-based (p = 0.79), vessel-based (p = 0.82) and patient-based (p = 0.57) accuracy between the protocols.
DISCUSSION
To our knowledge, this is the first study demonstrating the diagnostic performance of low-dose CT coronary angiography in the SAS mode for the diagnosis of CAD. Our results indicate that in a cohort of patients with regular heart rates below 70 bpm, DSCT coronary angiography in the SAS mode allows for the depiction of 98% of the coronary segments with a diagnostic image quality. The low-dose technique shows a high diagnostic performance for the diagnosis of CAD that is comparable to that of recent single-source and dual-source 64-slice CT studies conducted in the retrospective ECG-gating mode.1–8 Thus, non-invasive CT coronary angiography is feasible in selected patients in a dose-saving fashion, with effective doses ranging between 1.2 and 4.4 mSv.
Standard cardiac CT examinations with retrospective ECG gating are performed in the spiral mode. Without the implementation of ECG-based tube current modulation, effective doses up to 21 mSv have been reported.2 Hausleiter et al25 reported a mean effective dose of 15 mSv for 64-slice CT coronary angiography without, and of 9 mSv with, the use of ECG-based tube current modulation. Recently, Stolzmann et al28 has reported radiation dose parameters of dual-source CT coronary angiography using ECG-based tube current modulation between 7 and 9 mSv. In our study, cardiac scanning in the SAS mode was associated with an average effective dose ranging between 1.2 and 4.4 mSv. The disadvantage of this technique is that no data from additional phases are acquired and therefore no functional analysis of the left ventricle or valves is possible.
Scanning of patients with CT coronary angiography in the SAS mode requires the use of strict inclusion criteria.18 At lower heart rates, it is generally sufficient to reconstruct a single phase in mid-diastole to obtain a diagnostic image quality of the entire coronary artery tree.23 29 At higher heart rates, however, reconstructions often must be made at several phases of the R–R interval, in order to obtain diagnostic images of different coronary segments.23 29 Thus, higher heart rates preclude the implementation of the SAS mode because only a narrow, predefined reconstruction interval is available with this technique. In our study, dual-source CT coronary angiography examinations in the SAS mode depicted 98% of the segments with diagnostic image quality in patients with regular hearts rates up to 70 bpm. Three patients had to be excluded because of arrhythmia. Another 19 patients had heart rates above 70 bpm before CT. Because two patients showed contraindications for the use of β blockers, medication could be given only to 17 patients and sufficiently lowered the heart rates in 15 of these. Another patient showed a low and regular heart rate during the time of preparation for CT but the data had to be excluded from the analysis because of a steep rise in heart rate that resulted in a severe deterioration in the image quality of the examination.
On a per-segment basis, the PPV of DSCT coronary angiography in the SAS mode was slightly decreased in comparison with the per-patient analysis owing to FP ratings in distal coronary segments and side branches. The occurrence of FP ratings is still a problem of cardiac CT that similarly occurs when using the spiral mode.1–8 It seems that the non-overlapping data acquisition or the lack of additionally available reconstruction intervals that often help to confidently determine the degree of stenosis in the retrospective ECG-gating technique do not represent a general shortcoming of the SAS mode.
Limitations
First, the upper limits of mean and variability of heart rate for the feasibility of CT scanning in the SAS mode were not evaluated. Second, no direct comparison of the SAS mode with the spiral mode was performed in the same patients because of concerns about the radiation dose. Finally, our study group was characterised by a relatively high prevalence of CAD that may have resulted in an overestimation of the ability of DSCT to detect and to rule out stenoses.30
In conclusion, low-dose, dual-source CT coronary angiography in the SAS mode is feasible in selected patients with regular heart rates below 70 bpm and allows for the depiction of 98% of the coronary segments in a diagnostic image quality. The technique provides a high diagnostic performance for the assessment of CAD at a low effective dose of 2.5 mSv.
REFERENCES
Footnotes
Funding: Supported by the National Centre of Competence in Research, Computer Aided and Image Guided Medical Interventions of the Swiss National Science Foundation.
Competing interests: None.
Ethics approval: Approved by the local ethics committee.