Article Text

Abstract
Background Quantitative coronary angiography (QCA) has inherent limitations for displaying complex vascular anatomy, yet it remains the gold standard for stenosis quantification.
Objective To investigate the accuracy of stenosis assessment by multi-detector computed tomography (MDCT) and QCA compared to known dimensions.
Methods Nineteen acrylic coronary vessel phantoms with precisely drilled stenoses of mild (25%), moderate (50%) and severe (75%) grade were studied with 64-slice MDCT and digital flat panel angiography. Fifty-seven stenoses of circular and non-circular shape were imaged with simulated cardiac motion (60 bpm). Image acquisition was optimised for both imaging modalities, and stenoses were quantified by blinded expert readers using electronic callipers (for MDCT) or lumen contour detection software (for QCA).
Results Average difference between true and measured per cent diameter stenosis for QCA was similar compared to MDCT: 7 (±6)% vs 7 (±5)% (p=0.78). While QCA performed better than MDCT in stenoses with circular lumen (mean error 4 (±3)% vs 7 (±6)%, p<0.01), MDCT was superior to QCA for evaluating stenoses with non-circular geometry (mean error 10 (±7)% vs 7 (±5)%, p<0.05). In such lesions, QCA underestimated the true diameter stenosis by >20% in 9 of 27 (33%) vs 1 of 29 (3%) in lumen with circular geometry.
Conclusions QCA often underestimates diameter stenoses in lumen with non-circular geometry. Compared to QCA, MDCT yields mildly greater measurement errors in perfectly circular lumen but performs better in non-circular lesions. These findings have implications for using QCA as the gold standard for stenosis quantification by MDCT.
- Coronary artery disease
- imaging
- atherosclerosis
- CT scanning
- coronary angiography
- coronary artery disease (CAD)
Statistics from Altmetric.com
- Coronary artery disease
- imaging
- atherosclerosis
- CT scanning
- coronary angiography
- coronary artery disease (CAD)
Cardiac catheterisation with coronary angiography continues to be the gold standard for determining the presence or absence of significant coronary luminal stenoses. However, conventional angiography has limitations in displaying complex coronary anatomy because of its inherent limitation as a two-dimensional imaging technique.1
Advances in computed tomography and specifically multi-detector computed tomography (MDCT) have provided the ability to image the coronary artery anatomy non-invasively.2 Because of its tomographic nature, MDCT allows the display of coronary vessels in unlimited projections, including cross-sectional views and three-dimensional vessel reconstruction. Therefore, MDCT should have an advantage over conventional angiography in the assessment of complex coronary anatomy. However, when conventional angiography is used as the gold standard for the assessment of coronary stenoses, this advantage of MDCT cannot be fully utilised nor appreciated. In fact, studies using intravascular ultrasound (IVUS) as the gold standard found superior accuracy for MDCT stenosis quantification compared to quantitative coronary angiography (QCA).3 This is despite evidence that IVUS also has limitations as a gold standard.4 5
Accordingly, the purpose of this study was to compare the accuracy of stenosis quantification by MDCT and QCA in phantom vessels of known luminal dimensions with varying complex lumen geometries. We hypothesised that MDCT provides more accurate stenosis assessment in vessel lumen with complex geometry compared with QCA.
Methods
Study design
Phantom
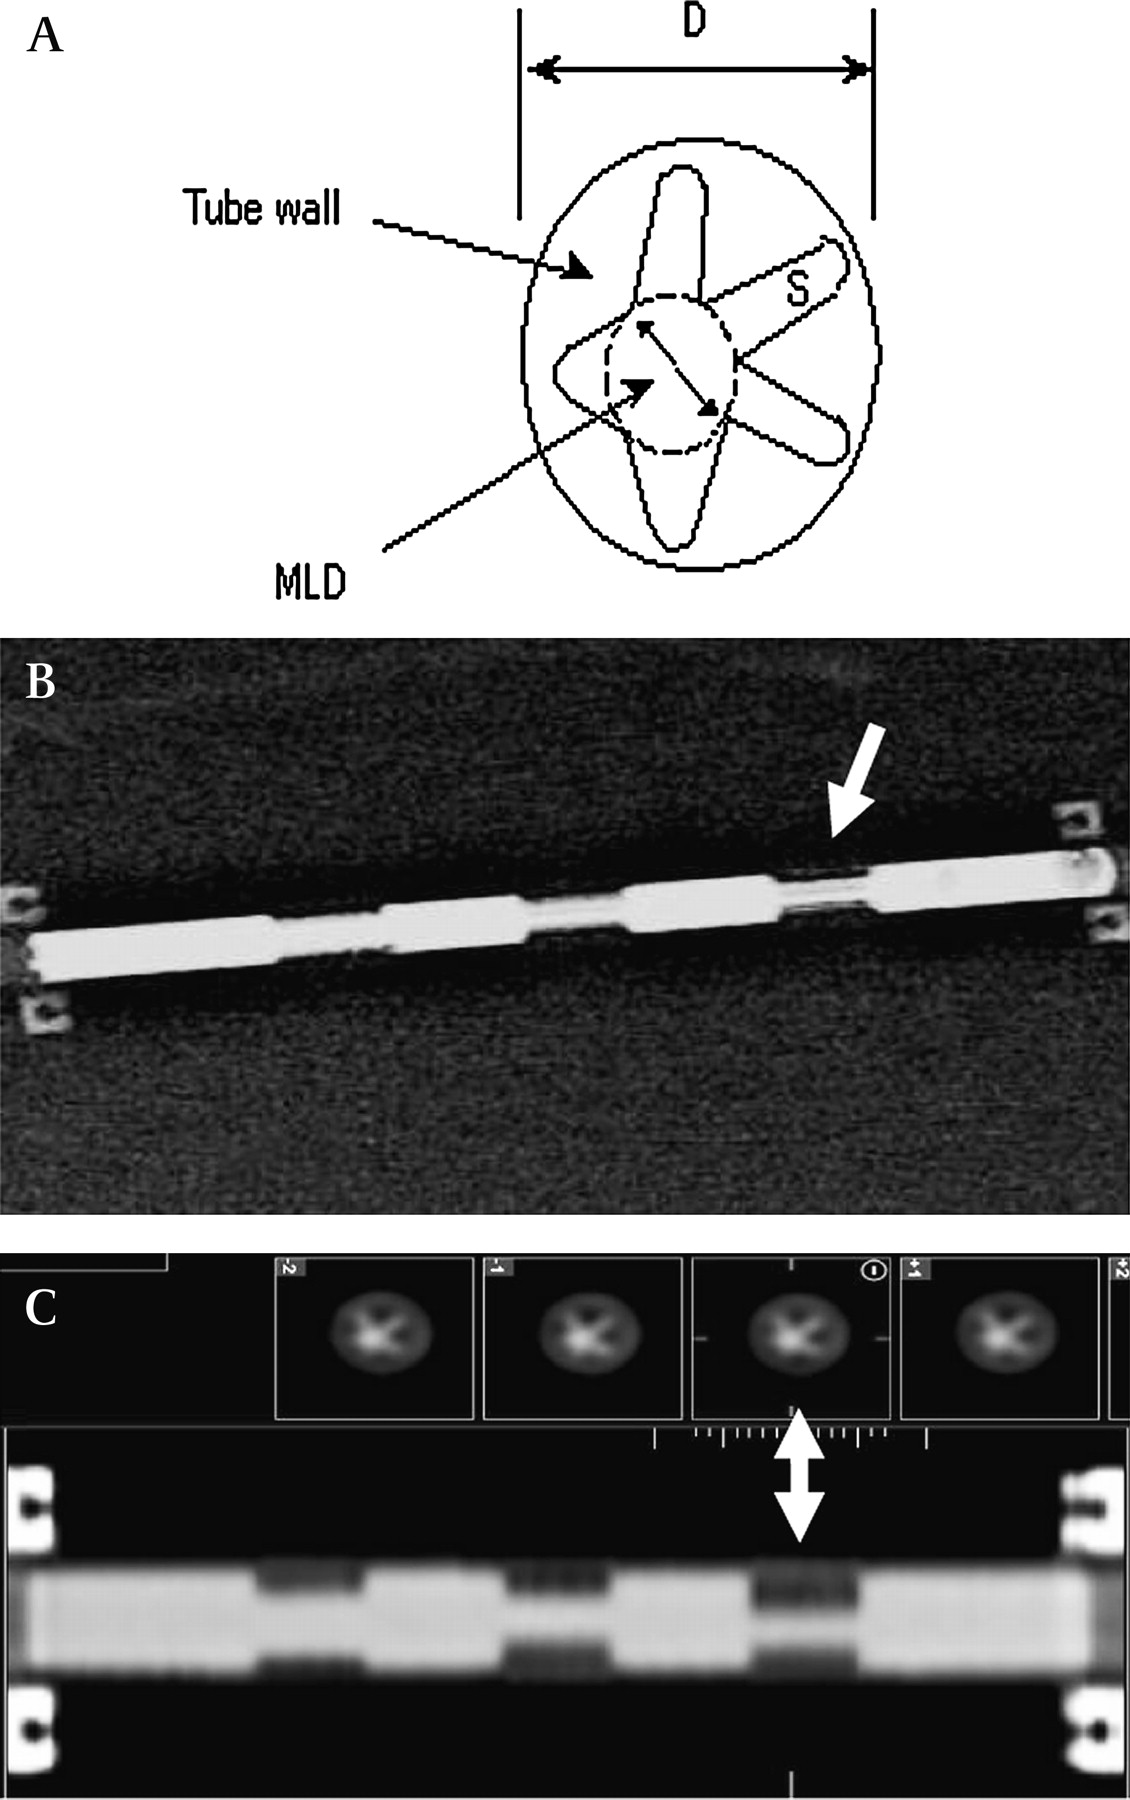
A coronary artery phantom capable of simulating cardiac motion was built according to our specifications by Fuyo® Corporation, Tokyo, Japan. The phantom consists of a motor which rotated two rings in an acrylic housing; a larger, proximal ring representing the cardiac base and a smaller, distal ring representing the cardiac apex (figure 1A). A total of 19 vessel phantoms of 80 mm length each were constructed, and three or four were mounted at a time between the rings for imaging. The vessel phantoms were made of acrylic and had luminal reference diameters between 1.5 and 4.0 mm corresponding to common luminal dimensions of coronary arteries (figure 1B). Outer dimensions (corresponding to vessel size) were between 3 and 6 mm in diameter. The phantoms were filled with iodine contrast material either undiluted (conventional angiography) or diluted, optimised for CT imaging. Each of the vessel phantoms had three luminal diameter stenoses of mild (approximately 25%, range 23–40%), moderate (approximately 50%, range 49–63%) and severe (approximately 75%, range 67–81%) degree, each 10 mm in length. The precise dimensions and stenoses for each vessel phantom were verified by the manufacturer using precision instruments with an error of 0.01 mm or smaller for diameter measurements. The shape of the stenoses varied between four types: circular concentric, circular eccentric, non-circular semi-irregular and non-circular irregular. Schematic drawings of the four different phantom lumen shapes are shown in figure 1C. Non-circular stenoses had average ratios of maximum over minimum diameters of 2.14 (±0.97), range 1.2–4.1. The purpose of these variations was to mimic coronary atherosclerotic pathology and to provide complex challenges to the imaging modalities as encountered with in vivo coronary imaging.1

Phantom setup. (A) The cardiac phantom. The arrow is pointing to the vessel phantoms mounted between the larger ring, representing the cardiac base, and the smaller ring, representing the cardiac apex. (B) A MDCT image of a vessel phantom with the stenoses of mild, moderate and severe grade. The arrow is pointing to a moderate stenosis. (C) Cross sections of the four principal stenosis shapes: circular concentric, circular eccentric, non-circular semi-irregular, non-circular irregular.
The rings of the heart model rotate and converge to simulate cardiac motion observed during MRI imaging in humans: 10–15° clockwise rotation of the base, 10° counter clockwise rotation of the apex and 3–5 cm longitudinal motion of the base towards the apex.6 The frequency of this simulated heart motion could be adjusted between 1 and 150 beats per minute (bpm). For the purpose of this study, all vessel phantoms were imaged with simulated heart rate of 60 bpm (see online video). The rate of 60 bpm was chosen because it approximates the reported average in clinical studies.7
Imaging protocol
MDCT imaging
A Toshiba Aquilion® 64-slice scanner was used for all MDCT imaging. Images were acquired with 400 ms gantry rotation and 0.5 mm slice thickness and reconstructed in 0.3 mm intervals. Tube voltage was 100 kV and tube current 150 mA, which was empirically established to be optimal for the phantom imaging. The heart model with mounted vessel phantoms (five sets with up to four vessel phantoms) were imaged with synchronisation of the simulated heart motion and a heart rate simulator with 60 bpm feeding into the scanner. Retrospective ECG gating was employed for image reconstruction. Subsequently, the phantoms were imaged without motion. A 180-mm field of view was used for phantom imaging. Images were reconstructed at 80% of the cardiac cycle using a sharp reconstruction kernel to optimise fine detail delineation. All imaging was performed by CT technologists who had no knowledge of the study protocol.
Conventional angiography
A General Electric® digital flat panel catheterisation laboratory was used for the conventional angiography imaging. The vessel phantoms were imaged with simulated cardiac motion of 60 bpm. Two experienced clinical angiographers (>20 years of experience with coronary angiography) who had no knowledge of the study protocol were asked to image the vessel phantoms for stenoses quantification. Standard projections were initially chosen for imaging and then modified to display “lesions” optimally in two orthogonal planes, similar to a clinical case. The angiographers were specifically instructed to use as many images as needed to achieve best results. On average, eight to 10 views were obtained for every vessel phantom. Images were digitally stored for off-line analysis.
Image analysis
MDCT
Reconstructed images were sent to a Vitrea® workstation for analysis. Studies were presented to two readers who had no knowledge of the study protocol. They were separately asked to quantify lumen stenoses for each vessel phantom. Readers used standard projections for their assessment, including axial views, multi-planar reformations and curved multi-planar reformations. Simulating clinical evaluation, the readers were permitted to use electronic callipers or other tools they routinely use for lesion assessment provided by the commercial software. Longitudinal and cross-sectional images were reviewed, and minimum lumen diameters were drawn using the calliper tool of the imaging software on projections deemed most appropriate by the blinded investigators. Minimum diameter and reference diameters were documented for all stenoses, and per cent stenoses were derived according to the formula: ((reference diameter−minimum diameter)/reference diameter)*100. The average of the two per cent stenosis values obtained by the two readers for all stenoses was used for the final MDCT data. Individual measurements were used for inter-observer variability analysis.
Conventional angiography
Cine films were analysed by investigators experienced with QCA. A commercially available contour detection algorithm (Pie-Medical®, CAASII®) was used for all analysis. Operator input was reserved to deviation from the luminal borders as assessed by visual inspection. Minimum luminal diameters and reference dimensions were obtained for all stenoses according to the same criteria used by MDCT. The actual reference diameters were provided to the QCA investigator since the phantom setup did not allow for alternative ways of QCA system calibration. As done with MDCT, final results were derived by averaging data from the two operators.
Assessment of lesion circularity in vivo
To understand how frequently coronary stenoses are of circular or non-circular geometry, we assessed 100 lesions which were imaged by MDCT for the CORE-64 multicenter study.8 The coronary lesions were randomly selected out of a subset of studies with good image quality. All lesions had at least 50% diameter stenosis by QCA. Cross-sectional lumen borders were generated by a semi-automatic contour detection algorithm (Vitrea®) and edited as needed by a blinded investigator to match visual inspection. The software provided minimum and maximum lumen dimensions based on a cross-sectional analysis for all lesions. A circularity index was derived, defined as ratio of maximum over minimum lumen diameter. Accordingly, a perfectly circular lumen yields a circularity index of 1. An index exceeding a value of 1 indicates non-circularity. An index of 1.5 or greater was defined as moderate non-circularity, and an index of 2 or greater was defined as severe non-circularity.
Statistical analysis
Lumen diameter measurements and derived per cent diameter stenosis estimates were compared to actual dimensions and per cent diameter stenoses for each lumen narrowing for MDCT and QCA, respectively. Since there were 19 vessel phantoms with three stenoses each, we analysed 57 stenoses by MDCT and QCA. The sample size of n=60 lesions was calculated to detect a 2% absolute difference of measurement error by MDCT and QCA with 95% confidence level assuming a standard deviation of 2.5% and a 10% dropout (technical failure) rate in circular versus non-circular stenoses (n=30 in each). One vessel phantom was non-functional, resulting in 57 stenoses analysed. Absolute differences between actual and MDCT and QCA determined dimensions and per cent diameter stenoses for all 57 stenoses were compared using Student t tests. Statistically significant differences were assumed for p values <0.05. Results were grouped by vessel phantom design, absolute lumen diameter and by motion versus still images for MDCT. Paired t tests or two-sample tests were used where appropriate. MDCT reader variability was presented for all lesion assessments. Results are provided as mean ± standard deviation (SD).
Results
Imaging and analysis was completed successfully for all vessel phantoms using MDCT. QCA could not be performed in one of the 57 stenoses because of insufficient image quality, such that the final comparison between MDCT and QCA consisted of 56 stenoses. Unless specifically stated otherwise, reported results were obtained using simulated cardiac motion.
QCA versus MDCT—per cent stenosis assessment
For all data combined, the average difference between the true per cent diameter stenosis and the measured per cent diameter stenosis for QCA was similar compared to MDCT imaging: 7 (6)% vs 7 (5)% (p=0.8). Figure 2 shows all data points for QCA and MDCT.

QCA versus MDCT: All results. Plotted is the measured per cent stenosis versus the actual per cent stenosis for QCA (open circles) and MDCT (closed triangles) in 56 lumen assessments, respectively.
When evaluating only stenoses with circular lumen geometry (n=29), QCA yielded a smaller difference between actual and measured per cent stenosis compared to MDCT. The average difference between the true per cent diameter stenosis and the measured per cent diameter stenosis for QCA was 4 (±3)% (range 0–12%) vs 7 (±6)% (range 0–22%) for MDCT (p<0.01). QCA underestimated the true diameter stenosis by 20% or more in 1/29 cases compared to 2/29 by CT. On the other hand, QCA overestimated the true diameter stenosis in 1 of 29 cases as opposed to 5 of 29 by CT. Figure 3A shows the distribution of individual data points for 29 stenoses with circular lumen geometry.

QCA versus MDCT: Circular and non-circular stenoses. (A) The results of measured per cent stenosis versus the actual per cent stenosis for QCA (open circles) and MDCT (closed triangles) for 29 circular stenoses. (B) The results of measured per cent stenosis versus the actual per cent stenosis for QCA (open circles) and MDCT (closed triangles) for 27 non-circular stenoses.
When evaluating only stenoses with non-circular geometry, the average difference between actual and measured per cent diameter stenosis was greater for QCA compared to MDCT imaging (10 (±7)% (range 1–44%) vs 7 (±5)% (range 1–25%), p<0.05). QCA underestimated the true diameter stenosis by 20% or more in 9 of 27 cases compared to 4 of 27 by CT. On the other hand, QCA overestimated the true diameter stenosis in 2 of 27 cases as opposed to 1 of 27 by CT. Figure 3B illustrates frequent underestimation of per cent diameter stenosis with QCA. With QCA, there was a significant difference between the error obtained in circular versus non-circular stenoses (p<0.001), whereas there was no difference in error for MDCT between these two types of lesion (p=0.27). Figure 4 illustrates an example of cross-sectional image analysis by MDCT versus longitudinal image display by conventional angiography in stenoses with non-circular geometry.
Images of stenoses with non-circular geometry. (A) A drawing of the lumen geometry of one of the vessel phantoms with non-circular lumen geometry. Using the minimum lumen diameter (MLD), the stenosis is 77%. (B) An image obtained by conventional angiography of the vessel phantom with three stenoses of the same lumen geometry shown in A. The arrow points to the 77% stenosis, which is assessed as only 57% by QCA. Note the fuzziness of the lumen borders at lesion site compared to the reference sites because of the irregular lumen borders in the stenosed sections. (C) The corresponding MDCT image. Note that the longitudinal view, similar to B, does not reveal the extent of lumen narrowing, but the adjacent cross-sectional image displays the lumen geometry accurately (76% diameter stenosis).
When comparing the average difference between the true per cent diameter stenosis and the measured per cent diameter stenosis in vessel phantoms with large lumen reference diameters (3.0 and 4.0 mm) versus small lumen reference diameters (1.5, 2.0 and 2.5 mm), there was no difference between the groups for QCA (7 (±6)% vs 7 (±6)%, p=0.9) but a trend towards better performance for MDCT in lumens with larger dimensions (6 (±4)% vs 8 (±7)% for MDCT (p=0.09).
Effect of vessel motion and reader variability for MDCT
The average difference between the true per cent diameter stenosis and the measured per cent diameter stenosis for MDCT imaging obtained without motion was 9 (±7)% vs 7 (±5)% with simulated cardiac motion (p=0.12). Figure 5 shows the distribution of individual data points for 57 stenoses. The average difference between the true per cent diameter stenosis and the measured per cent diameter stenosis for MDCT (obtained with simulated motion) was similar among the two readers: 7 (6)% vs 9 (±8)% (p=0.2).

MDCT results: still versus motion. Plotted is the measured per cent stenosis versus the actual per cent stenosis for 57 lumen narrowings in 19 vessel phantoms obtained with (closed diamonds) and without (open squares) simulated cardiac motion.
QCA vs MDCT—lumen assessment
There was a significant difference between the minimum lumen diameter (MLD) measurements by QCA (mean MLD 1.44 (±0.68) mm) compared to the true dimensions (1.34 (±0.69) mm, p<0.05), whereas there was no significant difference for MDCT (1.30 (±0.57), p=0.18) (figure 6A). However, there was no significant difference between the average difference between the true MLD and the measured MLD for QCA compared to MDCT: 0.24 (±0.22) vs 0.20 (±0.14) mm (p=0.3). When comparing stenoses with circular geometry, QCA yielded smaller deviations from the true MLD compared to MDCT, (0.1 (±0.1) vs 0.2 (±0.2) mm; p<0.05). Conversely, MDCT performed better than QCA in stenoses with non-circular shape. Mean deviation from true diameter in non-circular stenoses was 0.35 (±0.25) mm for QCA versus 0.17 (±0.13) mm for MDCT (p<0.005). The average difference between the true reference diameter and the measured reference diameter by MDCT was 0.18 (±0.10) mm (p<0.001). Figure 6B shows the data distribution for the reference diameters. No data for reference diameter measurements are available for QCA since the true reference diameters were provided for calibration.

Diameter measurements. (A) The results of measured minimum lumen diameter versus the actual minimum lumen diameter for QCA (open circles) and MDCT (closed triangles) in 56 stenoses, and the line of identity. (B) The results of measured reference diameter versus the actual reference diameter for 19 vessel phantoms assessed by MDCT.
In vivo circularity index
The average circularity index for the 100 in vivo lesions assessed was 1.67 (±0.60) (range 1.1–5.0). Forty-nine stenoses had an index of 1.5 or greater, and 18 had an index of 2.0 or greater.
Discussion
Our study demonstrated that conventional QCA has limitations in quantifying lumen stenoses with non-circular geometry. While QCA analysis yielded small errors of lumen stenosis assessment in vessel phantoms with circular geometry, it severely underestimated the true lumen stenosis in 33% of cases with non-circular geometry. Conversely, despite its inferior spatial and temporal resolution, computed tomography demonstrated surprisingly accurate lumen stenosis quantification in all types of stenoses, in small and in larger vessel phantoms and with and without simulated cardiac motion. Thus, this investigation suggests that, at least under ideal conditions, MDCT is quite capable of accurate lumen stenosis assessment and may even have advantages over QCA in lesions with non-circular geometry.
The reasons for the somewhat larger error margins by MDCT compared to QCA are likely twofold; the MDCT lumen measurements were performed manually, which are more prone to error compared to the computer-assisted contour detection algorithm used by QCA,9 and MDCT has poorer spatial resolution than QCA, increasing the chance of error when assessing small structures. In support of the latter notion, we found a trend of better performance by MDCT in vessel phantoms with larger diameters compared to those with small dimensions. Furthermore, reference diameters were provided for QCA analysis, eliminating a potential error source and thus providing an advantage to QCA analysis. When MLD was considered, MDCT trended to perform better than QCA (figure 6A).
Intravascular ultrasound reveals the complexity of coronary lumen geometry in the presence of atherosclerotic plaque.10 A unique feature of our investigation is the use of vessel phantoms with complex lumen geometry. Previous phantom validation studies for angiography used simple vessel models that allowed easy display of the circular lumen geometry.11 Our results show an increase in erroneous lumen quantification for conventional angiography when the stenosis geometry is non-circular. Importantly, the degree of non-circularity tested with our phantoms (range of circularity index 1.2–4.1) matched that observed in 100 in vivo coronary lesions (range of circularity index 1.1–5.0). In this analysis, almost 50% of lesions had a circularity index of 1.5 or greater, and 18% had a circularity index of 2.0 or greater, suggesting that asymmetric lumen geometry is frequently encountered when assessing significant coronary stenoses. Our data are in agreement with a report of morphologic assessment of coronary stenoses using epicardial ultrasonography which found non-circular lumen geometry in 16 of 31 lesions.12 In pathology series, 29% of coronary lesions were classified as “eccentric slit like”, deemed to create a challenge to two-dimensional imaging.13
Conventional coronary angiography has been the gold standard for coronary artery lumen assessment for more than 50 years despite numerous studies demonstrating its limitations. When compared to histology, angiography frequently underestimates the true extent of lumen narrowing.14 Since the advent of intravascular ultrasound in the 1990s,15 16 many studies have demonstrated a modest correlation between angiography and intravascular ultrasound.17 18 Unlike intravascular ultrasound, which provides cross-sectional coronary images, catheter-based angiography is limited by being a two-dimensional projection-based imaging method. Nevertheless, because of the cost and invasive nature of intravascular ultrasound, angiography remains the gold standard for coronary imaging. While accurate stenosis quantification may not be a necessary feature for clinical decision making, its significance lies in serving as reference for rendering a novel imaging technique, such as MDCT or MRI, as accurate or not. In that, any inadequacy of the gold standard may lead to misrepresentation of a new standard/reference.19
MDCT is a true three-dimensional imaging technique and, similar to intravascular ultrasound, allows the viewing of cross-sectional coronary images. MDCT, therefore, should be better suited to evaluate non-circular lumen stenoses. Furthermore, unlike QCA, MDCT is not limited by projection-related limitations, such as vessel overlap and foreshortening. However, almost all validation studies of MDCT have compared it to conventional angiography (QCA).20 21 In these studies, a distinct cutoff was used (typically 50% stenosis by QCA) to determine an accurate result for the MDCT lumen assessment. Considering the larger error margins for the gold standard QCA when assessing lumen with non-circular geometry as demonstrated in this study, MDCT may have been rendered falsely inaccurate in a potentially significant number of cases within these clinical studies. Unfortunately, considerable weight is given to such studies for determining the clinical usefulness of a new technology like MDCT,22 while their results may not be reflecting its actual accuracy. In view of the uncertainty with coronary arterial lumen measurements, a more appropriate assessment of a new imaging modality should include its impact on clinical outcome.
Limitations
Despite our meticulous attempt to mimic cardiac motion including heart rate and complex rotation pattern, our model does not account for the full complexity of coronary motion during the cardiac cycle, which may contribute to more motion-related artefacts in vivo.
Conditions in vivo obviously vary substantially compared to our phantom studies, and we cannot assume that our results would have been similar in humans. While our results are likely applicable to coronary arterial stenoses with non-calcified plaque, it is unclear how the presence of coronary arterial calcification will affect MDCT measurements. However, studies using intravascular ultrasound report that extensive lesion calcification is found in less than 10% of patients with stable symptoms and very rarely, ie, less than 5%, in patients with acute coronary syndromes.23 Thus, the fundamental differences between these imaging modalities, which we established in this study, principally apply to the vast majority of in vivo lesions, creating uncertainty for the reliability of QCA as gold standard for comparison. In support of our findings, a clinical study comparing MDCT and QCA to intravascular ultrasound as gold standard for lumen stenosis assessment reported better accuracy for MDCT than QCA.3
Conclusions
Using ideal conditions, multi-detector computed tomography provides a more accurate assessment of stenoses with non-circular geometry compared with conventional quantitative coronary angiography. These results have implications for the use of quantitative coronary angiography as gold standard for evaluating stenosis quantification by MDCT in clinical studies.
References
Supplementary materials
Web Only Data Hrt.2010.186783
Files in this Data Supplement:
Footnotes
Competing interests Declared. Drs. George, Lima, and Lardo disclose to receive honoraria and research support from Toshiba Medical Systems.
Provenance and peer review Not commissioned; externally peer reviewed.