Article Text

Abstract
Introduction The benefits of primary PCI diminish if there are delays to revascularisation. This delay is dependent upon many factors, including the availability of a skilled catheterisation laboratory team (specialist-centre effect); the number of patients treated (hospital-volume effect) and the proximity of the patient to a primary PCI-capable centre (transit-time effect). This paper reports the improved performance with respect to door-to-balloon (DTB) times over the period 2004–2007 throughout England and Wales.
Methods The Myocardial Ischaemia National Audit Project has been examined to compare timings in different years and regression analysis employed to identify reasons for variations with a multilevel component to express hospital variation. Results: The proportion of patients receiving primary PCI has increased from 5% in 2004 to 20% in 2007 and there has been a steady decrease in median DTB times from 84 min in 2004 to 61 min in 2007. Hospital variation was observed and quantified by a hospital-level SD of 12 min.
Limitations This observational study focuses on a well-recorded process measure rather than mortality.
Conclusions The number of patients receiving primary PCI has risen considerably over the period and DTB times have reduced substantially. Variation in DTB times was evident by time of presentation and by hospital proportion of primary PCI cases. There was large variation in DTB times between the best and worst performing hospitals.

30-day mortality rate by proportion of STEMI cases treated by primary PCI.
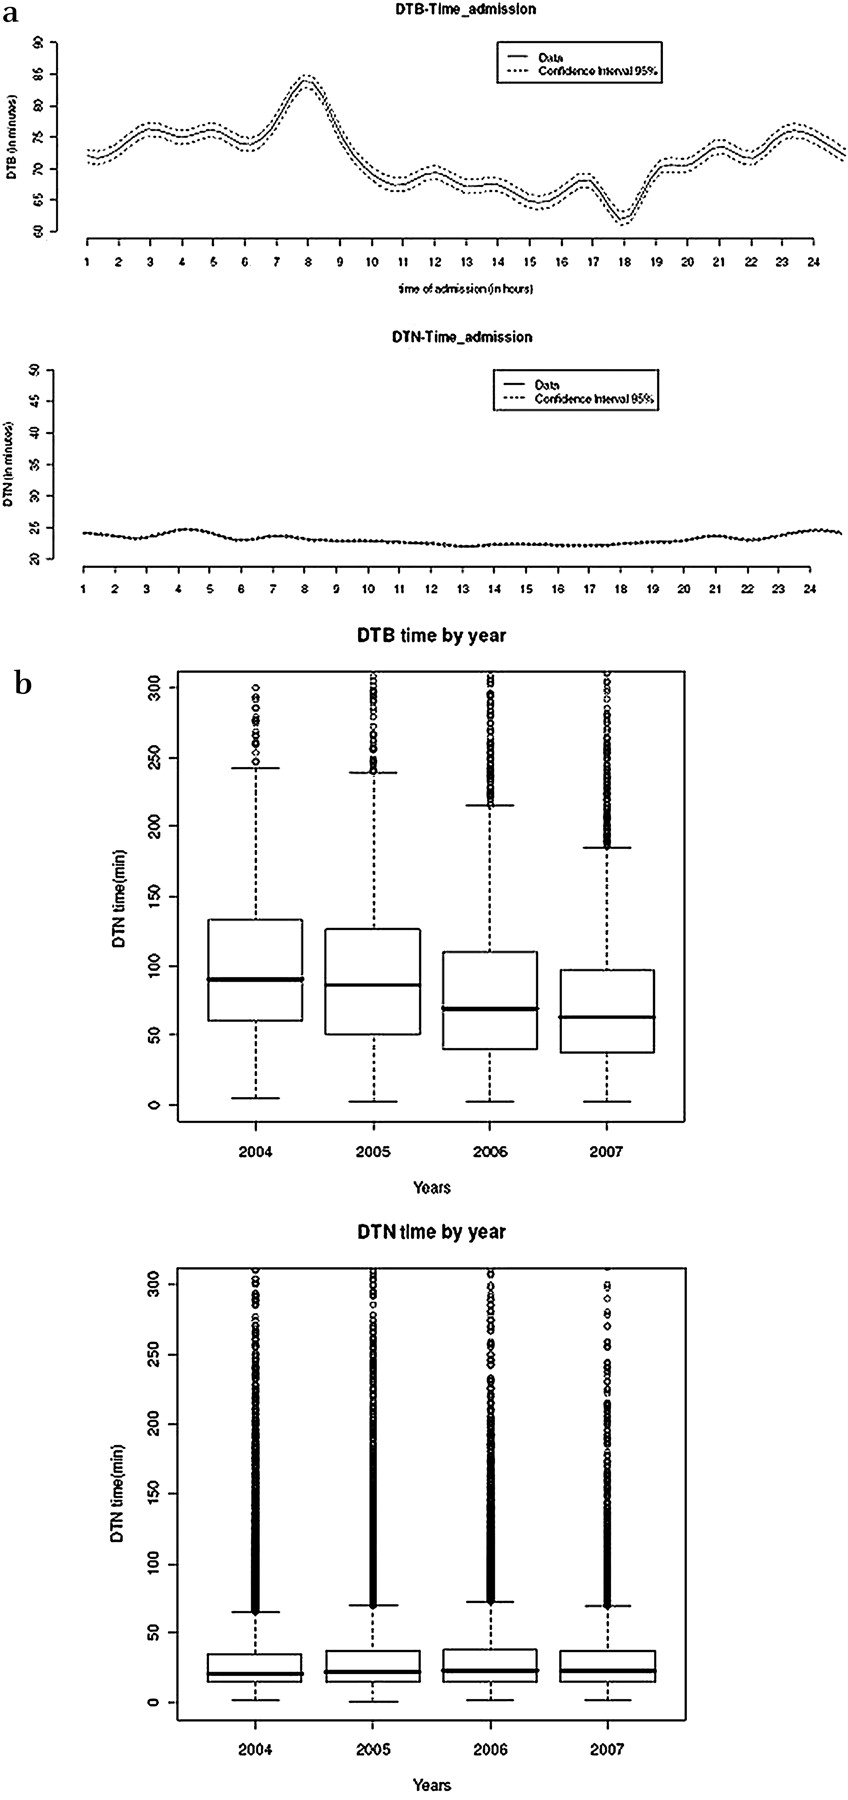
a. Diurnal variation in DTB and DTN times. b. Box plot of DTB times (left) and DTN times (right) by year.
- primary PCI
- performance
- MINAP