Article Text

Abstract
Background Interstitial haemorrhage due to reperfusion of severely ischaemic myocardium can be detected in vivo by T2-weighted (T2W) and T2* cardiovascular magnetic resonance (CMR). The clinical implications of myocardial haemorrhage following primary percutaneous coronary intervention (PPCI) remain undetermined.
Objectives To assess whether the presence of myocardial haemorrhage influences ventricular remodelling and risk of late ventricular arrhythmia following PPCI for acute myocardial infarction (AMI).
Methods Forty-eight patients with first ST-elevation AMI, treated successfully with PPCI, underwent CMR at day 2 and 3 months. Left ventricular end-diastolic volume (LVEDV), left ventricular end-systolic volume (LVESV) and left ventricular ejection fraction (LVEF) were determined from cine-CMR, infarct size and microvascular obstruction (MVO) from gadolinium-enhanced images and area at risk (AAR) from T2W CMR. Myocardial haemorrhage was defined as hypointense signal within the AAR on both T2W and T2* images. All patients had a signal-averaged electrocardiogram at 3 months.
Results 30/48 (63%) patients had MVO and 12 of these showed myocardial haemorrhage. Patients with haemorrhagic myocardial infarction (MI) had significantly larger LVEDV and LVESV, lower LVEF and larger infarcts than those with non-haemorrhagic MI at baseline and at 3 months. The presence of haemorrhage was an independent predictor of adverse remodelling defined as increased LVESV on follow-up (p=0.001, OR 1.6) and prolonged filtered QRS (fQRS) on signal-averaged ECG at 3 months (p=0.020, OR 1.176).
Conclusions Reperfusion haemorrhage following AMI is associated with larger infarct size, diminished myocardial salvage and lower LVEF. The presence of haemorrhage is the strongest independent predictor of adverse ventricular remodelling and is also associated with prolonged fQRS duration, which is a marker of arrhythmic risk.
- Cardiac magnetic resonance
- cardiac remodelling
- MRI
- myocardial haemorrhage
- myocardial infarction
- reperfusion
- STEMI
Statistics from Altmetric.com
- Cardiac magnetic resonance
- cardiac remodelling
- MRI
- myocardial haemorrhage
- myocardial infarction
- reperfusion
- STEMI
The aim of reperfusion therapy in acute myocardial infarction (AMI) is to restore normal blood flow to the ischaemic myocardium as quickly as possible. Recanalisation of the infarct-related artery by primary percutaneous coronary intervention (PPCI), in particular, has led to significant reductions in mortality after AMI by limiting the amount of myocardial necrosis.1 2 However, restoration of patency in the epicardial coronary artery sometimes fails to translate into recovery of myocardial function and reperfusion of the ischaemic territory can be incomplete due to myocardial microvascular obstruction (MVO), which is seen angiographically as ‘no-reflow’.3 MVO affects prognosis following AMI through an association with complications and poor recovery of left ventricular function.4 5 Reperfusion of severely ischaemic myocardium may also lead to intramyocardial haemorrhage in the infarct core by extravasation of red blood cells through damaged endothelial walls.6 7 The presence of myocardial haemorrhage may reduce the chances of functional recovery following AMI,8 although studies regarding the clinical implications of reperfusion haemorrhage are sparse.
Cardiac magnetic resonance (CMR) has the unique ability to characterise a range of pathophysiological effects of AMI. Multiparametric CMR assessment with cine imaging, T2-weighted (T2W) imaging and early gadolinium enhancement (EGE) or late gadolinium enhancement (LGE) acquisition delineates contractile function, myocardial oedema, MVO, intracardiac thrombus and myocardial scar. Many of these parameters have prognostic significance, for example, the extent of scar9 and presence of MVO.4 Recent studies have also demonstrated the potential of T2W imaging to define myocardial haemorrhage.10 11 Deoxyhaemoglobin is oxidised to methaemoglobin, which causes shortening of the T2 relaxation time due to its paramagnetic properties and magnetic susceptibility effect.12 Therefore, haemorrhage is considered as the dark region surrounded by oedema (bright signal) on T2W imaging. These regions of hypointense signal have been demonstrated to correspond to histological evidence of myocardial haemorrhage.13 14 Cardiac T2* magnetic resonance is used clinically to identify myocardial iron deposition secondary to iron overload states such as haemochromatosis or transfusional siderosis, as seen in thalassaemia major.15 Some studies have also proposed the use of this method to detect myocardial reperfusion haemorrhage,16 17 but have not reported clinical correlates.
Therefore, we sought to combine the information from T2W and T2* CMR to identify patients with reperfusion haemorrhage following AMI. We then aimed to demonstrate whether the presence of myocardial haemorrhage is associated with adverse ventricular remodelling as determined by CMR and markers of increased risk of ventricular arrhythmia as determined by 24-h Holter monitoring and signal-averaged electrocardiography.
Methods
Study population
We prospectively enrolled 53 patients hospitalised in our institution between August 2008 and October 2009 with first presentation acute ST-elevation myocardial infarction (MI) and treated successfully with PPCI within 12 h of symptom onset. The study was approved by the institutional research ethics committee and complied with the Declaration of Helsinki; written informed consent was obtained from all patients. Patients with a history of previous coronary revascularisation (ie, percutaneous coronary intervention or coronary artery bypass surgery), previous MI, renal failure (defined as estimated glomerular filtration rate <30 ml/min per 1.73 m2) or contraindication to CMR examination, were excluded. Clinical data regarding patient characteristics and procedural details were gathered from the medical notes. The choice of adjunctive pharmacotherapy was recorded.
CMR protocol
All patients underwent CMR imaging during their index admission. A follow-up CMR study, using the identical imaging protocol, was performed after a median of 3 months to assess left ventricular remodelling. Patients were studied supine in a 1.5 Tesla scanner (Philips Medical Systems, Best, The Netherlands) equipped with ‘Master’ gradients (30 mT/m peak gradients; 150 mT/m/ms slew rate) and a five-element cardiac phased array receiver coil. Images were acquired using expiratory breath holds. All data were acquired in the true left ventricular short axis with 10–12 contiguous sections as required to cover the entire left ventricle.
Cine imaging covering the whole heart in parallel short axis slices was performed using a steady state free precession (SSFP) pulse sequence (echo time (TE) 1.4 ms; repetition time (TR) 2.8 ms; flip angle 55°, spatial resolution 2×2×10 mm, 18 phases per cardiac cycle).
T2W CMR was performed next in the short axis orientation using a dark-blood T2W short τ inversion-recovery fast spin echo sequence (TE 100 ms, TR two heart beats, flip angle 90°,spatial resolution 1.4×1.4×10 mm). A stack of T2* images was then obtained in the identical location using a dual echo T2* gradient echo sequence (TE 4.6 ms and 9.2 ms, TR 12.3 ms, flip angle 30°, spatial resolution 1.4×1.4×10 mm).
A cumulative dose of 0.2 mmol/kg of gadolinium-DTPA (dimeglumine gadopentetate; Magnevist, Schering AG, Germany) was then administered using a power injector. EGE images were acquired 1–4 min after contrast injection with a fixed inversion time (TI) of 440 ms (inversion recovery-prepared T1-weighted gradient echo, TR 4.9 ms, TE 1.9 ms, flip angle 15°, spatial resolution 1.35×1.35×10 mm). We routinely use a fixed TI of 440 ms as it provides excellent contrast between MVO and normal myocardium. Ten minutes after contrast injection, a ‘look locker’ sequence was performed to obtain the most appropriate TI to null the signal intensity of normal myocardium. This was immediately followed by the acquisition of LGE images with identical pulse sequence parameters as for EGE apart from the specifically determined TI.
CMR analysis
The CMR images were analysed off-line using commercial software (MASS 6.0; Medis, Leiden, The Netherlands) by two experienced observers blinded to all clinical details. For assessment of left ventricular volumes and mass, the end-diastolic and end-systolic cine frames were identified for each slice and the endocardial and epicardial borders were manually traced. The end-diastolic and end-systolic volumes were then calculated using modified Simpson's rule (ie, sum of cavity sizes across all continuous slices). Left ventricular mass (g) was calculated from the total volume of myocardium at end-diastole multiplied by the myocardial density 1.05 g/ml. Left ventricular volumes and mass were indexed to body surface area (BSA) as calculated by the Mosteller method:18 BSA(m2)=√[(height(cm)*weight(kg)]/3600.
MVO was measured using EGE images. For each slice, the region of hypoenhancement, compared with normal myocardium, was defined visually and then planimetered manually. The volume of MVO was calculated by the modified Simpson's method and converted to a mass by multiplying by the myocardial density (1.05 g/ml). The mass was then divided by the left ventricular mass and multiplied by 100 to obtain a percentage of left ventricular mass that has MVO (%LV–MVO).
Infarcted tissue was identified using LGE images. The left ventricular endocardial and epicardial borders on each slice were traced manually. Infarcted tissue was defined as an area of gadolinium hyperenhancement in a subendocardial or transmural pattern and in the territory of a coronary artery. These regions were identified and then quantified using a semi-automated algorithm. Areas of hyperenhancement were defined as myocardium with a signal intensity greater than 2 SD above the mean signal intensity of the remote normal myocardium.19 The mass of infarcted myocardium was then automatically calculated (scar) and divided by the left ventricular mass and multiplied by 100 to give a percentage of left ventricular mass that is infarcted (%LV–scar).
The area at risk (AAR) was quantified on T2W images by using a similar semi-automated algorithm as above. Myocardium with a signal intensity greater than 2 SD above the mean signal intensity of remote normal myocardium was considered to be oedematous. Increased signal intensity due to slow flow from the blood pool adjacent to the endocardium was excluded. The mass of oedematous myocardium was then automatically calculated (AAR) and divided by the left ventricular mass and multiplied by 100 to give a percentage of left ventricular mass at risk (%LV–AAR). The mass of salvaged myocardium was derived by subtracting the mass of infarcted tissue from the mass of AAR. This was then represented as a percentage of AAR by dividing by the mass of AAR and multiplying by 100 to give %AAR–salvaged.
The presence and extent of myocardial haemorrhage was assessed by combined analysis of T2W and T2* sequences. On T2W images, areas of hypointense signal within the AAR, ie, myocardium with a mean signal intensity more than 2 SD below that of the periphery of the AAR, were considered to be haemorrhage.10 These areas were planimetered manually on each slice. The volume of haemorrhagic myocardium was calculated by the modified Simpson's method and converted to a mass by multiplying by the myocardial density (1.05 g/ml). On the T2* images the presence of a dark core within the infarcted area was considered to confirm the presence of myocardial haemorrhage. Only when T2W and T2* images showed concordant findings was an area considered to represent haemorrhage for the purposes of statistical analysis.
Electrocardiography testing
All patients who attended follow-up CMR assessment also completed 24-h ECG monitoring and signal-averaged electrocardiography (SA–ECG) testing at a median of 3 months following their index presentation. Signal averaging of more than 300 beats was performed to achieve a diagnostic noise level less than 1 μV. Three conventional SA–ECG time domain indices were recorded at a 40 Hz bandpass filter setting: the duration of the total filtered QRS (fQRS) complex, the duration of the low-amplitude signal (LAS) after the voltage decreased to less than 40 μV, and the root mean square (RMS) of the amplitude of signals in the last 40 ms of the fQRS complex. The SA–ECG was considered predictive of ventricular arrhythmia if the fQRS duration was 120 ms or greater20 or if any two of the following three criteria were met: fQRS duration greater than 114 ms, LAS greater than 38 ms, or RMS less than 20 μV at a 40 Hz filter setting.21 A 24-h Holter recording was obtained within 48 h of the SA–ECG.
Statistical analysis
Statistical analysis was performed using SPSS, version 15.0. Two-sided p values of 0.05 or less were considered to be statistically significant. Continuous CMR data are summarised as mean (SD) and categorical data as numbers (percentages). Continuous data between groups were compared using two sample t tests or one-way analysis of variance tests with Bonferroni correction. Categorical data were analysed using χ2 tests. Pearson's correlation coefficient was used to assess associations between variables. Multiple logistic regression analysis was used to predict binary endpoints such as an increase in left ventricular end-systolic volume (LVESV) at 3 months. Receiver operator characteristic (ROC) curves were produced from the predicted probabilities derived from multiple logistic regression analysis.
Results
Fifty-three patients were recruited. Two patients were unable to complete the first CMR scan due to claustrophobia. Two patients refused to attend follow-up and one patient died from an intracranial haemorrhage before follow-up. Therefore, 48 patients completed baseline and follow-up CMR scans. Baseline CMR studies were conducted at a median of 2 days (IQR 1–2.8 days) from the time of index presentation. The follow-up CMR scans occurred at a median of 92 days (IQR 90–95 days).
Patient characteristics
EGE imaging identified 30/48 (63%) patients with evidence of MVO on the baseline CMR scan. T2W imaging showed that 16/30 (53%) of these patients had evidence of hypointense signal within the AAR. Twelve of these 16 patients had evidence of myocardial haemorrhage on T2* imaging. We therefore considered these 12 patients to have haemorrhagic MI confirmed by CMR and compared them with the 18 patients with MVO only (ie, MVO but no haemorrhage) and the remaining 18 patients without MVO or haemorrhage (figure 1). The baseline characteristics for the study population are summarised in table 1. There were no significant differences in terms of age, gender or cardiovascular risk factors except diabetes mellitus, although the overall number of patients with diabetes mellitus was small (n=3). The admission blood glucose was also higher in patients with haemorrhagic infarction and MVO. Patients with myocardial haemorrhage displayed significantly greater peak levels of creatine kinase. All patients were on optimal medical therapy (defined as aspirin, clopidogrel, a beta-blocker, an ACE inhibitor and a statin) at discharge and at 3 months follow-up.

Cardiovascular magnetic resonance images demonstrating myocardial oedema, haemorrhage, microvascular obstruction (MVO) and infarction. (A) shows images from a patient with septal infarction. Myocardial haemorrhage is seen as a hypointense region in the septum on T2-weighted (T2W) and T2* imaging. Late gadolinium enhancement (LGE) confirms MVO within the infarct zone. (B) shows images from a patient with a lateral acute myocardial infarction. T2W imaging demonstrated transmural oedema but no evidence of haemorrhage. T2* confirmed no evidence of haemorrhage and there was also no MVO on LGE. (C) shows images from a patient with an occlusion of the proximal left anterior descending artery. LGE highlights MVO in the septum but there was no evidence of haemorrhage on T2W or T2* imaging. (D) shows images from a patient with an anterior AMI. There was a small area of hypointense signal within the oedematous area on T2W but no evidence of haemorrhage on T2* imaging. LGE demonstrated a small area of MVO. For the purpose of analysis, this patient was classified as having MVO but no haemorrhage.
Baseline characteristics of study population
Procedural influences
Although patients with haemorrhagic MI (n=12) endured significantly longer ‘door to balloon’ times than non-haemorrhagic MI patients (n=36) (median (IQR) 93 min (64–138) vs 65 min (46–82), respectively, p=0.029), there was no significant difference in overall ischaemia times (‘pain to balloon’) between the two groups (210 min (132–310) vs 188 min (152–252), respectively, p=0.754). The choice of intravenous antiplatelet agent (bivalirudin or abciximab) did not influence the incidence of haemorrhagic infarction (χ2, 1 df, p=0.24). Similarly, there was no difference in the incidence of haemorrhagic infarction with the use of thrombectomy devices during PPCI (χ2, 1 df, p=0.68).
CMR parameters
Patients with haemorrhagic MI had significantly larger left ventricular end-diastolic volume (LVEDV) and LVESV, and lower left ventricular ejection fraction (LVEF) than those with non-haemorrhagic MI, both at baseline and at 3 months follow-up (table 2). Haemorrhagic MI was also associated with larger AAR and infarct size but diminished salvaged myocardium. The extent of MVO was significantly greater in haemorrhagic MI. Patients with haemorrhagic MI had significantly larger LVEDV and LVESV, and lower LVEF than patients with MVO only at 3 months.
Results of CMR functional parameters and infarct characteristics from baseline and 3 months as categorised by the presence of MVO or haemorrhage
When comparing data between baseline and 3 months, LVEDV and LVESV did not improve in haemorrhagic infarctions. Both parameters decreased in the non-haemorrhagic groups, but LVEDV increased significantly in patients with haemorrhage and LVESV also increased in this group but not significantly. Left ventricular mass decreased significantly in the non-haemorrhagic groups but there was a non-significant reduction in haemorrhagic infarctions.
Predictors of adverse left ventricular remodelling
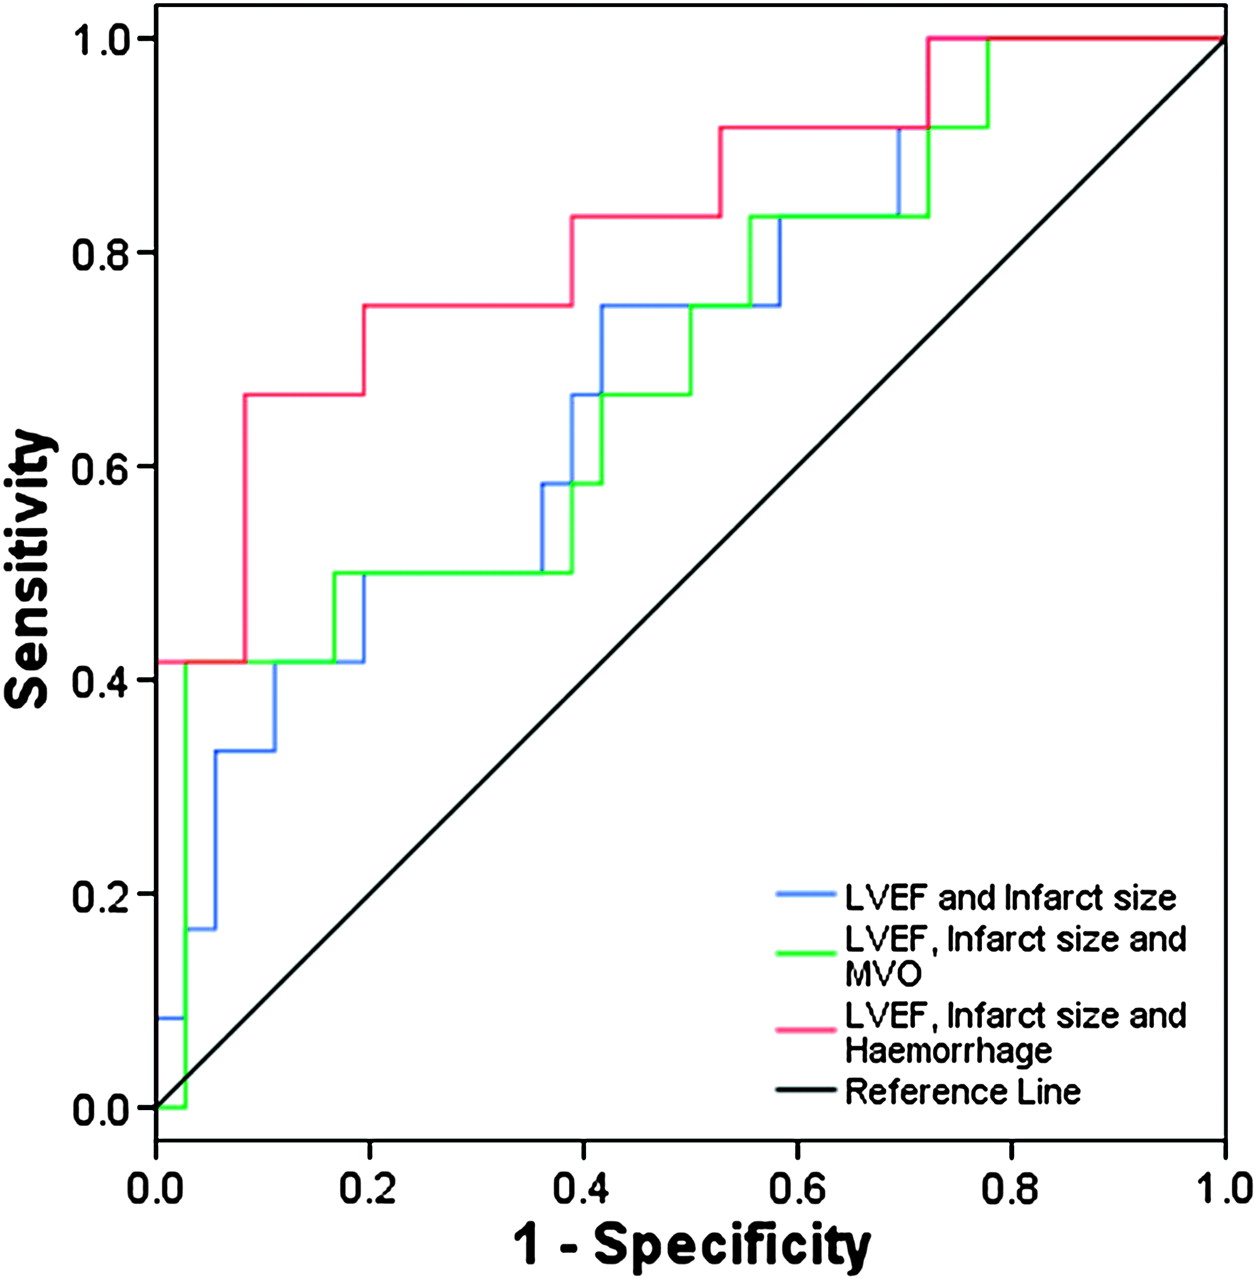
Multiple logistic regression analysis was used to identify independent predictors of adverse remodelling as defined by an increase in LVESV at 3 months from baseline (table 3). The strongest independent predictor was the presence of myocardial haemorrhage. LVEF and infarct size at baseline and the %AAR–salvaged were also independent predictors of adverse remodelling. When the presence of haemorrhage was added to LVEF and infarct size in a model for the prediction of adverse remodelling (χ2 16.19, p=0.001), the area under the ROC curves (AUC) improved from 0.699 to 0.826 (figure 2). When the size of MVO was added to baseline LVEF and infarct size, the AUC was only 0.694 and the model was not significantly predictive (χ2 5.19, p=0.158).
Results of multiple logistic regression analysis of binary endpoints of surrogate markers of adverse prognosis

Receiver operator characteristic curves demonstrating the ability of three models to predict adverse remodelling defined as an increase in left ventricular end-systolic volume at 3 months. The blue line represents baseline left ventricular ejection fraction (LVEF) and infarct size (area under the curve (AUC) 0.699). The green line represents baseline LVEF, infarct size and size of microvascular obstruction (MVO) (AUC 0.694). The red line represents baseline LVEF, infarct size and the presence of haemorrhage (AUC 0.826).
Electrocardiography
Twenty-four-hour Holter recording did not demonstrate any differences between patients with haemorrhagic and non-haemorrhagic MI. There were no cases of non-sustained or sustained ventricular tachycardia on 24-h monitoring.
There was, however, a significant difference in the fQRS duration on SA–ECG between the two groups. Patients with haemorrhagic infarction had a mean fQRS duration of 125.1 (13.9) compared with 109.3 (19.9) for non-haemorrhagic MI patients (p=0.043). Multiple logistic regression analysis using the binary endpoint of fQRS duration of 120 ms or greater, demonstrated that baseline LVEF, LVEDV, LVESV, infarct size, %AAR–salvaged and the presence of myocardial haemorrhage were all independent predictors. Interestingly, the size of MVO was not an independent predictor of prolonged fQRS (table 3).
Haemorrhage was not an independent predictor of an abnormal SA–ECG when the endpoint of any two of fQRS duration greater than 114 ms, LAS greater than 38 ms, or RMS less than 20, was used. Baseline LVEF, LVEDV, LVESV and infarct size remained independent predictors.
Discussion
Myocardial haemorrhage, defined by T2W and T2* CMR, occurred in one quarter of patients with AMI following successful reperfusion with PPCI. The presence of reperfusion haemorrhage was associated with larger infarct size, less myocardial salvage, greater MVO and lower LVEF in the acute phase, as well as adverse left ventricular remodelling at 3 months follow-up. Reperfusion haemorrhage appears to be an independent predictor of adverse remodelling and when combined with baseline LVEF and infarct size, provides a more powerful predictive model for remodelling than MVO. In addition, patients with myocardial haemorrhage have significantly prolonged fQRS durations on signal-averaged electrocardiography and this may be associated with a greater risk of serious ventricular arrhythmias in the post-infarction period.
Prolonged ischaemia triggers an inflammatory response that results in tissue oedema. Oedema is one of the features of the viable myocardium at risk.22 T2W CMR sequences are very sensitive to protons bound to free tissue water and therefore can delineate myocardial oedema even in early stages of ischaemic injury and in the absence of a large increase in gross myocardial water content. T2W CMR has thus been shown to visualise infarct-related oedema and the so-called AAR successfully.23 However, the hypointense core often seen within the hyperintense signal on T2W imaging has also been shown to correlate with histological evidence of myocardial haemorrhage both in animal and human studies.13 24 Perhaps a more specific method for identifying myocardial haemorrhage is T2* CMR, which is sensitive to the paramagnetic effects of the breakdown products of haemoglobin.15 Therefore, in this study we sought to combine these two CMR methods to detect haemorrhagic infarction and to assess its clinical implications.
We demonstrated that myocardial haemorrhage was associated with larger infarcts, both biochemically and by LGE–CMR. One might speculate, therefore, that haemorrhage is a consequence of infarct size. However, an analysis by Ganame et al10 suggested that the presence of haemorrhage was associated with adverse remodelling across all quartiles of infarct size. We also found a significant correlation between the extent of myocardial haemorrhage by T2W and the extent of MVO by EGE (r=0.825, p<0.001). This is consistent with previous studies.10 17 Myocardial haemorrhage was always associated with MVO in our study. However, there were 18/48 (38%) patients with MVO and non-haemorrhagic infarction. The current understanding of the pathophysiology relating these two phenomena is limited. It is not known whether MVO leads to endothelial damage and subsequent extravasation of erythrocytes to the interstitium. This theory would suggest that haemorrhage is a marker of greater damage, which would support the other findings from this study that the presence of haemorrhage portends a worse outcome than the presence of MVO alone. However, it has also been suggested that perhaps intramyocardial haemorrhage causes swelling of the myocardium and subsequent compression of the microvasculature, thereby actually causing or worsening MVO.25 Further studies investigating the pathophysiology are required to resolve this issue.
Studies, in animals and humans, have demonstrated myocardial haemorrhage to be related to more prolonged ischaemia times (ie, time to reperfusion).7 26 27 However, in the current patient cohort, there was no significant difference in ‘pain to balloon’ time between haemorrhagic and non-haemorrhagic infarctions.
We highlighted some important differences in infarct characteristics between patients with and without haemorrhage, which have previously been shown to portend prognostic significance. For example, patients with reperfusion haemorrhage, as determined by CMR, had larger infarct sizes, greater MVO, lower ejection fractions and adverse ventricular remodelling.4 9 LVESV, in particular, has been shown to be an important predictor of prognosis following AMI.28 In addition, we also demonstrated that haemorrhagic infarction is associated with significantly prolonged fQRS duration on SA–ECG and this feature has previously been reported to predict serious arrhythmic events in the first year after infarction.20
One previous study has reported on the association between myocardial haemorrhage by T2W CMR and left ventricular remodelling. Ganame et al10 showed in 98 patients with MI reperfused successfully with PPCI, that myocardial haemorrhage, detected by T2W CMR, is a frequent complication and an independent predictor of adverse left ventricular remodelling regardless of infarct size. Our results are largely consistent with this previous report. In both studies one quarter of patients showed evidence of intramyocardial haemorrhage. Both studies also showed that haemorrhage was associated with larger infarcts, higher LVEDV and LVESV and lower LVEF as well as adverse remodelling. However, in addition to confirming the results of Ganame et al10 in a separate population, our study adds several new observations. We defined haemorrhage by a combination of T2W and T2* sequences. This is a novel approach and may improve the specificity of CMR to detect haemorrhage, although further work is required to prove this. We differentiated our cohort of subjects into three groups: haemorrhage, MVO only (ie, no haemorrhage) and patients with neither MVO nor haemorrhage. In doing so we were able to highlight important differences between patients with MVO only and those who also had haemorrhage. These observations suggest that the presence of haemorrhage confers a different outcome than MVO alone. We also looked beyond CMR markers of remodelling and explored the risks of developing arrhythmias in this population. It is well recognised that patients recovering from MI are at high risk of sudden cardiac death and that the use of SA–ECG in the post-MI setting can help to identify those most at risk of developing sustained ventricular tachyarrhythmias. In this regard, we present the first evidence that the presence of reperfusion haemorrhage may predict an increased risk of serious arrhythmia. These initial observations warrant confirmation in larger studies that would then support the use of CMR for risk stratification in the post-MI population.
Limitations
A limitation of our study is the absence of histological confirmation of myocardial haemorrhage. The use of T2W CMR in this setting has been well documented previously; however, the combined use of T2* CMR to identify myocardial haemorrhage is novel. Moreover, the dual echo T2* sequence used in the study has not been well validated for the detection of myocardial iron deposition, and therefore the study would have benefitted from some pathological correlation.
The study sample size is relatively small and, therefore, care should be taken when extrapolating the presented results. However, the sample size is similar to other published CMR studies that have investigated MVO and myocardial haemorrhage, and therefore we feel that our data contribute important findings to the current literature on this topic.
Conclusions
The results of this study suggest that myocardial haemorrhage following acute reperfusion, as defined by T2W and T2* CMR imaging, is common. The presence of reperfusion haemorrhage is associated with surrogate markers of adverse outcome such as larger infarct size, greater MVO, lower LVEF and adverse ventricular remodelling. Haemorrhagic infarction is also associated with significant prolongation of QRS duration on signal-averaged electrocardiography, and this may predict a greater risk of ventricular arrhythmia in this group of patients. Larger studies are warranted in the future to investigate the prognostic significance of myocardial haemorrhage.
References
Footnotes
See Editorial, p 439
Linked articles 212191.
Funding This research was supported by a project grant from Heart Research UK. SP is supported by a Wellcome Trust Fellowship (WT078288).
Competing interests None.
Ethics approval This study was conducted with the approval of the Leeds West Research Ethics Committee.
Provenance and peer review Not commissioned; externally peer reviewed.