Article Text

Abstract
Objective To assess the feasibility of quantitative myocardial perfusion imaging (MPI) in acute myocardial infarction (AMI), using multi-row detector CT (MDCT) with a model-based deconvolution method.
Design, setting, patients and interventions Fifteen normal subjects with normal coronary arteries and 26 patients with AMI after reperfusion therapy underwent MPI with MDCT. Perfusion parameters: tissue blood flow (TBF), tissue blood volume (TBV) and mean transit time (MTT) were obtained and compared with clinical parameters, angiography and single-photon emission CT (SPECT) data. Furthermore, the MPI data were compared with data from myocardial magnetic resonance (MR) in 10 subjects.
Results The TBF and TBV of infarcted myocardium were significantly lower than those of non-infarcted areas (TBF, 51.96±19.42 vs 108.84±13.29 ml/100 g/min, p<0.01; TBV, 4.47±2.23 vs 9.79±2.58 ml/100 g, p<0.01). The MTT of infarcted areas did not differ from that of non-infarcted areas. The defect areas on TBV colour maps were significantly associated with peak creatine kinase level, QRS score and SPECT defect score. The ratio of TBF or TBV in the epicardial to endocardial side was significantly higher in infarct myocardium with good collateral circulation than in myocardium with poor/no collateral circulation (p<0.01 for both). The TBF measurements with CT- and MR-MPI were in good agreement by linear regression analysis (R=0.55, p<0.01).
Conclusions This study demonstrated that MDCT perfusion imaging with deconvolution analysis could quantitatively detect myocardial perfusion abnormalities in patients with AMI and may provide the basis for the non-invasive and quantitative assessment of myocardial infarction.
- Acute myocardial infarction
- myocardial perfusion imaging
- multi-row detector CT
- tissue blood flow
- MRI
- coronary artery disease
- heart failure
- imaging and diagnostics
- cardiac function
- chronic total occlusion (CTO)
Statistics from Altmetric.com
- Acute myocardial infarction
- myocardial perfusion imaging
- multi-row detector CT
- tissue blood flow
- MRI
- coronary artery disease
- heart failure
- imaging and diagnostics
- cardiac function
- chronic total occlusion (CTO)
Reperfusion therapy has significantly reduced mortality in patients with acute myocardial infarction (AMI).1 It has been shown that the extent and degree of irreversible myocardial tissue injury after AMI are strong predictors of long-term patient outcomes. Myocardial perfusion imaging (MPI) by single-photon emission CT (SPECT) and angiographic myocardial blush grade have been reported to be powerful predictors of long-term outcome after AMI.2 3 Quantitative assessment of regional myocardial blood flow (MBF) in patients with AMI might be useful in improving diagnostic and prognostic values.4 5
Imaging and analysis of MBF is clinically available by SPECT and positron emission tomography (PET). However, both modalities have limited spatial resolution. In addition, SPECT cannot quantify myocardial perfusion and PET, although it is capable of quantitative measurement of MBF and coronary flow reserve, is not widely available and still falls short of enabling quantification of the transmural extent of myocardial perfusion.6 In contrast, multi-row detector CT (MDCT) shows better temporal and spatial resolution. However, evaluation of the myocardial perfusion using MDCT is limited and not established.7 In particular, there are some difficulties in quantifying MBF by MDCT which, if resolved, would allow us to determine the effect of treatment and also to better examine the severity, rather than only the extent, of disease.8 The feasibility of dynamic MDCT imaging protocols, which can provide data that allow for the absolute quantification of MBF, has not yet been demonstrated in the clinical setting. Recently, George et al reported that dynamic MDCT MBF measurements using a model-based deconvolution method correlated well with microsphere MBF in a canine model of coronary stenosis.9
Therefore, we applied the analytical method with a deconvolution algorithm as well as the modified reconstruction method and beam-hardening correction, and assessed the myocardial perfusion by MDCT in normal subjects and patients with AMI. We calculated tissue blood flow (TBF), tissue blood volume (TBV) and mean transit time (MTT) values in the myocardium, and tested whether this method could detect myocardial perfusion abnormality, including the transmural differences.
Methods
Study protocol
Patient selection for the study included 88 consecutive patients admitted to our hospital with a diagnosis of AMI. Forty-one patients with Killip class 4, renal dysfunction (serum creatinine >1.5 mg/dl), atrial fibrillation or known allergy to iodinated contrast were excluded from this study. Twenty-one patients refused to participate and the remaining 26 patients with AMI were included in this study. Normal control subjects comprised patients who came to our hospital with a complaint of chest pain but showed no coronary stenotic lesion by CT angiography (CTA) and no perfusion abnormality by myocardial thallium-201 (201Tl) SPECT. The study was approved by an institutional review board and written informed consent was obtained from all subjects.
AMI was diagnosed when at least two of the following were present: chest pain lasting for >30 min, electrocardiographic changes with pathological Q waves and/or ST elevation or depression in at least two consecutive electrocardiogram leads, and >threefold increases of normal limits in plasma creatine kinase (CK). In all patients, cardiac catheterisation was performed by the conventional femoral approach, and reperfusion therapy (percutaneous coronary intervention in 23 cases and thrombolysis in three cases) was performed in the acute phase. In selective coronary angiography, Rentrop's collateral grade was determined and the patients were divided into two groups: good collateral group (Rentrop II/III grade, n=8) and poor collateral group (Rentrop 0/I, n=18).10 MDCT and rest SPECT were performed within 14 days from the onset.
Estimation of infarct area
Peak CK was determined on admission and every 3 h after reperfusion therapy. In two patients, peak CK was not determined because the maximum CK value was seen on admission. QRS score analysis by the method of Wagner et al was performed using ECG at the chronic phase.11
Evaluation of infarct area using SPECT
In normal control subjects, stress-rest SPECT MPI (using 201Tl chloride) was performed using a symptom-limited treadmill exercise protocol. In patients with AMI, rest SPECT MPI was performed in the chronic phase. Gated SPECT image data were reconstructed in vertical long-axis, horizontal long-axis and short-axis projections. Using a 17-segment model, two independent readers visually scored myocardial segments as previously reported12: normal, 0; equivocal, 1; moderate, 2; severe reduction and absence of detectable tracer uptake, 3. The total defect score of 17 segments and that in the segment of culprit coronary artery territory were calculated.
CT myocardial perfusion image acquisition and analysis
The CT was performed with a 64-channel MDCT scanner (LightSpeed VCT, GE Healthcare, USA) with a gantry rotation time of 500 ms. Contrast agent (Iohexol, Daiichi-Sankyo Pharmaceutical Co Ltd, Japan) was infused through the antecubital vein at a rate of 4 ml/s for a total of 40 ml. The scan was started 6 s after the initiation of the infusion and continued for 30 s. It was performed from 10 mm below the level of the left main trunk towards the apex of the left ventricle, covering 40 mm of the left ventricle, and eight slices of images were obtained with a 5 mm slice thickness. Scan conditions were as follows: 8×5 mm collimation, tube voltage 120 kV, tube current 40 or 50 mA. Values for effective radiation dose were calculated by multiplying the dose–length product with a conversion factor (k=0.014 mSv/mGy×cm), and the average effective dose was 5.7 mSV.
Images were transferred to an image processing workstation with deconvolution-based software (Advantage Workstation 4.3, 4.4 and CT Perfusion four research version, GE Healthcare, USA).13–16 One axial slice that showed the maximum size of the left ventricle was selected among the eight slices. The axial images obtained by cine scan were reconstructed every 0.1 s (300 images) and a beam-hardening correction was applied to avoid beam-hardening artefacts that can mimic the appearance of myocardial perfusion defects and thus confound flow assessment, as previously described in detail.16 The images were further sorted by retrospective gating (based on the movement of the boundary between lung and left ventricle) to avoid heart motion artefacts at every 10% RR interval. Among them, those at the end-diastolic phase were selected. As a result, approximately 30 serial images were used for the analysis of dynamic MPI.
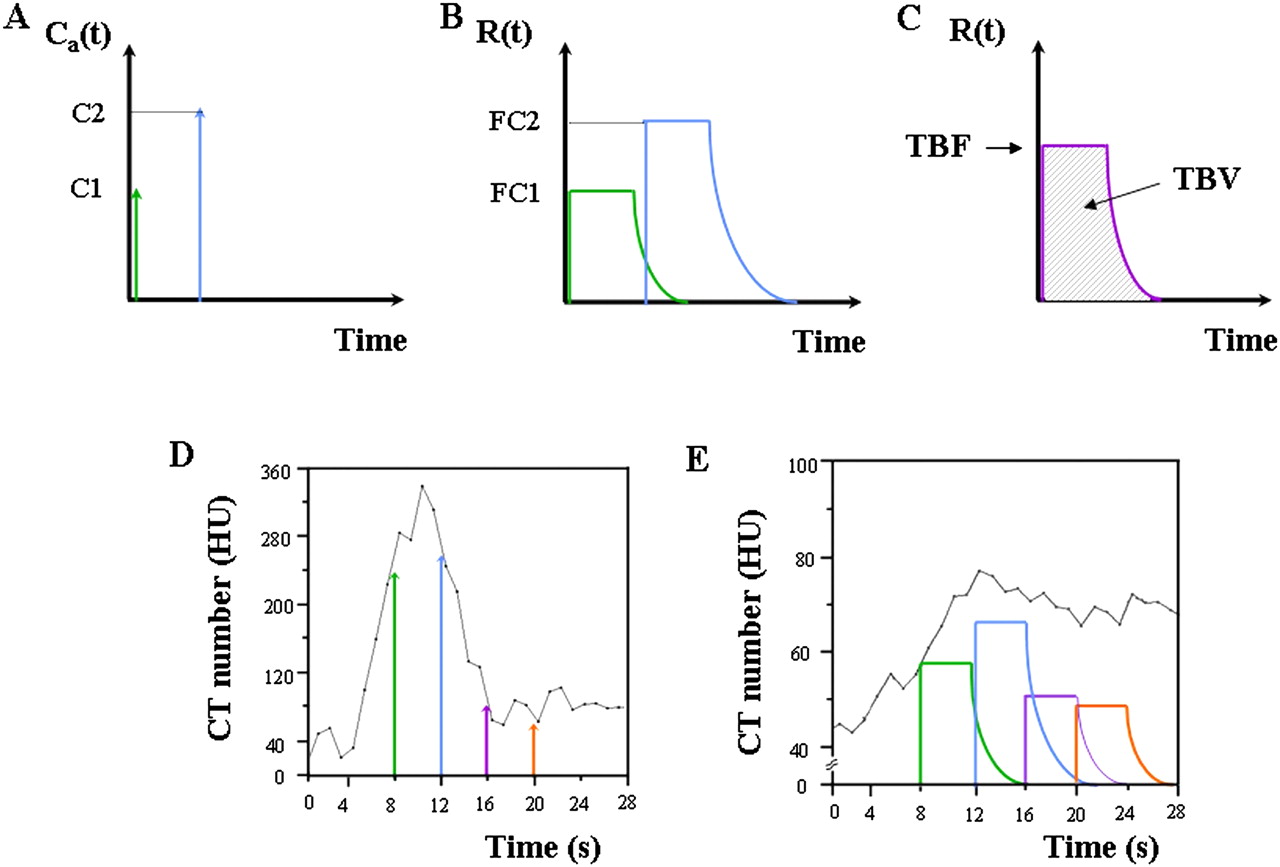
The region of interest (ROI) set on an aorta was selected as the input function for perfusion calculation. The time–density curve of the left ventricular (LV) myocardium was constructed from the 30 images and model-based deconvolution analysis was applied to the input function. The technique was previously described by Eastwood et al14 and is summarised in figure 1. The theory behind this technique is the central volume principle as derived by Meier and Zierler,17 which describes the relationship between TBF, TBV and MTT with equation (A): TBF = TBV/MTT. TBF is the flow (ml/min/100 g) through a given vascular network in the myocardium. TBV is the volume of blood (ml/100 g) within the vessels. MTT is the mean transit time (s) of all blood elements entering the arterial input and leaving at the venous output of the vascular network. When contrast material is injected at the arterial input as a bolus, the mass of contrast agent remaining in the capillary network over time is measured as the impulse residue function, R(t) (figure 1A,B). The tissue time–density curve measured with a CT scanner, Q(t) is expressed by equation (B): Q(t) = TBF × Ca(t)*R(t), where Ca(t) is the enhancement curve measured at the arterial input, and * denotes the convolution operator. R(t) is a theoretical concept and so difficult to measure clinically. Deconvolution between the two curves, Ca(t) and Q(t) (figure 1C,D) then yields the following calculation: TBF × R(t), the initial height of which corresponds to TBF, and the area under the curve corresponds to TBV. MTT can then be calculated from equation (A).

Concept of a model-based deconvolution method. (A) The arterial input of contrast medium, Ca(t) and (B) the corresponding impulse residue function of tissue, R(t). (C) The initial height of R(t) corresponds to tissue blood flow (TBF), and the area under the curve corresponds to tissue blood volume (TBV). Examples of the time–density curve of (D) the aorta and (E) the myocardium obtained from dynamic CT scanning and the relationships with arterial input and tissue impulse residue function, respectively.
In the normal control subjects, TBF, TBV and MTT were measured in one ROI (1022.2±229.3 mm2) set on the whole LV wall. Also, colour-coded TBF, TBV and MTT maps in the whole myocardium were generated. In patients with AMI, the LV wall was divided into three territories of left anterior descending artery (LAD), left circumflex artery (LCx) and right coronary artery (RCA), as previously reported in studies of dobutamine stress echocardiography.18 The perfusion parameters in the infarct area were calculated by free-hand drawing of the ROI (183.0±119.0 mm2) in the territory of the culprit coronary artery. In non-infarcted areas, they were calculated in one circular ROI of 100 mm2 in the territory of the non-culprit artery. The defect area (mm2) on the TBV map was defined as the area where the TBV value at the inside of the boundary decreased over 50% compared with that of the adjacent area in the territory of the culprit coronary artery.5 Furthermore, the LV wall was equally divided into the epicardial side (outer) and the endocardial side (inner) (total of 12 segments). CT value (HU), TBF, TBV and MTT were measured in each segment and calculated as a ratio of the epicardial/endocardial side, and the mean values in the area of the culprit artery between poor and good collateral groups were compared.
All CT images were independently analysed by two experienced readers (YN and KK) who were blinded to all patient and clinical data, including SPECT perfusion data.
Myocardial MRI
First-pass contrast-enhanced myocardial perfusion MR images in the resting state were obtained using a 1.5T MR imager (Intera 1.5T, Philips Medical Systems, The Netherlands) and five-element cardiac receiver coils. First-pass contrast myocardial perfusion MR images were obtained in short-axis imaging planes of the left ventricle with a saturation-recovery balanced turbo field-echo sequence as previously described.19 Myocardial perfusion images were analysed using an image analysis workstation (Virtual Place Aze, Tokyo, Japan).20 In brief, the LV myocardium was divided into 16 segments based on the American Heart Association 17-segment model excluding the apical segment. Patlak plot analysis, which is based on a two-compartment model and describes the K1 of one-way transfer of contrast medium from the blood to the myocardium, was performed using a blood time–intensity curve as an input function and a regional myocardial time–intensity curve as an output function. After calculating perfusion parameter K1 in 16 myocardial segments, TBF was calculated as K1 divided by the extraction fraction of Gd-DTPA.
Comparison between CT-MPI and MR-MPI
Ten patients consisting of five normal subjects and five patients with AMI underwent both MDCT and MRI within a few days. In myocardial perfusion analysis of MDCT and MR images, LV myocardium was divided into the three coronary artery territories, that is, anteroseptal, lateral and inferior regions, and they were further divided into epicardial and endocardial sides. In each of the total of six regions, myocardial TBF was calculated and corrected for the rate–pressure product (RPP) calculated as heart rate (bpm) × systolic blood pressure (mm Hg).
Statistical analysis
Groups were compared using χ2 tests for proportions and Mann–Whitney U tests or analysis of variance for continuous variables, as appropriate. The linearity of a relationship between two variables was assessed by linear regression analysis and the Pearson correlation coefficient was calculated. Differences between TBF/RPP values obtained from CT and MRI were compared using a paired t test and also assessed according to the Bland–Altman plot method. Interobserver variabilities in measurement of TBF, TBV, MTT from CT, and the Tl defect score from SPECT were assessed with the Spearman non-parametric correlation coefficient. A values of p<0.05 was considered significant. Results are expressed as mean±SD.
Results
Baseline characteristics
In normal control subjects (n=15), the mean age was 65.0±8.5 years and 73.3% of the patients were male. Baseline characteristics of the patients with AMI (n=26) are shown in table 1. The mean age was 65.0±10.9 years and 76.9% of the patients were male. The culprit lesions were located in the LAD (n=13), LCx (n=3) and RCA (n=10). A coronary stent was implanted in 92.3% of patients. The average durations from the onset of AMI to MDCT scanning and Tl SPECT scanning were 8.53±3.30 days, and 9.41±3.16 days, respectively. No adverse events occurred in the studied subjects.
Patient characteristics
Myocardial perfusion parameters
An original CT image, a Tl SPECT image, and the colour maps of CT MPI in a representative case are shown in figure 2. The perfusion parameters in normal control subjects were 113.66±24.45 ml/min/100 g in TBF; 8.79±2.06 ml/100 g in TBV; 5.20±1.34 s in MTT. In patients with AMI, the values of TBF, TBV and MTT were 51.96±19.42 ml/min/100 g, 4.47±2.23 ml/100 g, 5.73±3.36 s in infarcted areas, and 108.84±13.29 ml/min/100 g, 9.79±2.58 ml/100 g, 5.71±0.95 s in non-infarcted areas, respectively. There were significant differences in TBF or TBV between infarcted and non-infarcted areas in patients with AMI (p<0.01). However, the MTT of infarcted areas did not differ from that of non-infarcted areas. The interobserver variability for the estimation of TBF was small, with a Pearson correlation coefficient of 0.97 (p<0.01). Similar results were obtained for the estimations of TBV and MTT (table 2).
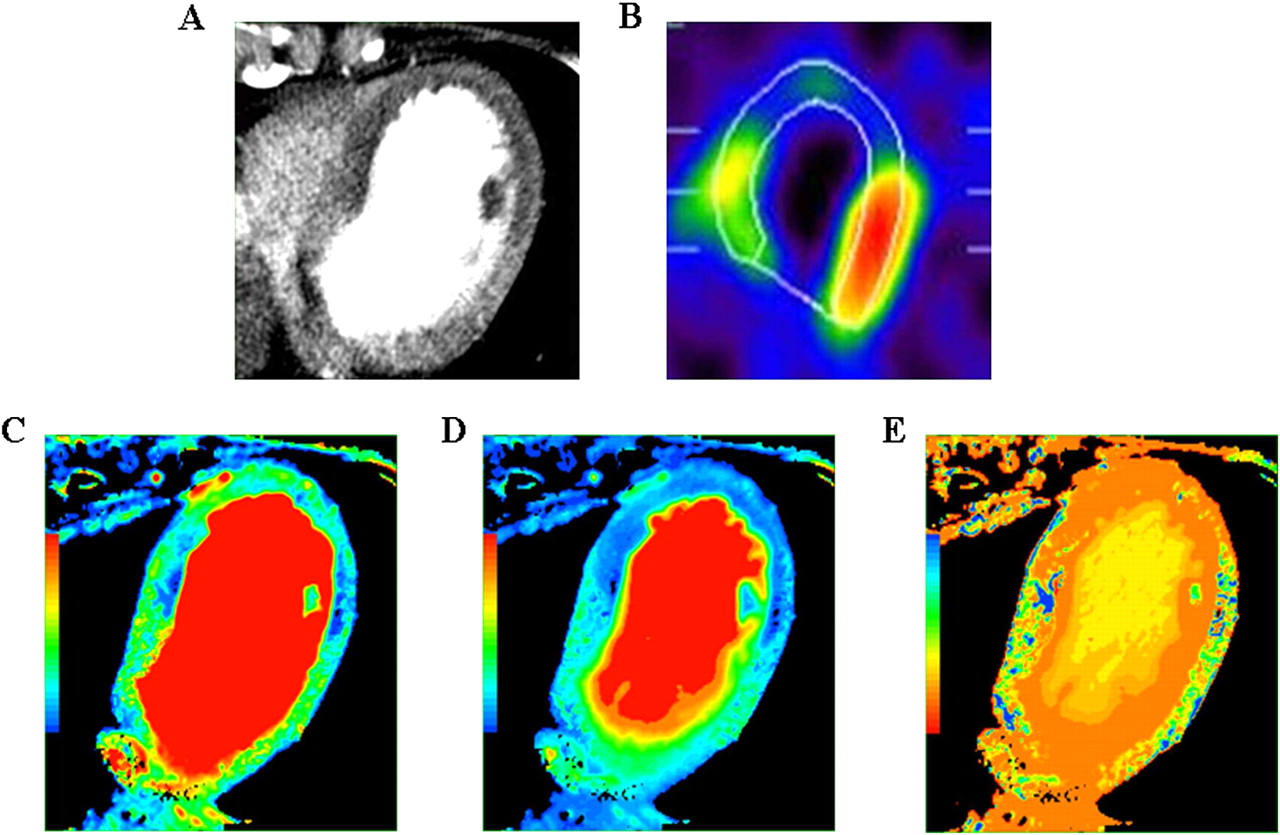
Representative figures for a 64-year-old woman with anterior acute myocardial infarction: (A) contrast-enhanced CT image; (B) Tl single-photon emission CT image; (C) tissue blood flow colour map; (D) tissue blood volume colour map; (E) mean transit time colour map.
Perfusion parameters by MDCT
Estimate of the infarct area
The defect area (mm2) on the TBV map was calculated as an estimate of the infarcted area. It was significantly correlated with the peak CK value and QRS score (R=0.70, p<0.01 for peak CK value; R=0.63, p<0.01 for QRS score). It also showed a significant correlation both with total Tl defect score and the Tl defect score in the culprit coronary artery territory by SPECT. The latter showed a better correlation than the former (R=0.62, p<0.01 for total Tl defect score; R=0.68, p<0.01 for Tl defect score in the culprit coronary artery territory) (figure 3). The interobserver variability for the estimation of Tl defect score was small, having a Pearson correlation coefficient of 0.87 (p<0.01).

Correlations between defect area on tissue blood volume (TBV) map and (A) peak creatine kinase (CK) value, (B) QRS score, and (C) Tl defect score in culprit artery territory in patients with acute myocardial infarction.
Relationship of the epicardial/endocardial ratio with collateral circulation
The mean ratios of the epicardial/endocardial side in normal control subjects were 0.80±0.14 in TBF and 0.84±0.16 in TBV. In the non-infarcted areas, the mean ratios of the epicardial/endocardial side in TBF and TBV were 0.90±0.24 and 0.94±0.24, respectively. In the infarcted areas, there was no significant difference in the ratio of the epicardial/endocardial side of CT value and MTT between poor (Rentrop grade 0/I) and good collateral groups (Rentrop grade II/III) (0.98±0.22 vs 1.05±0.29 in CT value, p=0.50 and 0.99±0.31 vs 0.93±0.28 in MTT, p=0.61). However, in TBF and TBV, they were significantly lower in the poor collateral group than in the good collateral group (0.81±0.24 vs 1.35±0.42 in TBF, p<0.01; 0.87±0.25 vs 1.16±0.30 in TBV, p<0.01) (figure 4).
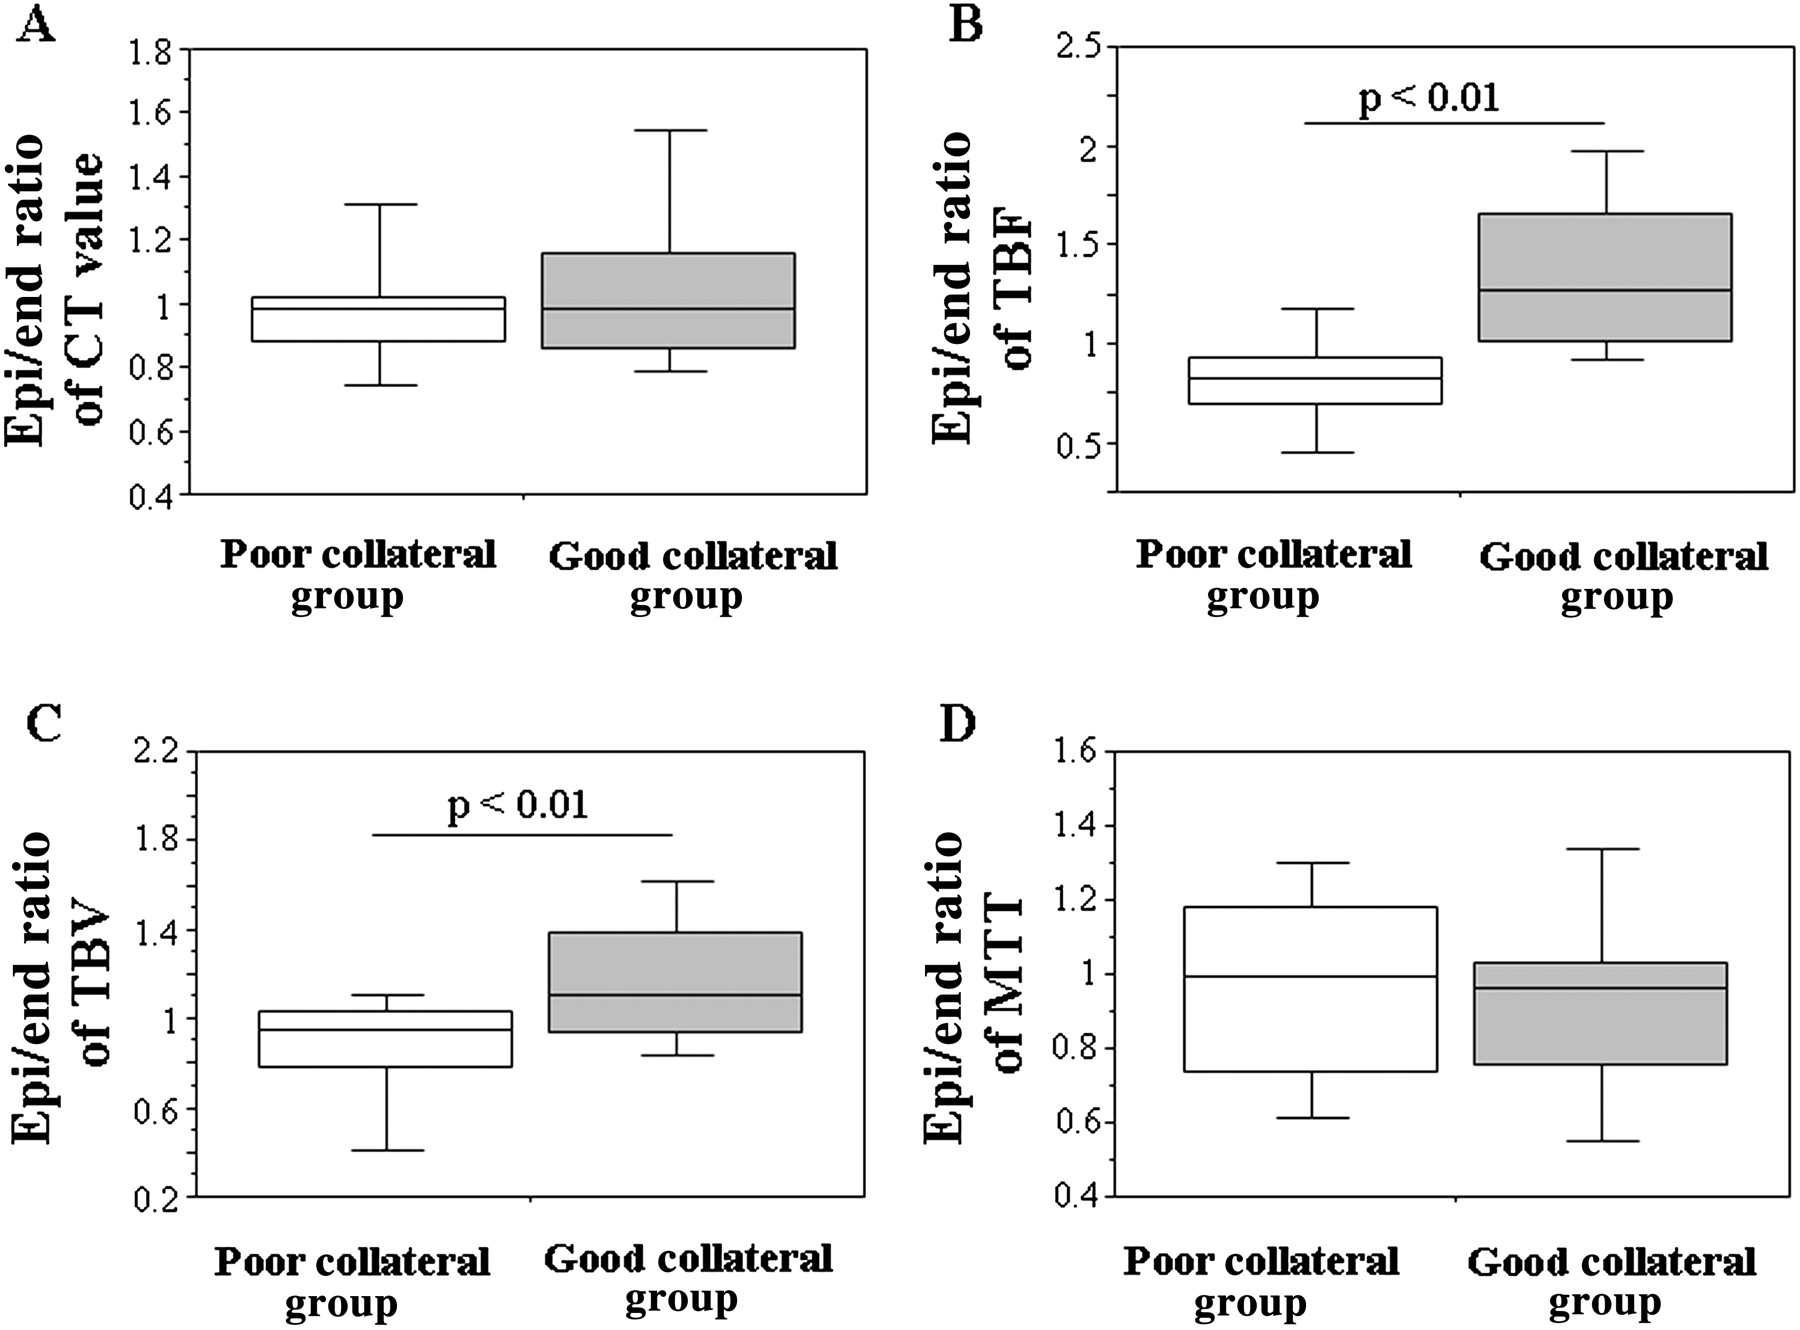
Relationship of the epicardial/endocardial (Epi/End) ratio in (A) CT value; (B) tissue blood flow (TBF); (C) tissue blood volume (TBV); (D) mean transit time (MTT) with collateral circulation. Patients with acute myocardial infarction were divided into two groups according to the Rentrop collateral grade: poor collateral group (n=18) and good collateral group (n=8). The box defines the IQR with the median indicated by the crossbar. The error bars indicate the 10th and 90th percentiles.
Comparison of TBF as revealed by CT-based and MR-based MPI
With MR-MPI, the overall TBF was 111.50±21.85 ml/min/100 g in five normal subjects and the TBF values of infarcted and non-infarcted areas were 56.61±26.06 and 94.04±43.06 ml/min/100 g, respectively, in five patients with AMI. Combining the data of normal subjects and patients with AMI, the TBF/RPP values obtained by CT and MRI were linearly well-correlated (R=0.55, p<0.01; figure 5A). The Bland–Altman plot showed a mean difference of –0.928×10⁻³±4.607×10⁻³ and that the two methods produced similar results in the 60 examination sets on the TBF/RPP (figure 5B).

Comparison of tissue blood flow (TBF) in the myocardium estimated with multi-row detector CT (MDCT)-myocardial perfusion imaging (MPI) and MRI- MPI. (A) Correlation plot of rate–pressure product (RPP)-corrected TBF (TBF/RPP) with MDCT-MPI and MRI-MPI in 60 segments of 10 subjects. (B) Bland–Altman plot of RPP-corrected TBF (TBF/RPP) with MDCT-MPI and MRI-MPI. RPP, rate–pressure product calculated as heart rate (bpm) × systolic blood pressure (mm Hg).
Discussion
When MRI and MDCT with higher spatial resolution is used, detection of the ischaemic myocardium has been reported using early defect and delayed enhanced images with contrast medium. Rapid MRI imaging during the first pass of injected tracer is used to assess myocardial perfusion with a spatial resolution of 2–3 mm and can measure the presence and extent of hypoperfusion caused by flow-limiting coronary artery disease (CAD).20 Absolute MBF can be obtained from the time–intensity curves of the myocardium and arterial input function using the Patlak plot or deconvolution method.21 Choe et al compared the ability of MDCT with that of MRI for the detection and measurement of the myocardial infarct size.22 They showed that high-resolution MDCT is more beneficial in detecting perfusion defects in early-phase CT than perfusion MRI. In the first-pass MRI study, since high-speed imaging is needed, the images become lower resolution and may be affected by noise and artefacts.
The evaluation of myocardial perfusion using MDCT has not been established. The main disadvantage is the potentially high doses of ionising radiation because of the need for multiple exposures to x-rays to acquire the necessary data for the generation of accurate time–density curves. Beam-hardening and motion-related artefacts result in variations in signal intensity within the myocardium, limiting the ability to quantitatively assess perfusion. In addition, the mathematical modelling involved in this type of analysis adds complexity and it is unknown which mathematical model is the most appropriate in the clinical setting. Various experimental studies have recently been reported. George et al suggested that MDCT MPI analysis using the subendocardial attenuation value (subendocardial/mean value at systole or subendocardial/subepicardial value) might be useful for the detection of ischaemic myocardium in patients with suspected CAD.23 Kido et al estimated MBF from the slope of the linear regression equation with Patlak plots analysis of time–density curves in patients undergoing first-pass dynamic MDCT after ATP loading.24 In an animal model, George et al adopted a model-based deconvolution method for MBF measurements by dynamic MDCT imaging.9 A model-based deconvolution model has been adopted in the evaluation of cerebral blood perfusion in the clinical setting.13 Also, perfusion CT using a deconvolution model is reported as a feasible technique for tumour vascularity and angiogenesis in hepatocellular carcinoma.25 In this study, we quantified MBF in normal subjects and patients with AMI using a deconvolution algorithm in addition to a beam-hardening correction. In a human PET study, TBF of the normal myocardium at rest was reported to be 1.0–1.5 ml/g/min,6 which was concordant with our present findings. Maes et al reported that, using [11C]acetate PET, TBF values in infarcted and remote areas were 0.46±0.11 and 0.83±0.18 ml/g/min, respectively, in patients with TIMI flow grade 3 reperfusion of AMI.26 Those results were also in good agreement with our findings.
The perfusion parameters TBF, TBV, and MTT were calculated and maps generated for each in this study. In the infarcted myocardium, TBF and TBV were significantly decreased, but MTT was not increased. The extent of regional abnormalities on the perfusion maps was greater with TBV than with TBF or MTT maps. In the cerebral perfusion CT studies, MTT maps were the most sensitive for the detection of stroke, while CBF maps showed the best correlation between critical ischaemia and prognostic evaluations.13 In contrast to cerebral perfusion, the clinical utility of MTT may be limited, but the TBV map was of high quality and high diagnostic value in the myocardial perfusion. These differences might be derived from the development of collateral circulations between cerebrum and myocardium or the fact that reperfusion therapy in AMI may shorten the MTT. Further investigation will be necessary to understand the detailed clinical significance of each parameter or map.
Our study demonstrates the feasibility of evaluating myocardial perfusion in a single scan of CT that can be performed more frequently and easily in clinical practice. The scan protocol works as the test scan of CTA, and the myocardium perfusion and coronary artery stenosis can be simultaneously evaluated in a single examination. Therefore, improved diagnostic accuracy would be expected in the patient management of AMI, and also of other CAD.5 The SPECT defect score and angiographic myocardial blush grade have been previously reported to be prognostic factors in patients with AMI,2 3 which may indicate that quantitative myocardial perfusion analysis is more useful for the prognosis in AMI. The myocardial viability—that is, functional recovery after revascularisation, is inversely proportional to the transmural extent of myocardial infarction. The cardiac MRI study has shown that the transmural extent of delayed gadolinium enhancement was associated with viable myocardium.27 Thus, the epicardial to endocardial ratio of MBF by CT MPI might be related to the myocardial viability.23 In this study, the TBF and TBV maps could quantitatively demonstrate the defect area as a surrogate of the infarcted area, and regional perfusion parameters: TBF, TBV, and MTT, and the epicardial/endocardial ratio were obtained. However, since the number of studied subjects was small, we could not evaluate the associations between the parameters and the patient prognosis or myocardial viability. Further studies will be needed to clarify whether the perfusion defect area or perfusion parameters (the epicardial/endocardial ratio) as shown in this study might be associated with the prognosis or myocardial viability in myocardial infarction more precisely.
Limitations
Several limitations should be considered in interpreting our results. First, this study was the first trial in a small group of patients with AMI and assessed rest MPI only. The MPI needs to be evaluated in more patients including other patients with CAD for clinical utility. Second, Blankstein et al have recently reported that the dual-source CT protocol was successfully performed for adenosine-induced stress MPI with diagnostic accuracy comparable to SPECT.28 Ho et al have shown that vasodilator-stress MPI with 128-slice dual-source CT identified areas of abnormal flow reserve and infarction with a reasonable radiation dose.29 Although their protocols were somewhat different from ours and the dual-energy-based iodine mapping might be more sensitive for the detection of hypoperfused area in the myocardium, it would be interesting to examine whether our method has the ability to precisely detect stress-induced myocardial perfusion defects. Lastly, the applicability of the present CT-MPI in the clinical setting may be limited owing to limited cardiac coverage in the z-axis. Indeed, in this study, the cine scan was performed at 40 mm of scan length from 10 mm below the level of left main trunk towards the apex of the left ventricle, which corresponded to approximately two-thirds coverage of the left ventricle, and the eight axial slices were obtained at 5 mm thickness. We analysed one axial slice from the eight slices, which included the three territories of RCA, LAD and LCx minimally as shown in the studies of stress echocardiography.18 Information about MBF in the other slices was missed and the accuracy of MBF may be improved when analysed in all the eight-slice scans. Furthermore, a 320-line detector CT (Toshiba, Japan) has been developed recently, and information about the whole heart can be obtained in a single scan because the detector width is 20 cm.30 If the 320-line MDCT were combined with this scan protocol and analysis, a 3D fusion image (volume rendering image and perfusion colour maps) and short-axial perfusion colour map could be obtained and blood flow information of the whole myocardium could be analysed like SPECT MPI. Also, improved coverage in the z-axis will reduce slab misregistration artefacts and radiation exposure.
Conclusion
CT MPI was successfully performed in patients with AMI using first-pass, contrast-enhanced MDCT imaging combined with deconvolution analysis. The perfusion parameters, perfusion defect area and transmural differences in the myocardium could be quantitatively and reasonably assessed. The ability to perform MPI during CTA may provide a more conclusive cardiac investigation and improve the clinical treatment and prognosis of patients with CAD, including AMI.
References
Footnotes
See Editorial, p 521
Yoshifumi Nakauchi and Yoshitaka Iwanaga contributed equally to this work.
Funding SM received research support from Daiichi-Sankyo Pharmaceutical Co.,Ltd., Eisai Co.,Ltd., Sanofi-Aventis K.K., and Shionogi & Co.,Ltd., but they played no role in conception, conduct or analysis of this study.
Competing interests MK is an employee of GE Healthcare.
Patient consent Obtained.
Ethics approval Approved by an institutional review board.
Provenance and peer review Not commissioned; externally peer reviewed