Article Text

Abstract
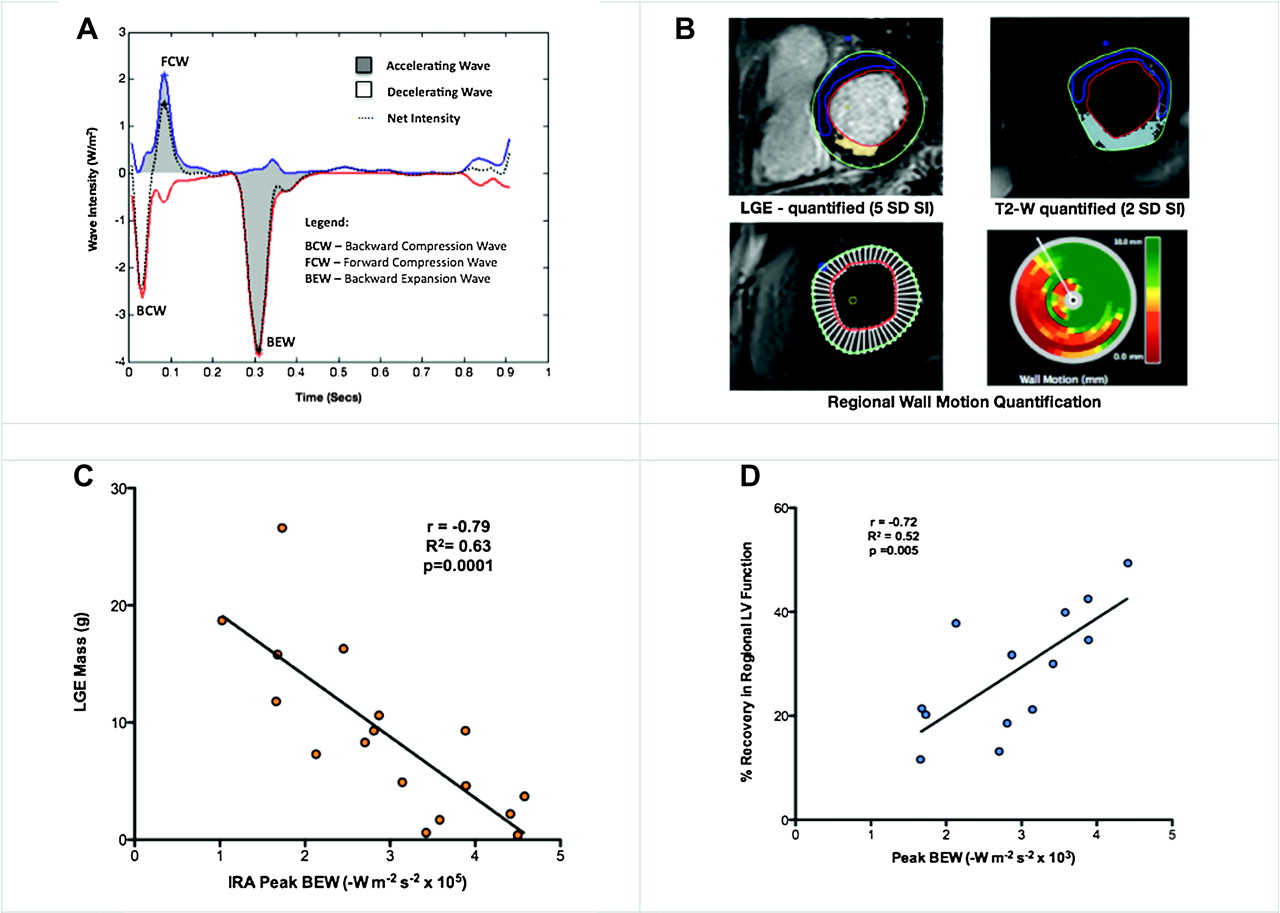
Introduction Wave intensity analysis (WIA) uses simultaneous changes in intracoronary pressure and flow to characterise energy transfer within the coronary circulation. In normal hearts, flow is predominantly driven by a microcirculatory-derived, diastolic phase, backward expansion wave (BEW) and aortic-derived, systolic phase, forward compression wave (FCW) (Abstract 133 figure 1A). Regional changes in contraction and microvascular function following acute coronary syndromes (ACS) may affect these waves, but the utility of WIA in this setting remains unknown.
(A) Typical Coronary Wave Intensity Profile. (B) Quantitative LGE Mass and Regional Wall Motion Assessment. (C) Peak IRA BEW Wave Intensity vs LGE Mass. (D) BEW Correlation with Regional LV Recovery.
Methods Patients were included 2–7 days after presenting with Non-ST elevation myocardial infarction (NSTEMI). Those with prior MI, haemodynamic instability or coronary artery disease unsuitable for PCI were excluded. Left ventricular ejection fraction (LVEF) and late-gadolinium enhancement (LGE) were assessed by cardiac MRI. Subsequently, intra-coronary (IC) pressure and Doppler measurements were taken in the infarct-related artery (IRA) and a remote reference vessel (REF), during IC adenosine-induced hyperaemia. Blinded WIA was performed offline. Regional left ventricular recovery following percutaneous coronary intervention (PCI) was quantitatively assessed by MRI, at 3 months (Abstract 133 figure 1B). Pearson Regression analysis was performed to assess the statistical relationship between WIA and size of infarction and recovery in function, following PCI.
Results 18 patients (57±11 yrs) 88±51 h post-myocardial infarction were enrolled. 12-h Troponin T, LVEF and % left ventricular infarct (LGE) mass were 1.53±1.40 μg/l, 56%±11.1% and 8.9%±6.0% respectively. BEW and FCW energies predominated with the mean peak WI being −3.17 and +2.80 (W/m2/s2×105) respectively. IRA BEW energy strongly correlated with regional left ventricular recovery (R2=0.53, p=0.005) and was inversely correlated to infarct mass (R2=0.63, p<0.0001) (Abstract 133 figure 1C). REF BEW correlated weakly with LGE (R2=0.34, p=0.03).
Conclusion The microcirculatory backward expansion wave energy correlates with the magnitude and location of infarction and is predictive of recovery in function following acute coronary syndromes. Therefore, coronary wave intensity analysis may be a useful adjunctive tool during cardiac catheterisation in the assessment of viability following ACS.
- Wave intensity analysis (WIA)
- viability
- acute coronary syndrome (ACS)