Article Text

Abstract
Background Aortic stenosis (AS) leads to diffuse fibrosis in the myocardium, which is linked to adverse outcome. Myocardial T1 values change with tissue composition.
Objective To test the hypothesis that our recently developed non-contrast cardiac magnetic resonance (CMR) T1 mapping sequence could identify myocardial fibrosis without contrast agent.
Design, setting and patients A prospective CMR non-contrast T1 mapping study of 109 patients with moderate and severe AS and 33 age- and gender-matched controls.
Methods CMR at 1.5 T, including non-contrast T1 mapping using a shortened modified Look–Locker inversion recovery sequence, was carried out. Biopsy samples for histological assessment of collagen volume fraction (CVF%) were obtained in 19 patients undergoing aortic valve replacement.
Results There was a significant correlation between T1 values and CVF% (r=0.65, p=0.002). Mean T1 values were significantly longer in all groups with severe AS (972±33 ms in severe asymptomatic, 1014±38 ms in severe symptomatic) than in normal controls (944±16 ms) (p<0.05). The strongest associations with T1 values were for aortic valve area (r=−0.40, p=0.001) and left ventricular mass index (LVMI) (r=0.36, p=0.008), and these were the only independent predictors on multivariate analysis.
Conclusions Non-contrast T1 values are increased in patients with severe AS and further increase in symptomatic compared with asymptomatic patients. T1 values lengthened with greater LVMI and correlated with the degree of biopsy-quantified fibrosis. This may provide a useful clinical assessment of diffuse myocardial fibrosis in the future.
This is an Open Access article distributed in accordance with the Creative Commons Attribution Non Commercial (CC BY-NC 3.0) license, which permits others to distribute, remix, adapt, build upon this work non-commercially, and license their derivative works on different terms, provided the original work is properly cited and the use is non-commercial. See: http://creativecommons.org/licenses/by-nc/3.0/
Statistics from Altmetric.com
Introduction
The ability to quantify diffuse myocardial fibrosis (DMF) in patients non-invasively is of considerable clinical interest as the pathology of DMF is reversible with treatment and therefore a potential treatment target.1 ,2 The final common end point of DMF is irreversible focal fibrosis, which is linked directly to prognosis in a variety of conditions, including aortic stenosis (AS), hypertrophic and dilated cardiomyopathy,3–5 and can be measured with cardiovascular magnetic resonance (CMR) imaging using post-contrast late gadolinium enhancement.6–8
Measurement of DMF is, however, more complex. The current ‘gold standard’ method for quantification of DMF of the left ventricle is myocardial biopsy, which is invasive, associated with morbidity, subject to sampling error and cannot determine the fibrotic involvement of the whole left ventricle.9 Focal fibrosis, such as infarction, changes the longitudinal relaxation properties (T1 values) of tissue during CMR,10 and animal work suggests that the same occurs in diffuse fibrosis.11 New CMR techniques have exploited these changes in T1 values to permit the measurement of DMF.9 ,12 However, these methods measure post-contrast myocardial T1 values or the change in T1 after a contrast bolus or infusion,13 ,14 and this is time consuming, demands complex processing and cannot be used in patients with severe renal impairment owing to the risk of nephrogenic systemic fibrosis.9 A technique for measuring DMF without the need for contrast agent would therefore be attractive as it has the potential to reduce scan time (and cost), and can be applied in patients with renal disease without concern.
We therefore investigated the value of measuring non-contrast T1 values for assessment of DMF in humans using our recently developed shortened modified Look–Locker inversion recovery (ShMOLLI) T1 mapping sequence. Surgical biopsy specimens from patients with AS (a disease in which fibrosis is known to be diffuse and variable between patients) served as the gold standard disease model for DMF in this study.
ShMOLLI has already been used successfully in a clinical setting and showed increased non-contrast T1 values in patients with acute myocardial infarction.15 Earlier studies in models of focal fibrosis, such as infarction, also showed increased myocardial non-contrast T1 values (eg, 1060±61 ms compared with 987±34 ms in remote myocardium).10
We therefore hypothesised that:
-
non-contrast T1 values would correlate well with the degree of fibrosis as measured in surgical biopsy specimens from patients with AS;
-
that T1 values would be increased in patients with AS compared with normal volunteers.
Methods
Study population
Between July 2010 and March 2012, 24 symptomatic patients with severe AS awaiting aortic valve replacement (AVR) were prospectively enrolled from the Heart Hospital Imaging Centre in London, UK; these patients underwent myocardial biopsy at the time of surgery. A second group of 85 asymptomatic patients with moderate or severe AS (based on Doppler echocardiographic demonstration of peak aortic valve gradient ≥36 mm Hg or valve area <1.5 cm2, according to established criteria)16 were recruited prospectively from cardiology clinics at the John Radcliffe Hospital in Oxford, UK. Exclusion criteria were contraindications to CMR (including defibrillators and pacemakers), more than mild aortic or mitral regurgitation, significant left ventricular (LV) dysfunction (LV ejection fraction <40%), uncontrolled hypertension or severe renal failure (serum creatinine >200µmol/l), which could in itself increase myocardial fibrosis.
Thirty-three age- and sex-matched normal volunteers were also recruited from both centres; comorbidities and symptoms of cardiac disease were excluded before inclusion in the study. The study was approved by the ethics committees at both institutions and all patients and normal volunteers gave written informed consent.
CMR protocol
All subjects underwent CMR with a 1.5 T clinical scanner (Avanto, Siemens Healthcare, Erlangen, Germany). In the AS population, standard LV volumes were acquired, together with additional short-axis images of the aortic valve, in line with standard cardiovascular MRI protocols.17 In addition, a mid-ventricular short-axis slice was acquired using the ShMOLLI sequence for T1 mapping in all subjects.18
Image analysis
CMR image analysis was performed offline using Qmass software (Medis, Leiden, The Netherlands) according to the Society for Cardiovascular MR guidelines for reporting cardiovascular MR examinations.19 LV volumes and function were analysed with all parameters indexed to body surface area. Aortic valve area was determined by direct valve planimetry.
T1 measurements
A region of interest in the septum was chosen to match the imaging and histological locations as closely as possible (biopsy samples were taken from the septum). Manual contouring was used to define the septum as the region of interest (ROI) on each image. ShMOLLI T1 maps sometimes demonstrated typical steady-state free precession susceptibilities to off-resonance artefacts and partial volume effects, and we assessed the images for areas with potentially compromised T1 values in three ways, as previously published20 ,21: we examined the T1 map itself, the raw T1 images, and also R2 maps. In all cases, the myocardial T1 could be reliably measured within the septum on at least one large ROI. The T1 of the ROI was calculated using in-house software (MyoCardial Regions Of Interest (MC-ROI), programmed by author SKP in Interface Definition Language V.6.1, ITT Exelis, Mclean, Virginia, USA) as described by Piechnik et al.18 See figure 1.

Top panel: colour maps of T1 values using shortened modified Look–Locker inversion in a mid-ventricular short-axis slice; bottom panel: the corresponding slice with late gadolinium enhancement (LGE) imaging. The left-hand panel shows a normal volunteer (T1=944 ms). The middle panels show moderate aortic stenosis (AS) with moderate left ventricular hypertrophy (T1=951 ms). The right-hand panel shows severe AS with severe left ventricular hypertrophy (T1=1020 ms).
Histology
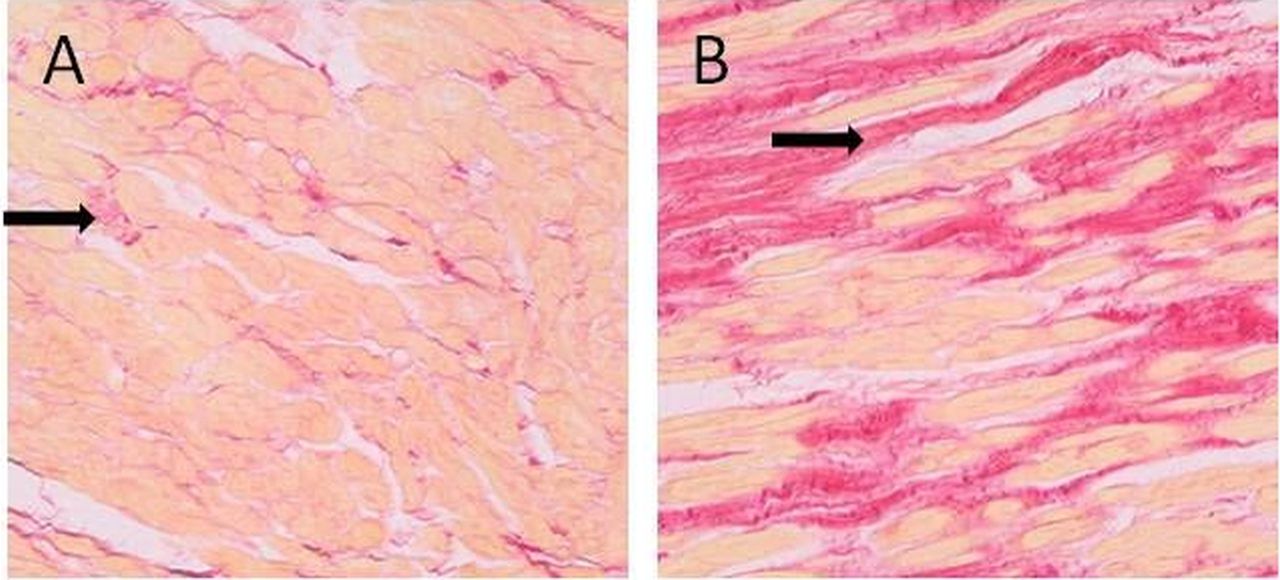
Histological sampling and analysis was performed as previously described by Flett et al.14 In summary, an intraoperative deep myocardial biopsy specimen (Tru-cut type biopsy needle) was taken from the basal LV septum, stained with picrosirius red, and photographed at high-power magnification (×200), figure 2. The collagen volume fraction was automatically quantified over an average of 12 high-power fields using a purpose-written macro in ImageJ.22 All samples were analysed (by ASF) blinded to the CMR findings and T1 values. Samples were excluded if they were found to contain superficial (mainly endocardial) tissue or extremes of patchy fibrosis.

Histology of the myocardium in patients with aortic stenosis stained with picrosirius red. Black arrows show fibrosis. (A) A patient with mild fibrosis (collagen volume fraction (CVF)=8% and T1=952 ms). (B) A patient with heavy fibrosis (CVF=27% and T1=1063 ms).
Exercise testing
All patients with asymptomatic AS underwent exercise treadmill testing. This was performed according to the Naughton protocol,23 as this has a smoother profile of increasing speed/incline than other protocols, to allow a better assessment of maximum walk time.
Data analysis and statistics
Data analysis was performed with IBM SPSS Statistics, V.20.0 (Chicago, Illinois, USA). Values are expressed as means±SD unless otherwise stated. All continuous variables were normally distributed (Kolmogorov–Smirnov test). The χ2 test was used to compare discrete data, as appropriate. Comparison of continuous variables between the four groups were performed using analysis of variance with post hoc Bonferroni correction. Correlations between variables were assessed using Pearson's method. Variables with a significant association with T1 from Pearson's analysis were entered into a multiple linear regression analysis to identify those with an independent association. Statistical tests were two tailed, and a p value <0.05 was considered to indicate a statistically significant difference.
Results
Baseline clinical and imaging data
One hundred and nine patients with AS and 33 normal volunteers were recruited in the study period. The demographic data are presented in table 1 and imaging data in table 2. There were no significant differences in gender or ages between the normal controls and patients with AS.
Baseline characteristics of study groups
Baseline echocardiographic and cardiac MR parameters
Correlation of histology and T1 values
There was a moderate correlation between myocardial T1 values and histological percentage of fibrosis (r=0.65, p=0.002), see figure 3. LV biopsy samples were obtained in 23 of the 24 patients with severe symptomatic AS. One patient had not yet undergone the planned operative procedure at the time of writing. Four biopsy specimens were excluded from further analysis according to the pre--specified exclusion criteria: (1) extremes of patchy fibrosis (n=2); (2) sample too superficial and included mainly endocardial tissue (n=2).

Correlation of myocardial collagen volume fraction from intraoperative myocardial biopsy specimens and non-contrast T1 times, in 19 subjects undergoing aortic valve replacement. The central line represents the regression line; the curved outside lines represent the 95% CI for this.
Non-contrast T1 values in patients with DMF and normal subjects
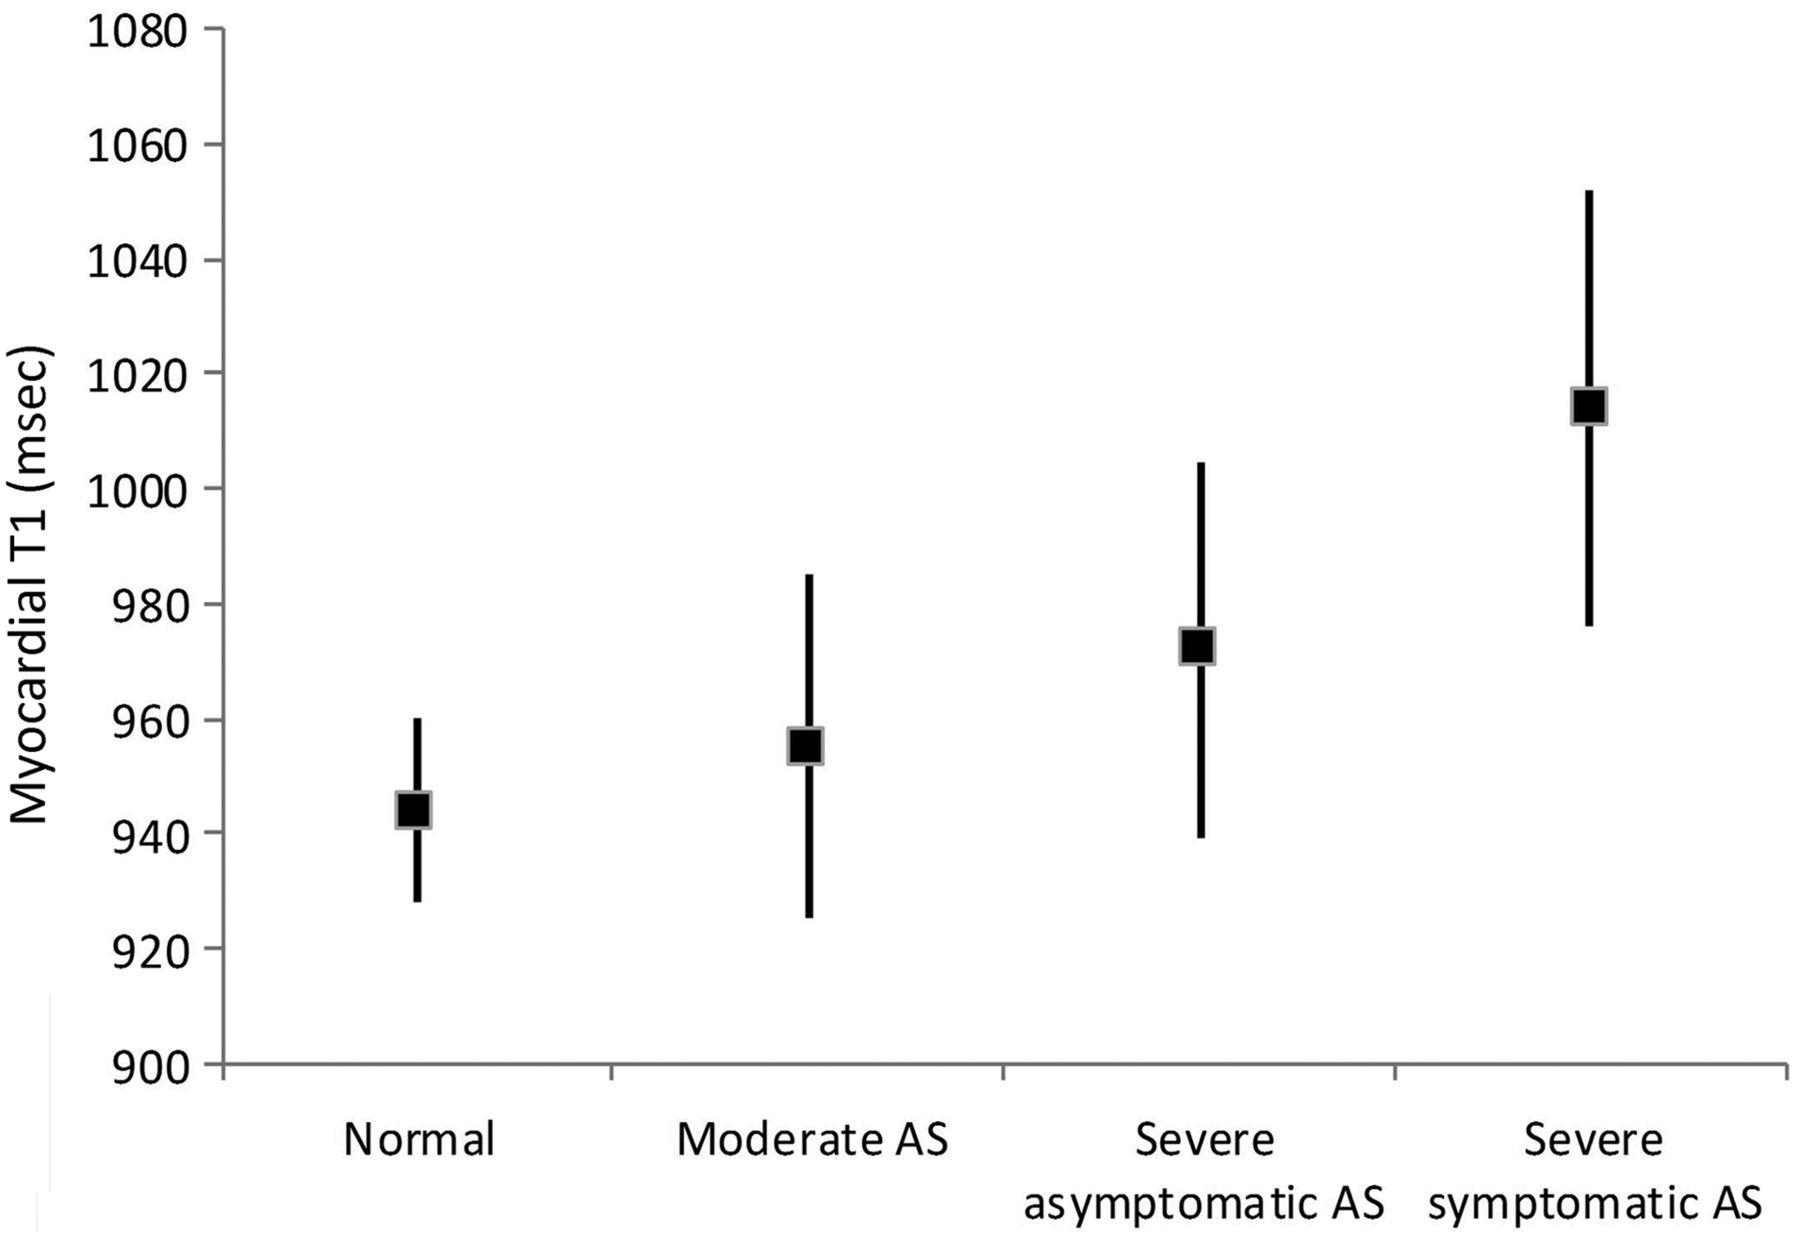
The mean T1 values in the AS group were significantly higher (971±39 ms) than in normal volunteers (944±16 ms) (p<0.001). T1 values lengthened with the severity of AS, however: mean±SD T1 values 955±30 ms in moderate AS, 972±33 ms in severe asymptomatic AS, 1014±38 ms in severe symptomatic AS, and were higher in both severe AS groups than in normal controls (p<0.05 for severe asymptomatic group; p<0.001 for severe symptomatic group; figure 4). T1 values in the group with severe symptomatic AS were also significantly higher than in the groups with severe asymptomatic AS and moderate AS (both p<0.001). Groups with moderate AS were not significantly different from normal controls. Non-contrast T1 values had a significant association with age, LV mass index, AV area, peak AV gradient and time walked on the treadmill (table 3). A stepwise multivariate linear regression analysis showed that only AV area (p=0.001) and LV mass index (p=0.008) were independently associated with non-contrast T1 values.
Bivariate and multivariate analysis of associations with T1 values
Whisker plot of mean myocardial T1 values (square symbols) with SDs (lines) in normal controls, and groups with moderate aortic stenosis (AS), severe asymptomatic AS and severe symptomatic AS.
Discussion
We have shown that (1) non-contrast T1 values measured using the ShMOLLI CMR sequence18 correlate well with percentage collagen volume fraction as measured from histology in patients with AS (a recognised model for DMF in humans); (2) non-contrast T1 values are increased in AS; and (3) non-contrast T1 values in AS increase with lesion severity.
To our knowledge, this is the first study in animals or humans to show a robust correlation between the degree of DMF and non-contrast T1 values measured using the ShMOLLI CMR sequence. T1 mapping sequences such as MOLLI (modified Look–Locker inversion recovery)24 have been previously used to estimate DMF by determining the myocardial extracellular volume, but this requires the administration of the extracellular contrast agent gadolinium, to compare the ratio of signal change (T1 before and after contrast) in blood and myocardium14 Breath-hold times for MOLLI sequences are also relatively long (15–20 s) and can be difficult in patients with cardiac disease.
ShMOLLI represents an exciting new development in the application of T1 mapping in clinical practice for a number of reasons. It enables myocardial T1 values to be measured robustly and in a single breath-hold (10 s), making this sequence easy to apply in a clinical setting even in patients who have difficulty in holding their breath. The generated values are substantially independent of heart rate, and data post-processing is straightforward.18 Most importantly, the T1 values measured are reproducible20 ,21 and in our study were sufficiently accurate to detect changes in global myocardial T1 in patients with DMF without the need for contrast, and which correlated well with fibrosis burden measured in biopsy samples.
The simplicity of the method means that non-contrast mapping using SHMOLLI lends itself well to routine non-invasive assessment of DMF in cardiac disease; the technique is fast, simple to apply and the colour map generated in a single breath-hold may provide useful clinical information quickly. In addition, there are significant clinical advantages over non-contrast imaging; gadolinium contrast is a relative contraindication in patients with severe renal failure, carries a cost and increases scan time.
An interesting finding of this study was the range of T1 values measured in the patients with AS of mixed severity. The T1 values were longest in patients with severe symptomatic AS, and significant difference in T1 values were found between the groups with severe asymptomatic and symptomatic AS. The appearance of symptoms in patients with AS is not well explained by simple haemodynamics alone25 ,26 and it has long been suspected that myocardial disease, particularly fibrosis, plays an important role; this study support that hypothesis. Recently, a large biopsy study confirmed that fibrosis in AS is linked to both clinical status and long-term survival after AVR.27 CMR has shown an ability to detect focal fibrosis in patients with AS using the late gadolinium enhancement technique, and this has been linked to prognosis.3 The ability to measure DMF and focal fibrosis in AS non-invasively may thus be of significant clinical benefit, and be potentially useful for monitoring disease progression and antifibrotic treatments in both conventional and ‘low-flow’ AS.6 ,28 ,29
The overlap in T1 values between the group with moderate AS and normal volunteers in our study is noted. This may reflect normal myocardial tissue in this AS group with an excellent prognosis, and supports the concept that the myocardial response is an important part of the progression to more symptomatic disease. The negative correlation between increasing T1 values and time spent on the treadmill in the group as a whole would also support this. However, recent work shows an extremely wide range of DMF (8–42%) in symptomatic patients undergoing AVR14 which suggests that the factors leading to symptom development in patients with AS are multiple, and may not be due to fibrosis alone. In the long term, an integration of several indicators may help to predict symptom progression, including fibrosis burden, pressure overload, degree of LV hypertrophy, filling pressure and perfusion reserve. However, the correlation of myocardial T1 with the degree of histological fibrosis and the progression across AS groups suggests that this measure may have future potential as an indicator of myocardial dysfunction and/or prognosis.
Study limitations
The correlation between T1 values and fibrosis is based on a relatively small number of samples and might have been influenced by individuals with extreme levels of fibrosis. There is also a wide range of DMF for T1 values between 960 and 980 ms and overlap in T1 values between symptomatic and asymptomatic patients. This may limit its usefulness in individual patients.
Age has been shown to affect myocardial T1 values,30 and we attempted to avoid this potentially confounding effect by matching our control subjects for age. The non-contrast T1 values for normal subjects in this study using ShMOLLI (944±16 ms) were marginally shorter than those published in the literature using the MOLLI sequence (977±33 ms).10 Whether this is because our normal subjects were older than in previous studies (being age matched to the patients with AS), or because of differences in mean T1 values measured by different sequences, merits further investigation.30 The fibrosis content of the ageing heart is unclear, however; a recent study showed no increase in myocardial extracellular volume as the heart ages,31 whereas another small study showed an increase in interstitial fibrosis in the ageing heart.32
The only model of DMF investigated in this study was AS and it would be interesting to apply this method in other cardiac pathologies.
Conclusion
We have shown that non-contrast T1 values measured using the ShMOLLI CMR sequence correlate with DMF burden measured by histology in patients with AS. The application of this technique is feasible in a clinical setting and it has the potential to be used as a simple, non-invasive, non-contrast assessment of DFM in cardiac disease. Further work will be required to determine its role in monitoring potential future antifibrotic treatments, and to aid risk stratification of cardiac patients.
References
Footnotes
-
Contributors SB, SKW, TDK, JCM: conception and design and analysis and interpretation of data, drafting the article or revising it critically for important intellectual content. SKP, ASF, VMF, ML, JMF, MDR: analysis and interpretation of data. BDP: drafting the article or revising it critically for important intellectual content. SN, SGM: conception and design, drafting the article or revising it critically for important intellectual content and final approval of the version to be published.
-
Funding The work was supported by a Heart Research UK project grant RG2512 and the Oxford Comprehensive Biomedical Research Centre, funded by the UK National Institute for Health Research. SB and SKW are supported by British Heart Foundation clinical research training fellowships FS/10/015/28104 and FS/10/72/28568, respectively. SN acknowledges support from the Oxford BHF Centre of Research Excellence. VMF is funded by the Alberta Innovates Health Solutions (AIHS) clinical fellowship and the University of Oxford Clarendon Fund scholarship. MDR is funded by an MRC programme grant G0900883.
-
Competing interests None.
-
Ethics approval Oxfordshire research ethics committee C.
-
Provenance and peer review Not commissioned; externally peer reviewed.
-
Open Access This is an Open Access article distributed in accordance with the Creative Commons Attribution Non Commercial (CC BY-NC 3.0) license, which permits others to distribute, remix, adapt, build upon this work non-commercially, and license their derivative works on different terms, provided the original work is properly cited and the use is non-commercial. See: http://creativecommons.org/licenses/by-nc/3.0/