Article Text

Abstract
Objective The study purpose was to assess the usefulness of echocardiographic parameters of aortic stenosis (AS) severity and left ventricular (LV) systolic function to predict mortality in AS. The main hypothesis is that parameters of LV systolic function are the most important independent predictors of mortality, whereas parameters of stenosis severity are not.
Methods 1065 consecutive patients with AS referred to the echocardiography laboratory and meeting the inclusion/exclusion criteria were included and followed during 5.7 years. The end points were aortic valve replacement (AVR) (n=584), composite of AVR or death (n=932), all-cause mortality (n=550) and cardiovascular mortality (n=398).
Results The most powerful echocardiographic predictors of valve-related events were parameters of AS severity, such as peak aortic jet velocity (VPeak), mean gradient (MG) and aortic valve area (AVA) (all p<0.001). Regarding mortality, the main predictors were LV ejection fraction (LVEF) and stroke volume index (SVi) (p<0.05). After multivariable adjustment, LVEF (p<0.001) and SVi (p=0.02) remained the only echocardiographic predictors of mortality, even after adjustment for symptomatic status. AVA was also associated with mortality, whereas VPeak and MG were not.
Conclusions The most powerful echocardiographic predictors of mortality are low LVEF and low flow, whereas AS severity parameters predict valve-related events but not overall mortality. Hence, low flow should be integrated in the risk stratification and therapeutic decision-making in patients with AS.
Statistics from Altmetric.com
Introduction
The 2012 European Society of Cardiology/European Association of Cardio-Thoracic Surgery and 2014 American College of Cardiology/American Heart Association guidelines propose to use the following echocardiographic parameters and criteria to define severe aortic stenosis (AS): peak aortic jet velocity (VPeak) ≥4 m/s, mean gradient (MG) ≥40 mm Hg and aortic valve area (AVA) ≤1 cm2.1 ,2 Furthermore, these guidelines recommend aortic valve replacement (AVR) when the stenosis is severe and the patient develops symptoms and/or left ventricular (LV) systolic dysfunction, which is defined as LV ejection fraction (LVEF) <50%.1 ,2 The vast majority of the outcome studies, on which these recommendations are based, used the composite end point of AVR or death, which is largely driven by AVR.3–7 These studies reported that parameters of AS severity, such as VPeak or MG, are the most powerful independent predictors of these events. However, very few studies examined the association between echocardiographic parameters and more robust end points such as overall mortality, and these studies suggested that AVA may be superior to VPeak or MG to predict this end point.8
Several studies reported that a significant proportion of patients may present with discrepancies among echocardiographic parameters with respect to the grading of AS severity: that is, MG<40 mm Hg but AVA<1 cm2.9–12 And as a consequence, some investigators proposed to lower the cut-point value (CPV) of AVA to define severe AS down to 0.8 cm2.11 ,12 In recent studies, a low flow state, defined as a LV stroke volume index (SVi) <35 mL/m2, is associated with worse outcomes in both patients with low LVEF (classical low flow) and those with preserved LVEF (paradoxical low flow).9 ,13–16
The main objective of this study was thus to determine which echocardiographic parameters and CPVs best predict clinical outcomes including the need for AVR, all-cause mortality and cardiovascular (CV) mortality in a large ‘real-life’ cohort of patients representative of the clinical spectrum of AS. We hypothesised that (i) echocardiographic parameters of stenosis severity are the most powerful predictors of valve-related events, whereas parameters of LV function are the most powerful predictors of mortality; (ii) the CPV (<1.0 cm2) of AVA proposed in the current guidelines to define severe AS and predict outcomes is appropriate; (iii) the CPV of LVEF proposed in the guidelines (<50%) to identify LV systolic dysfunction and recommend AVR is too low and (iv) the CPV (<35 mL/m2) of SVi proposed in the current guidelines to low flow AS and predict outcomes is appropriate.
Methods
Patient population
We retrospectively analysed the clinical and Doppler echocardiographic data that were prospectively collected in consecutive patients with at least mild AS (VPeak >2.0 m/s) who underwent an echocardiographic exam at the Québec Heart and Lung Institute between 1999 and 2007. Patients were excluded if they presented the following criteria: (i) ≥ moderate aortic regurgitation, (ii) ≥ moderate mitral stenosis or regurgitation, (iii) previous valve intervention or (iv) incomplete clinical and/or Doppler echocardiographic data. According to these criteria, 1065 patients were finally included in this study and the baseline clinical and echocardiographic data were prospectively collected but retrospectively queried. The follow-up time was calculated from the baseline echocardiography to the occurrence of event or last clinical follow-up. In total, 523 patients were included in some of our previous studies.13 ,17 However, the sample size, the duration of follow-up and the number of events are much higher and the focus is different in the present study versus in the previous ones.
Clinical data
Clinical data included age, gender, height, weight, body surface area, systolic and diastolic blood pressure and symptomatic status. Clinical comorbidities were documented by review of medical chart and included hypertension (patients receiving antihypertensive medications or having known but untreated hypertension (blood pressure ≥140/90 mm Hg), diabetes (patients receiving oral hypoglycaemic or insulin medications or, in the absence of such medications, having a fasting glucose ≥7 mmol/L), coronary artery disease (history of myocardial infarction, significant coronary artery stenosis (ie, >50%) on coronary angiography and/or regional wall motion abnormality on echocardiogram), atrial fibrillation, chronic obstructive pulmonary disease and renal failure (estimated glomerular filtration rate <60 mL/min/1.73 m2)).
Doppler echocardiographic data
All patients underwent a comprehensive Doppler echocardiographic exam with a commercially available ultrasound system. All Doppler echocardiographic exams were performed and analysed in the same laboratory by the same team of sonographers and cardiologists.
LVEF was calculated with the biplane Simpson method. Stroke volume was calculated by multiplying the LV outflow tract area by the flow velocity–time integral and was indexed to body surface area (SVi). The haemodynamic parameters of AS severity included (i) peak aortic jet velocity (VPeak), (ii) mean transvalvular pressure gradient (MG), (iii) AVA calculated by the standard continuity equation, (iv) AVA indexed to body surface area (AVAi), (v) energy loss index (ELI) as previously published18 and (vi) dimensionless velocity index (DVI).19 A multiwindow interrogation including apical five-chamber and three-chamber, right parasternal and suprasternal with standard and ped-off probes was systematically done. In patients with atrial fibrillation, measurements were calculated as the average of five cycles with least variation of R–R intervals and as close as possible to normal heart rate.19 The degree of aortic, mitral and tricuspid regurgitation was classified according to the recommendations of the European Association of Cardiovascular Imaging.20 The valvuloarterial impedance (Zva) was also calculated.17
Study end points
The study end points were the occurrence of (i) all-cause mortality, (ii) CV mortality, (iii) the composite end point of AVR or all-cause death, and (iv) AVR alone. The last update of the clinical events was obtained from Quebec National Institute of Statistics in January 2013.
Statistical analysis
Continuous data were expressed as mean±SD or median (IQR). The continuous variables were tested for normality of distribution and homogeneity of variances with the Shapiro–Wilk and Levene tests, respectively. Categorical data were expressed as percentage and compared with the χ2 test or Fischer's exact test when appropriate.
Kaplan–Meier curves and log-rank tests of the time-to-event data were used to assess the effect of the clinical and echocardiographic factors on outcomes. Multivariable Cox proportional hazard analyses were used to identify the independent association between these factors and outcomes. The proportional-hazards assumption was checked with the use of Schoenfeld residuals. Age, gender and the variables with a p value <0.10 in univariable analysis for the given end point were entered into the multivariable Cox models. To prevent collinearity, we avoided to include in the same model variables (ie, parameters of AS severity) that were strongly correlated. The impact of AVR on all-cause and CV mortality was analysed in multivariable Cox models with the use of AVR entered as a time-dependent variable.
Receiver operating characteristic (ROC) curve analyses were performed to determine the ability of the Doppler echocardiographic parameters (VPeak, MG, AVA, AVAi, ELI, DVI, Zva, SVi, LVEF) to discriminate between patients with and without events (area under the curve) as well as the CPVs providing the highest Youden index (sensitivity+specificity –1) to predict outcomes at 1-year follow-up. A p value <0.05 was considered statistically significant.
Results
Patient characteristics
The baseline characteristics of 1065 patients included in this study are presented in table 1. Among these patients, 53% (n=565) had severe AS, 34% had a low flow state, that is, SVi <35 mL/m2, and 17% had a LVEF <50% (table 1). The median follow-up in this cohort was 5.7 years (IQR 1.9–8.4). Among the 919 patients (86% of the whole cohort) with evaluation of symptomatic status, 77% presented symptoms (New York Heart Association (NYHA) class ≥2; table 1 and online supplementary table S1). Patients with symptoms had worse risk profile as well as more severe AS and lower LVEF and SVi at baseline compared with asymptomatic patients (see online supplementary table S1).
Supplemental material
Patients characteristics (n=1065)
Echocardiographic predictors of AVR and of the composite of AVR or death
During the follow-up, 584 patients underwent AVR (including 35 transcatheter AVRs) and 932 patients reached the composite end point of AVR or death (table 2). In univariable analysis, parameters of AS severity (ie, VPeak, MG, AVA, AVAi, ELI and DVI) were strongly associated with the occurrence of the composite end point of AVR or death (all p<0.001; table 2). Parameters of LV systolic function (ie, LVEF and SVi) and Zva were also associated with this end point (p≤0.03; table 2). After multivariable adjustment (table 2), MG (p<0.001) and LVEF (p=0.02) remained independently associated with the composite end point of AVR or death, whereas SVi did not (p=0.26). After the substitution of SVi and MG by Zva, the latter was an independent predictor of the composite end point of AVR or death (HR=1.24, 95% CI 1.16 to 1.32, p<0.001).
Predictors of the composite of aortic valve replacement (AVR) or death and AVR alone
The association between AS severity parameters and valve-related events was confirmed in several complementary analyses: (i) analysis in the whole cohort but with the use of AVR alone as the end point (all p<0.001; table 2); (ii) subanalysis in the subset of patients with severe AS (n=565; all p<0.001; see online supplementary table 2); (iii) analysis with further adjustment for symptomatic status (n=919; p<0.001; see online supplementary table 3) and (iv) inclusion of VPeak, AVA or AVAi, instead of MG in the multivariable models (all p<0.001; data not shown).
Predictors of all-cause and cardiovascular mortality
The best CPVs of the stenosis severity parameters to predict valve-related events at 1 year (n=394 composite end point of AVR or death and n=310 AVRs alone) were 3.5 m/s for VPeak (figure 1A) and 31 mm Hg for MG (figure 1B), whereas those for AVA, AVAi, ELI and DVI were 1.01 cm2 (figure 1C), 0.55 cm2/m2, 0.59 cm2/m2 and 0.27, respectively (see online supplementary table S4). Zva was also associated with these end points (p<0.001), and the best CPV was 4.4 mm Hg/mL m2 (see online supplementary table S4).

Event-free survival as a function of aortic stenosis severity parameters. This figure shows the event-free survival curves for the composite of aortic valve replacement or death. The groups are dichotomised according to cut-point values of peak aortic jet velocity (VPeak), mean gradient (MG) and aortic valve area (AVA) obtained by the receiver operating characteristic curve analyses and rounded to the nearest unit or decimal: VPeak ≥ vs <3.5 m/s (A); MG ≥ vs <30 mm Hg (B); AVA ≥ vs <1 cm2 (C). The numbers at the bottom of the graph represent the number of patients at risk at each follow time.
Echocardiographic predictors of all-cause and CV mortality
During the follow-up, 550 patients died and 398 of these deaths were of CV cause (table 3). Among these 550 deaths, 348 (63%) occurred before AVR and the remaining 202 (37%) after AVR. In univariable analysis, parameters of LV systolic function (ie, LVEF and SVi) were significantly associated with all-cause mortality (all p<0.001; table 3). Among parameters of AS severity, smaller AVA and lower VPeak and MG were significantly associated with increased risk of all-cause mortality (all p≤0.005; table 3). Zva was also associated with all-cause mortality (p<0.001). After multivariable adjustment (table 3), SVi (p=0.02) and LVEF (p<0.001) were independently associated with all-cause mortality, whereas MG or other parameter of stenosis severity was not (p=0.81). Further adjustment for AVR as a time-dependent variable provided similar results: that is, LV systolic function parameters (all p<0.05) remained powerful predictor of all-cause mortality and AVR was strongly associated with improved survival (HR=0.59, 95% CI 0.47 to 0.75, p<0.001). After the substitution of SVi and MG by Zva, the latter was an independent predictor of all-cause mortality (HR=1.10, 95% CI 1.00 to 1.20, p=0.045).
The association between LV systolic function parameters (ie, LVEF and SVi) and all-cause mortality was confirmed in several complementary analyses: (i) analysis with CV mortality as the end point (all p<0.05; table 3); (ii) subanalysis in the subset of patients with severe AS (n=565; all p≤0.03 except for SVi (trend: p=0.14) to predict CV mortality; see online supplementary table S5); (iii) subanalysis for mortality under medical treatment, that is, patients were censored at the time of AVR (all p<0.05 except for SVi (trend: p=0.13) to predict all-cause mortality; see online supplementary table S6); (iv) further adjustment for symptomatic status (n=919; all p≤0.03; see online supplementary table S7); (v) inclusion of VPeak, AVA or AVAi, instead of MG (all p≤0.03, data not shown); and (vi) further adjustment for EuroSCORE or tricuspid regurgitation grade ≥3 (all p<0.05, data not shown).
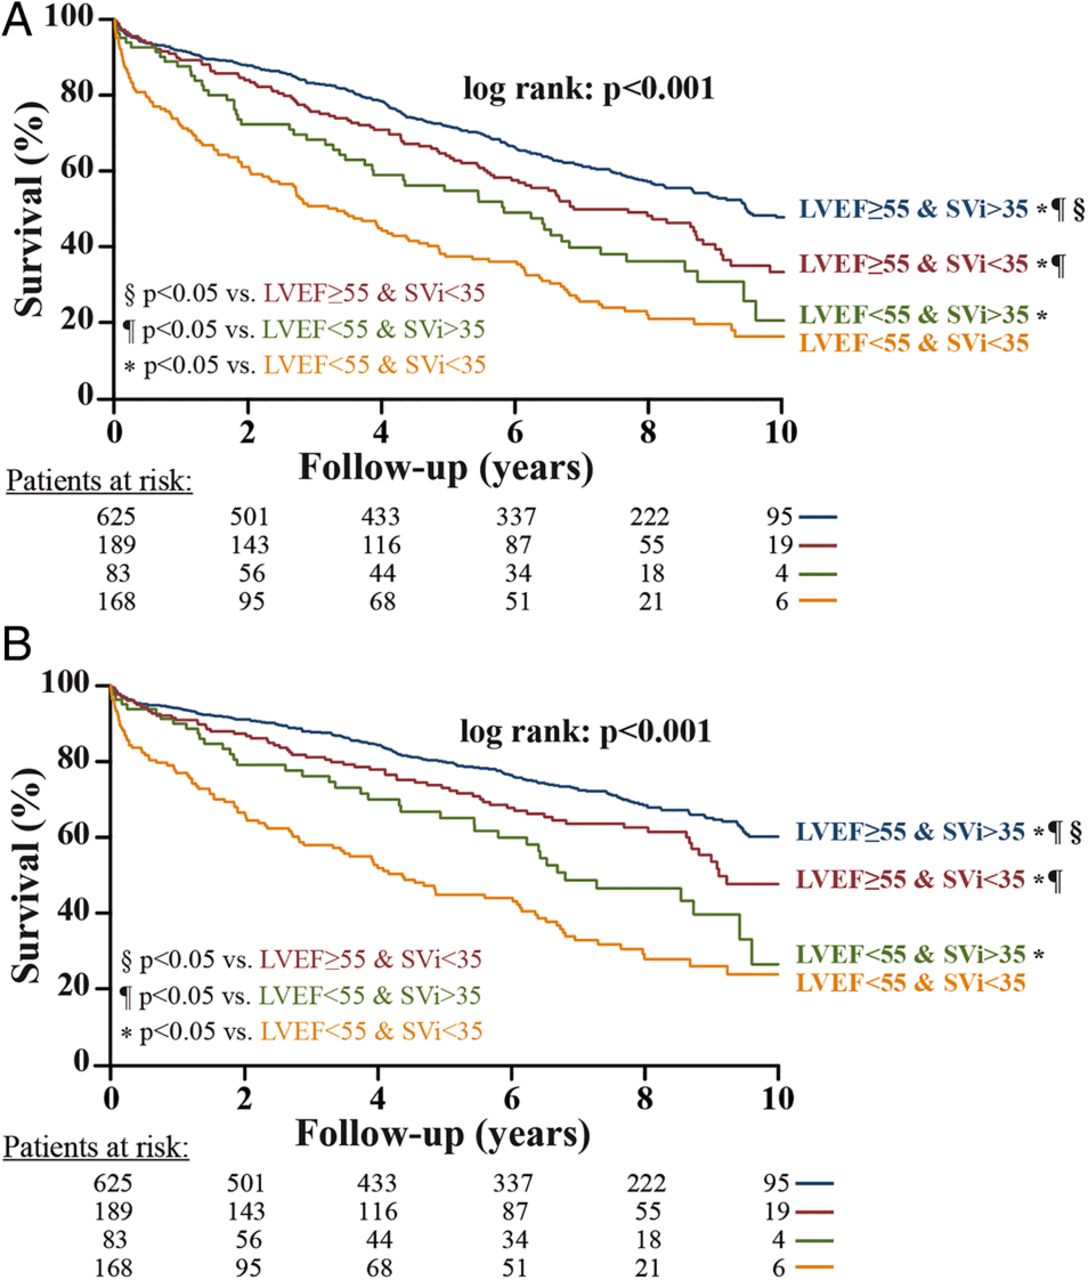
The best CPVs of the parameters of LV systolic/pump function to predict all-cause mortality at 1 year (n=114 deaths) were 56% for LVEF and 34 mL/m2 for SVi (see online supplementary table S4). The best CPV for AVA was 1.01 cm2. Analysis of CV mortality provided similar results (see online supplementary table S4). Using the best CPV identified by ROC curve analyses, patients with SVi <35 mL/m2 had significantly higher risk of all-cause mortality and CV mortality compared with patients with SVi >35 mL/m2, in both patients with LVEF <55% and those with LVEF ≥55% (p<0.001; figure 2A, B).

Overall and cardiovascular survival as a function of left ventricular ejection fraction (LVEF) and stroke volume index (SVi). This figure shows the survival curves for all-cause mortality (A) and cardiovascular mortality (B). The groups are dichotomised according to the cut-point values of LVEF and SVi obtained by the receiver operating characteristic curve analyses and rounded to the nearest unit or decimal: LVEF ≥ vs <55% and SVi > vs <35 mL/m2. The symbols indicate the significant differences between groups: *p<0.05 vs ‘LVEF<55% and SVi <35 mL/m2’; ¶p<0.05 vs ‘LVEF<55% and SVi >35 mL/m2’; §p<0.05 vs ‘LVEF ≥55% and SVi <35 mL/m2’. The numbers at the bottom of the graph represent the number of patients at risk at each follow time.
Predictors of outcomes in the subset of patients with asymptomatic AS
During the median follow-up of 7.4 years (IQR 4.2–9.2), 119 patients of the 212 who were asymptomatic at baseline (ie, defined as NYHA class I) underwent AVR and 175 reached the composite end point of AVR or death (see online supplementary table S8). In multivariable analysis, MG (all p<0.001) remained the most powerful echocardiographic predictor of these outcomes (see online supplementary table S8).
Moreover, during the follow-up, 81 of the 212 patients being asymptomatic at baseline (ie, define as NYHA class I) died and 57 of these deaths were of CV cause (see online supplementary table S9). In multivariable analysis, SVi remained independently associated with all-cause mortality (p=0.004), whereas LVEF was not (p=0.56) (see online supplementary table S9). After the substitution of SVi and MG by Zva, the latter was an independent predictor of all-cause mortality (HR=1.46, 95% CI 1.07 to 2.01, p=0.02). The results of the multivariable analysis of CV death or mortality under medical treatment in this subset of asymptomatic patients provided similar results (see online supplementary tables S9 and S10).
Clinical comorbidities independently associated with all-cause mortality
Hypertension, diabetes, coronary artery disease, chronic obstructive pulmonary disease and renal failure were all significantly (p<0.001) associated with all-cause mortality in univariable analysis (see online supplementary figure and table 3). After multivariable adjustment, hypertension, diabetes, chronic obstructive pulmonary disease and renal failure were independently associated with all-cause mortality, whereas coronary artery disease was not (see online supplementary figure and table 3).
Discussion
The main findings of this study are (i) the Doppler echocardiographic parameters of stenosis severity are the most powerful predictors of the occurrence of AVR and the optimal CPVs to predict this valve-related event are lower than the criteria proposed in the guidelines for VPeak and MG and similar to the guidelines' criteria for AVA; (ii) Doppler echocardiographic parameters of LV systolic/pump function, that is, low LVEF and low SVi, are the most powerful independent echocardiographic predictors of all-cause and CV mortality in patients with AS and the best CPVs to predict mortality are ∼55% for LVEF and ∼35 mL/m2 for SVi; (iii) in asymptomatic patients (ie, defined as NYHA class I), lower SVi is the most powerful echocardiographic predictor of mortality; and (iv) hypertension, diabetes, chronic obstructive pulmonary disease and renal failure, are also associated with reduced survival in the AS population.
Doppler echocardiographic parameters for grading AS severity and predicting AVR
The AS severity criteria proposed in the guidelines are inherently inconsistent with one another. Indeed, in a patient with normal transvalvular flow rate, the MG that theoretically corresponds to an AVA value of 1.0 cm2 is closer to 30 mm Hg rather than to the 40 mm Hg CPV presented in the guidelines.10–12 In light of these findings, some investigators have proposed to maintain the same CPV for the MG but to lower down the CPV of AVA for severe AS from 1.0 to 0.8 cm2.12 ,21 However, the results of the present study would rather support to keep the current criteria for AVA. Indeed, the optimal CPVs of AVA (∼1.0 cm2) and indexed AVA (∼0.55 cm2/m2) identified in this study to predict outcomes are very close to those proposed in the guidelines,1 ,2 whereas those of MG (∼30 mm Hg) and VPeak (∼3.5 m/s) are lower than the guidelines criteria (40 mm Hg and 4 m/s, respectively) (see online supplementary table S4). Hence, in light of the findings of this study, the best approach is probably to maintain the status quo with respect to the guidelines' CPVs of echocardiographic parameters and use an MG ≥40 mm Hg (or VPeak≥4.0 m/s) as a specific marker and an AVA ≤1.0 cm2 as a sensitive marker of severe stenosis (see online supplementary table S4).
If the MG is ≥40 mm Hg (or VPeak >4 m/s), the stenosis is likely severe and, in presence of symptoms, AVR is recommended (class I indication).1 ,2 In these patients, it is generally not necessary to consider other parameters of stenosis severity. Nonetheless, in patients with a small ascending aorta, significant pressure recovery may occur downstream of the valve and, in such case, the MG and AVA may overestimate the stenosis severity. The calculation of the ELI may be helpful in these patients, and according to the results of this study, a value >0.6 cm2/m2 (see online supplementary table S4) would indicate non-severe stenosis and good outcomes despite the presence of small AVA and high MG.
If the MG is <40 mm Hg and the AVA is >1.0 cm2, the stenosis is moderate and there is no indication for AVR unless the patient undergoes another cardiac surgery.1 ,2 In patients with MG <40 mm Hg and AVA ≤1.0 cm2 (ie, discordant grading) who claim to be asymptomatic or who have ambiguous symptoms, exercise testing or exercise stress echocardiography are helpful to confirm symptomatic status and corroborate stenosis severity.1 ,2 ,19 In patients with discordant grading and symptoms, other diagnostic tests including low-dose dobutamine stress echocardiography, and aortic valve calcium scoring by CT should be performed to confirm the stenosis severity and thus the indication of AVR.9 ,22–25
Asymptomatic AS is often considered a benign entity. However, in the present study, the valve event and overall mortality rates were 56% and 38%, respectively, over a median follow-up of 7 years, which is consistent with what was reported in previous studies.6 ,26 ,27 This relatively poor outcome may be explained by several factors: (i) patients with AS are often older and frequently have comorbidities (table 1); (ii) the stenosis may progress rapidly in an important proportion of patients and (iii) symptoms may be under-reported by the patient and/or underestimated by the physician, particularly if only a resting evaluation is used.24 ,25 ,28
Doppler echocardiographic parameters for predicting mortality
The main goal of therapeutic management in AS is to improve longevity and quality of life, and therefore, mortality is likely the most robust and clinically relevant end point.29 Patients with advanced stage of the disease may have irreversible myocardial fibrosis/dysfunction and may thus portend increased risk of mortality despite the realisation of AVR. Furthermore, the AVR procedure per se as well as the prosthetic valve may cause several potentially life-threatening complications. An analysis including all deaths regardless of the timing of AVR is thus necessary to determine the global mortality burden associated with AS. Previous studies have generally used the composite of AVR or death as the primary and often the sole end point and, when such is the case, this composite end point was, in very large part, driven by AVR.3–7 ,12 Accordingly, AVR accounted for 63% of this composite end point in the present study. The main limitation of this end point is that, as opposed to death, the occurrence of AVR is, in large part, determined by the clinician's perception of disease severity, which is, in turn, highly influenced by the magnitude of MG or VPeak as well as the presence of symptoms, LV systolic dysfunction (ie, LVEF<50%) or high-risk profile (EuroSCORE>20%). Hence, it is not surprising that these Doppler echocardiographic parameters were found to be the most powerful independent predictors of the composite of AVR or death in this study (ie, they are the reasons why the cardiologist refers the patient to AVR). On the other hand, there was no independent association between MG or VPeak and all-cause or CV mortality in the whole cohort. Higher MG or VPeak was nonetheless associated with increased mortality in the subset of patients treated medically but not in the subset of patients who underwent AVR. These findings further support the concept that AVR is an effective treatment for AS, and this intervention dramatically changes the natural history of the disease. It is reassuring to see that in a contemporary ‘real-life’ series of patients with optimised management there is no death penalty associated with severe AS. The Doppler echocardiographic parameters independently associated with mortality were those of LV systolic/pump function: that is, LVEF and SVi. Furthermore, the best CPV for LVEF to predict 1-year mortality was ∼55%, which is higher than the CPV proposed in the guidelines (<50%) to identify the presence of LV systolic dysfunction and recommend AVR in symptomatic severe AS patients (class I). This finding may be explained by the fact that LVEF substantially underestimates the degree of myocardial systolic dysfunction in the presence of LV concentric remodelling as is often the case in patients with AS.30–33 Previous studies reported that about one-third of patients with severe AS and LVEF ≥50% have evidence of LV systolic dysfunction as documented by reduced LV longitudinal or mid-wall shortening.34–37 The results of the present study suggest that the CPV of LVEF proposed in the guidelines to identify LV systolic dysfunction, and thus trigger AVR in patients with severe AS could be raised from 50% to 55%. Another important finding of this study is that SVi provides important incremental prognostic value in both patients with preserved LVEF and those with reduced LVEF. Several studies including a recent meta-analysis have reported that low flow, that is, reduced SVi, is associated with worse prognosis in patients with preserved LVEF.13–16 ,38–42 The present study also shows that SVi is a powerful predictor of mortality among patients with reduced LVEF. The primary function of the heart is to pump blood into the systemic circulation and it thus appears logical to use the SVi as the key parameter to measure the efficiency of the LV pump. Furthermore, this parameter is routinely measured in the echocardiography or catheterisation laboratories for the calculation of cardiac output and AVA and it is thus easily available. The results of the present study further validate the cut-point of 35 mL/m2 proposed by Hachicha et al13 and recently reported by the guidelines1 ,2 to define low flow and predict adverse outcomes in AS.
The contemporary AS population is composed predominantly of elderly people with frequent comorbidities (hypertension, coronary artery disease, diabetes, atrial fibrillation) that may, besides AS, all contribute to decrease LV outflow.13 ,15 ,39 ,41 Hence, as reported in previous studies,11 ,13 ,40 ,43 it is not surprising that a large proportion of patients with AS have reduced SVi (34% in the present study) and given that MG and VPeak are highly flow dependent, these parameters may result in underestimation of stenosis severity and risk of events. This further emphasises the importance of (i) considering both LVEF and SVi in the risk stratification process of patients with AS and (ii) not relying only on MG and VPeak to grade AS severity. Furthermore, even if low LVEF and low SVi may be used to identify patients with AS being at higher risk for cardiac events, the identification of the underlying cause(s) of impaired LV systolic/pump function may help to adjust therapeutic management.
Study limitations
The main limitation of the present work is that the data were prospectively collected but retrospectively queried. Hence, this study has the inherent limitation of a retrospective analysis. However, the fact that we included a large series of consecutive patients examined at the clinical Echocardiography Laboratory and that the mortality data were obtained from the Quebec National Institute of Statistics limited the selection and follow-up biases.
The present study confirms the usefulness of SVi and AVA measured by Doppler echocardiography to predict outcomes in patients with AS. However, these parameters are subject to measurement errors and a multimodality, multiparametric integrative approach should be used to corroborate these measurements. However, special attention should be taken when using hybrid method, such as CT-echo hybrid method, to determine AS severity: as recently reported, CPV of AVA to predict mortality was 1 cm2 when derived from echocardiography but 1.2 cm2 when derived from CT-echo hybrid method.44 This raises the need of identification and validation of specific CPV values to predict outcomes for every imaging modalities.
Even if the complementary analyses in specific subsets of patients provided consistent results with those in the whole cohort, some of these subanalyses may be underpowered. Moreover, the multiple analyses performed in this study may increase the risk of type I error. These findings will thus need to be further validated in larger studies.
The data of the extent of coronary artery disease, myocardial strain or wall motion abnormalities, as well as dobutamine stress echocardiography were not available in this cohort. Moreover, the complete list of medications has not been collected.
Conclusion
The Doppler echocardiographic parameters of stenosis severity, that is, MG, VPeak and AVA, are the most powerful predictors of the need for AVR. However, the optimal CPVs to predict this event are lower than the criteria proposed in the guidelines for VPeak and MG, whereas they are similar for AVA. These findings thus support the status quo for the CPV of AVA (≤1.0 cm2) to identify severe AS. The most powerful predictors of all-cause and CV mortality are parameters of LV systolic/pump function: that is, LVEF and SVi. However, the results of this study suggest that the CPV of LVEF to identify LV systolic dysfunction and trigger AVR in AS may be raised from 50% to 55%. This finding will need to be confirmed by further studies. The presence of low flow, defined as SVi <35 mL/m2, should be systematically integrated, complementary to LVEF, in the risk stratification of both asymptomatic and symptomatic patients with AS.
Key messages
What is already known on this subject?
A significant proportion of patients with aortic stenosis (AS) may present with discrepancies among echocardiographic parameters for the grading of stenosis severity: that is, mean gradient <40 mm Hg but aortic valve area (AVA) <1 cm2. Some investigators thus proposed to lower the severity cut-point value of AVA down to 0.8 cm2. Left ventricular ejection fraction (LVEF) <50% is the parameter proposed in the guidelines to define LV systolic dysfunction and recommend aortic valve replacement in AS. However, this parameter may lack sensitivity.
What might this study add?
This study confirms that the optimal cut-point value of AVA to define severe AS is <1.0 cm2 and does not support the lowering to 0.8 cm2. The most powerful echocardiographic predictors of mortality were the presence of low LV outflow defined as a stroke volume index <35 mL/m2 and low LVEF (<55%).
How might this impact on clinical practice?
The findings of this study support (i) the status quo regarding the guidelines' criteria for severe AS: a mean gradient ≥40 mm Hg and AVA ≤1.0 cm2 may be used as a specific and sensitive marker of stenosis severity, respectively; (ii) the raise of the cut-point value of LVEF to identify LV systolic dysfunction in AS from 50% to 55% and (iii) the systematic integration of stroke volume index in the risk stratification of AS.
Acknowledgments
The authors thank Isabelle Fortin, Jocelyn Beauchemin, Martine Poulin and Martine Parent for their help in data collection and management.
References
Footnotes
Contributors RC and PP designed the study and prepared the manuscript. RC, FLV and M-AC collected data. RC, FLV, M-AC, JGD, AD, CT, MA, KOC, EB, JB, MS and MB contributed to the analysis of echocardiographic measures and interpretation of the data. RC performed statistical analyses and wrote the first draft of the manuscript. PP supervised the acquisition and analyses of echocardiographic images. All authors reviewed the manuscript and contributed to scientific content. PP validated the final version and are responsible for the overall content.
Funding This work was supported by grant MOP-114997 from Canadian Institutes of Health Research (CIHR), Ottawa, Ontario, Canada, and a grant from the Foundation of the Québec Heart and Lung Institute. RC was supported by a post-doctoral fellowship grant from CIHR. FLV and CT were supported by a clinical and research fellowship grant from Fédération Française de Cardiologie. M-AC was supported by a post-doctoral fellowship grant from CIHR. AD was supported by a fellowship grant from L'Agence de la santé et des services sociaux de la Capitale Nationale, Québec, Québec, Canada. MA is research scholars from ‘Fond de Recherche en Santé du Québec (FRSQ), Montreal, Québec, Canada. PP holds the Canada Research Chair in Valvular Heart Diseases from CIHR, Ottawa, Ontario, Canada.
Competing interests None.
Patient consent Written informed consent was waived for this retrospective analysis.
Ethics approval The study was approved by the Ethics Committee of the Quebec Heart and Lung Institute.
Provenance and peer review Not commissioned; externally peer reviewed.