Article Text

Abstract
Objective To assess the associations between ambient temperatures and hospitalisations for coronary heart disease (CHD) and stroke.
Methods Our study comprised all residents living in Ontario, Canada, 1996–2013. For each of 14 health regions, we fitted a distributed lag non-linear model to estimate the cold and heat effects on hospitalisations from CHD, acute myocardial infarction (AMI), stroke and ischaemic stroke, respectively. These effects were pooled using a multivariate meta-analysis. We computed attributable hospitalisations for cold and heat, defined as temperatures above and below the optimum temperature (corresponding to the temperature of minimum morbidity) and for moderate and extreme temperatures, defined using cut-offs at the 2.5th and 97.5th temperature percentiles.
Results Between 1996 and 2013, we identified 1.4 million hospitalisations from CHD and 355 837 from stroke across Ontario. On cold days with temperature corresponding to the 1st percentile of temperature distribution, we found a 9% increase in daily hospitalisations for CHD (95% CI 1% to 16%), 29% increase for AMI (95% CI 15% to 45%) and 11% increase for stroke (95% CI 1% to 22%) relative to days with an optimal temperature. High temperatures (the 99th percentile) also increased CHD hospitalisations by 6% (95% CI 1% to 11%) relative to the optimal temperature. These estimates translate into 2.49% of CHD hospitalisations attributable to cold and 1.20% from heat. Additionally, 1.71% of stroke hospitalisations were attributable to cold. Importantly, moderate temperatures, rather than extreme temperatures, yielded the most of the cardiovascular burdens from temperatures.
Conclusions Ambient temperatures, especially in moderate ranges, may be an important risk factor for cardiovascular-related hospitalisations.
- stroke
- epidemiology
- heart disease
This is an Open Access article distributed in accordance with the Creative Commons Attribution Non Commercial (CC BY-NC 4.0) license, which permits others to distribute, remix, adapt, build upon this work non-commercially, and license their derivative works on different terms, provided the original work is properly cited and the use is non-commercial. See: http://creativecommons.org/licenses/by-nc/4.0/
Statistics from Altmetric.com
Introduction
There is unequivocal evidence that short-term exposure to low and high ambient temperatures increases cardiovascular mortality.1 There are also growing experimental studies showing that exposure to ambient temperature, especially cold, induces the change in blood pressure, vasoconstriction and increases blood viscosity and plasma fibrinogen, which can potentially lead to adverse cardiovascular events.2 3 However, epidemiological research quantifying the temperature-related burden of cardiovascular morbidity, especially major cardiovascular diseases (ie, coronary heart disease (CHD) and stroke), is sparse.4 Even less is known who are most susceptible for cardiovascular-related hospital admissions on cold and hot days.
The relationship of temperatures with cardiovascular-related mortality and morbidity has been investigated in several previous studies that predominantly focused on extreme temperatures (eg, cold spells and heat waves).1 4 Recently, a large study involving 13 countries reported that temperatures in a moderate range were responsible for far more deaths than were extreme cold and heat.5 However, whether exposure to moderate temperatures also contributes to more cardiovascular morbidity than extremes remains unknown. This is particularly relevant given the enormous burden of cardiovascular morbidity on public health.
Heart disease and stroke affect ~27.6 million people in the USA.6 In Canada, an estimated 1.6 million individuals are living with heart disease or long-term stroke disability.7 Considering the high prevalence of these conditions and that climate change is increasing variability of both low and high temperatures,8 we conducted a population-based study to estimate the associations between temperatures and hospitalisations for CHD and stroke in Ontario, Canada. Additionally, we quantified the burden of hospitalisations from CHD and stroke attributable to cold and heat, separated into moderate and extreme ranges.
Methods
Study population and outcomes
The study population comprised all Ontario residents who were admitted to a hospital in Ontario from 1 January 1996 to 31 December 2013 with a primary or most responsible diagnosis of CHD, acute myocardial infarction (AMI), stroke or ischaemic stroke (International Classification of Diseases 9th and 10th diagnosis codes are listed in online supplementary table S1). We obtained the hospitalisation data from the Hospital Discharge Abstract Database of the Canadian Institute of Health Information.9 Ontario, the most populous province in Canada, has a publicly funded universal medicare system for hospital, laboratory and physician services that covers virtually the entire population (~13 million people).9
Supplementary file 1
The healthcare system of Ontario is organised into 14 health regions (known as Local Health Integration Networks) that are responsible for planning, integrating and funding various local healthcare services. We obtained daily number of hospitalisations for the four selected outcomes in each health region, using information from the Registered Persons Database, a registry of all Ontario residents who have ever had a valid health card. Data linkage was performed through individuals’ unique encrypted health card numbers.
The Research Ethics Board of the University of Toronto approved the study (protocol reference 28527).
Temperature data
We obtained hourly air temperatures (°C) during the study period at 125 monitoring stations across Ontario from Environment Canada (online supplementary table S2).10 We calculated daily mean, maximum and minimum temperature for each weather station, and then averaged daily data across all weather stations within each region. We a priori selected mean temperature as the primary exposure, as it captures temperature exposure throughout the entire day and night.11
Potential confounders and effect modifiers
We obtained hourly measurements of relative humidity and major air pollutants including nitrogen dioxide (NO2), ozone (O3) and fine particulate matter (<2.5 µm in aerodynamic diameter (PM2.5)) from all monitoring stations across Ontario during the study period, from which we derived daily average estimates of these measures for each health region. Because of substantial missingness before 2003, we were unable to include PM2.5 in main analysis but considered it in a sensitivity analysis. We also derived the daily number of physician office visits due to influenza in each health region using data from the Ontario Health Insurance Plan Claims Database. Furthermore, we created indicator variables for holidays and the day of week.
To identify potential factors that may increase individual’s susceptibility to the effect of temperature on cardiovascular hospitalisations, we obtained information on age, sex, whether a patient was hospitalised for CHD or stroke for the first time or not, selected comorbid conditions (ie, AMI, cardiac dysrhythmias, congestive heart diseases, diabetes and hypertensive diseases) and medication use (ie, statin, anticoagulants, all types of antihypertensive drugs, ACE inhibitors and beta blockers) (see online supplementary materials).
Statistical analysis
To estimate the associations between daily mean temperatures and hospitalisations, we conducted a two-stage analysis. In the first stage, we used the distributed lag non-linear model combined with a quasi-Poisson regression to examine the non-linear and lag effects of mean temperature on hospitalisation in each health region.12 This analysis was conducted for each condition separately. In all models, we controlled for relative humidity, NO2, O3, a day-of-week indicator, holiday status, daily influenza visits, as well as seasonality and long-term trends using a natural cubic spline with 7 df per year for time.13 To characterise the temperature–hospitalisation relationship, we used natural cubic spline for temperature (with 4 df, including three internal knots at the 10th, 50th and 90th percentiles of region-specific temperatures) and natural cubic for lags (3 df).5 This choice of model specification resulted in a better fit than the other model forms that we also examined, according to Akaike’s Information Criterion for quasi-Poisson (online supplementary table S3). To fully capture the overall temperature effects and adjust for a possible harvesting effect, we used a 21-day lag in all models.5
In the second stage of the analyses, we pooled the region-level estimates using a multivariate meta-analysis to derive a summary estimate across Ontario.14 Similar to previous studies,5 we identified the temperature corresponding to the lowest risk at the pooled temperature–hospitalisation curve as the optimal temperature and the reference value.5 We then obtained estimates for the cold and heat effects on CHD and stroke hospitalisations (see online supplementary materials).
To examine the robustness of our effect estimates, we conducted a series of sensitivity analyses including changing the df for temperature from 4 to 5 and the internal knot for lag from 1 to 2 and reducing the lag period from 21 days to 14 days. We also adjusted daily concentration of PM2.5 in a subset of the population.
Additionally, we examined whether a subpopulation may be more susceptible for hospitalisations from CHD and stroke due to heat and cold exposure by conducting subgroup analyses by age (<65 vs ≥65 years), sex, first-time hospitalisations or not, any history of selected comorbidities and the intake of selected medications. We assessed the statistical significance of effect modification by testing whether the interaction between temperature and selected individual characteristics was statistically significant.
Furthermore, we estimated fractions and numbers of hospitalisations for CHD and stroke attributable to cold and heat, defined as temperatures above and below the optimum temperature and for moderate and extreme temperatures, defined using cut-offs at the 2.5th and 97.5th temperature percentiles5 (see online supplementary figure S1 and table S2 for these definitions and the actual temperature ranges corresponding to extreme/moderate temperatures in each health region).
Statistical analyses were conducted using the R software (V.3.0.3) with the ‘dlnm’ and ‘mvmeta’ packages.
Results
Study population
Between 1996 and 2013, we identified a total of 1 389 057 CHD hospitalisations CHD, of which 443 447 (31.9%) were from AMI and 355 837 from stroke admissions, of which 237 979 (66.9%) from ischaemic stroke across Ontario, Canada (table 1). During the study period, the minimum and maximum daily mean temperatures across health regions in Ontario ranged from −33.1°C to 32.2°C (online supple mentary tab le S2). The mean temperatures in Ontario varied with season (see online suppleme ntary figure S2 for the full data series for mean temperatures).
Descriptive statistics of study population in Ontario, Canada, 1996–2013
Association between temperature and hospitalisation
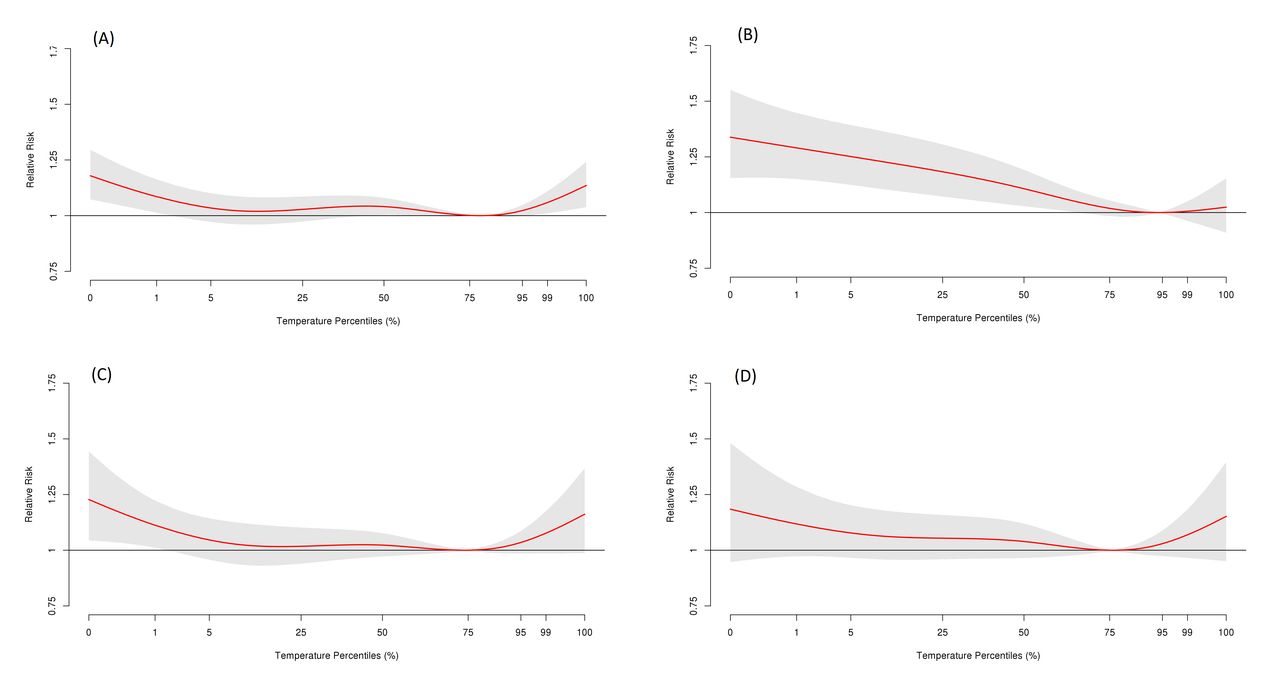
Figure 1 shows overall cumulative exposure–response relationships between daily hospitalisations for the four conditions and mean temperatures across a 21-day lag period in Ontario. For CHD, stroke and ischaemic stroke, we observed U-shaped associations with temperatures, with higher risks of hospitalisations at both extreme low and high temperatures. For AMI, there was a reverse J-shaped relationship, with a greater effect at low temperatures. We note that the optimal temperature for AMI (at the 94th percentile) was somewhat higher than those for CHD (79th), stroke (74th) and ischaemic stroke (76th) (table 2). We observed that the exposure–response relationship exhibited similar patterns across the 14 health regions (see online supplementary figure S3 and S4 for exposure–response curves in four selected health regions).

Cumulative exposure–response associations of daily mean temperatures and hospitalisations for (A) coronary heart disease, (B) acute myocardial infraction, (C) stroke and (D) ischaemic stroke over a lag of 21 days in Ontario, Canada, 1996–2013. These associations were pooled across estimates in 14 health regions.
Cumulative relative risks (RRs) and 95% CIs for cold and heat effects on daily hospitalisations for coronary heart disease (CHD), acute myocardial infarction (AMI), stroke and ischaemic stroke over a lag of 21 days in Ontario, Canada, 1996–2013
Compared with days with the optimal temperature, cold days with temperature corresponding to the 1st percentile of temperatures were associated with significant increases in hospitalisations from CHD (relative risk (RR): 1.09; 95% CI 1.01 to 1.16), AMI (RR: 1.29; 95% CI 1.15 to 1.45) and stroke (RR: 1.11; 95% CI 1.01 to 1.22) (table 2). These effects remained elevated even comparing with the days with temperature corresponding to the 25th percentile of temperatures. For ischaemic stroke, we found a positive (although non-significant) association with cold temperatures. In contrast, hot daily temperatures (the 99th percentile) was associated with a 6% (95% CI 1% to 11%) increase in hospitalisations for CHD compared with either the optimal temperature or the 75th percentile of temperature. Hot temperatures were also positively associated with hospitalisations from stroke (RR: 1.08; 95% CI 0.99 to 1.17) and ischaemic stroke (RR: 1.12; 95% CI 0.97 to 1.18). There was little evidence linking heat to AMI.
Temperature-related burden of hospitalisations
Cold temperatures were estimated to put forward 2.49% (95% CI 1.03% to 3.67%) of hospitalisations from CHD (or 34 456 admissions), while heat exposure gave rise to 1.20% (95% CI 0.22% to 2.14%) CHD admissions (or 16 628) (table 3). For stroke, cold temperatures were contributed to 1.71% (95% CI 0.77% to 2.64%) of hospitalisations (or 6051 admissions) and hot temperatures contributed to 1.82% (95% CI 0.06% to 3.21%) of hospitalisations (or 6469 admissions).
Estimated attributable fractions (%), attributable numbers and 95% CIs for cumulative cold and heat effects on daily hospitalisations for coronary heart disease (CHD) and stroke over a lag of 21 days in Ontario, Canada, 1996–2013
Further separating the burden into components related to moderate and extreme temperatures, we found that most of the hospitalisations for CHD and stroke were attributed to cold and hot temperature in the moderate ranges. Conversely, extreme cold and hot temperatures were attributable to a small fraction of the burden of these hospitalisations (ranging from 0.16% to 0.29%, depending on the outcomes).
Stratified and sensitivity analyses
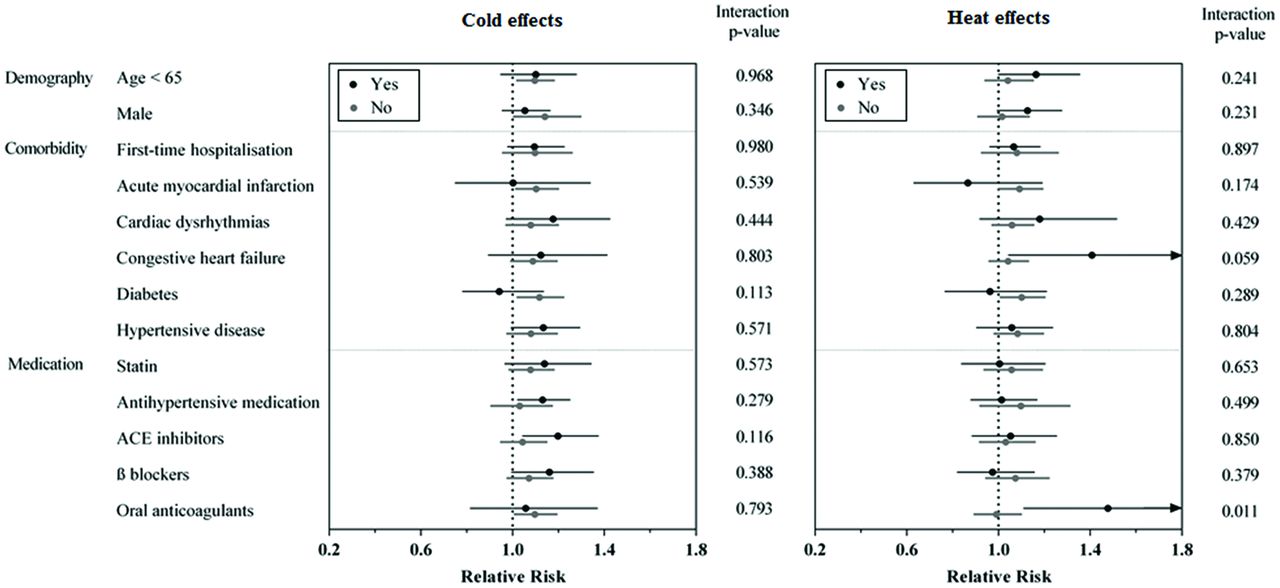
We found that elderly people who regularly took oral anticoagulants had a 48% higher risk for stroke admissions on hot days (95% CI 1.11 to 1.97) than non-users (RR: 0.99, 95% CI 0.89 to 1.10) (p interaction =0.01) (figures 2 and 3).

Cumulative cold and heat effects on hospitalisations for coronary heart disease by selected individual characteristics over 21 lag days in Ontario, Canada, 1996–2013. Cold and heat effects were examined by calculating relative risks associated with the 1st percentile of temperature relative to the 25th percentile and the 99th percentile relative to the 75th percentile, respectively. The subgroup analyses of medication intake were restricted to subjects aged 65 years and over.

Cumulative cold and heat effects on hospitalisations for stroke by selected individual characteristics over 21 lag days in Ontario, Canada, 1996–2013. Cold and heat effects were examined by calculating relative risks associated with the 1st percentile of temperature relative to the 25th percentile and the 99th percentile relative to the 75th percentile, respectively. The subgroup analyses of medication intake were restricted to subjects aged 65 years and over.
Sensitivity analyses showed that our estimates were robust to the change of df for temperature from 4 to 5 and the change of the internal knot for lag from 1 to 2 (online supplementary table S4). Cumulative exposure–response associations over a lag of 14 days exhibited similar patterns but somewhat attenuated estimates of both cold and heat effects as compared with those over a lag of 21 days (online supplementary figure S5). Further adjusting for PM2.5 in a subpopulation with complete pollution data did not materially change the estimates (online supplementary table S5).
Discussion
In this large population-based cohort in Ontario, we found that short-term exposure to cold temperatures significantly increased the daily rates of hospitalisations for CHD, AMI and stroke. High temperatures were associated to a lesser degree with the hospitalisations for these conditions. Overall, we estimated that ~3.7% of CHD hospitalisations (51 084 admissions) and 3.5% of stroke hospitalisations (12 520 admissions) in this population were brought forward by temperature exposures, which would be associated with approximately C$40 million medical costs per year (see online supplementary material). Importantly, most of these hospitalisations were attributable to moderate temperatures, rather than temperature extremes. To our knowledge, this is the first study that reported the significant cardiovascular burden from both low and high temperatures.
We found increased risks of CHD hospitalisations with both cold and hot temperatures in Ontario. This finding is supported by a handful of previous studies conducted in regions with different climate conditions (eg, the USA,15 16 Hong Kong,17 Australia18 and Spain18) that reported either the cold17 18 or heat15 16 effects on CHD morbidity. Similarly, we observed tendency towards increasing stroke-related hospitalisations in response to both low and high temperatures. Few studies so far have assessed both cold and heat effects on stroke morbidity.19 Our findings may have important implications. First, climate change will bring more hot days and likely intensify the effects of the jet stream’s position, causing more severe cold winters.8 Our results indicate that temperature-related cardiovascular hospitalisations could persist under future climate change scenarios unless preventive efforts are made. It would be beneficial to expand public education and awareness campaigns on reducing traditional lifestyle-related risk factors to further consider environmental factors, such as low and high temperatures. Second, because approximately 62% CHD admissions and 27% stroke admissions were recurrent hospitalisations in this study, inpatient education regarding preventive behavioural change on cold/hot days (eg, maintaining optimal indoor temperatures and wearing proper clothes)20 could be an asset in reducing temperature-related readmissions and related healthcare costs. Third, we found that risks of hospitalisations for CHD and stroke could remain elevated for 21 days after exposure to cold/heat, indicating that there is an opportunity to implement interventions and clinical treatments during this critical time window.
We found heightened risk for AMI hospitalisation in association with cold but not high temperatures, which is consistent with a handful of previous studies suggesting that increased risk for AMI may be exclusively associated with cold temperature.21–23 This variation may be due to different physiological processes of different cardiovascular conditions in response to cold and heat. This finding indicates the importance of understanding the specificity of temperature-related health effects, which may facilitate better targeting of health resources and interventions.
To date, most studies examining the health effects of high and low temperatures have focused on the effects of extreme temperatures,4 with less attention to evaluate the impact of moderate temperatures. However, in a recent multicountry study involving more than 74 million deaths, Gasparrini and colleagues reported that in all 13 study countries, most of the temperature-related mortality burden was attributable to moderate temperatures (with an overall estimate of 6.8%) rather than extreme temperatures (0.9%), although the optimum temperature varied from the 60th percentile in tropical countries to about the 90th percentile in cold regions.5 Our study extends the mortality study by further showing that moderate temperatures posed a greater impact on increasing the burden of cardiovascular hospitalisations than that from extreme temperatures. Taken together, these observations suggest that the variations in temperatures play a major role in temperature-related health risk and that our study results can be highly relevant to regions of the world with different weather and temperature variation. An important implication of these findings is that clinical and public health interventions aiming to reduce adverse cardiovascular events due to exposure to extreme weather could benefit from further considering the whole range of temperature effects in both moderate and extreme ranges.
We observed that the elderly who regularly took oral anticoagulants exhibited a significantly increased risk for stroke admissions on hot days than non-users. While oral anticoagulants (eg, heparin and warfarin) have been widely used to eliminate or reduce the risk of blood clots, this type of medication can also cause bleeding problems, which may result in an elevated risk of haemorrhagic stroke caused by a burst or bleeding blood vessel.24 This finding underscores the importance for clinicians and public health professionals to consider potential susceptibility factors for the temperature–health effect when preventing and treating major cardiovascular diseases.
There are several biological mechanisms through which exposure to ambient temperatures can affect the cardiovascular system. Cold exposure are known to increase in blood pressure, heart rate, plasma fibrinogen, platelet viscosity and peripheral vasoconstriction.25 Cold may also increase cardiac load through raised inflammatory markers and coagulation parameters.26 Additionally, cold temperatures may trigger higher haemoglobin A1c levels in people with type 2 diabetes, which is a major risk factor for cardiovascular disease.27 Similarly, exposure to heat can elevate heart rate, blood pressure, blood viscosity and coagulability, weaken core temperature regulation and heighten the risk of coronary events and stroke.28 As well, dehydration after heat exposure can lead to fluid and electrolyte disturbances that are a frequent complication in patients with coronary dysfunction.4
The main strength of this study is its focus on the entire population of Ontario, the most populous province in Canada, rather than selected cities. Our analysis was based on a large cohort with ~1.7 million hospitalisations over 17 years. Additionally, the application of a recently developed multivariate meta-analytical model14 also allowed us to pool the delayed and non-linear temperature–hospitalisation relationships across Ontario. Furthermore, our analysis controlled for various potential confounders, including relative humidity, air pollution, influenza activity, seasonality and long-term trend and so on. These variables have been seldom considered in previous study investigating the short-term health effects of temperatures.1 4 As well, we collected detailed information on major comorbid conditions and the use of medications using validated databases, providing an opportunity to evaluate potential effect modification by these characteristics. Little is known about the potential roles of comorbidities and medications in temperature–hospitalisation associations.
This study has several limitations. First, our analysis was restricted to people admitted to hospital. Our results, therefore, could not capture the effects of temperature on the coronary and stroke events in the outpatient settings (eg, emergency department visits), which may be more acute but not severe enough for hospitalisations. Second, similar to previous studies on temperature and hospitalisation,4 we considered only primary diagnosis as main reason for hospitalisation. Although this improved the accuracy in ascertaining cardiovascular hospitalisations, it might also have led to some underestimation of the burden on hospitalisations. A further limitation is the possible exposure misclassification, because we were unable to measure personal temperature exposure, which is associated with people’s daily activities, house characteristics and occupational factors. However, a previous study using both fixed-site monitoring data and spatial models to predict temperature at residence found similar associations between temperature and mortality.29 Nevertheless, given the inherent imprecision of the spatially derived exposure, our assessment of exposure was likely subject to non-differential misclassification that may have attenuated the estimates.30
Conclusion
Our observation that moderate temperatures were responsible for a far greater burden of hospitalisations for CHD and stroke than extreme temperatures can have serious global public health implications.
Key messages
What is already known on this subject?
Experimental studies show that short-term exposure to ambient temperature, especially cold, elevates blood pressure, triggers inflammatory reactions and promotes thrombosis, which may increase the risk of adverse cardiovascular events. However, little is known about the burden of cardiovascular hospitalisations related to cold and heat.
What might this study add?
In this study comprising the entire population of Ontario, we estimated that exposure to cold and heat, defined as temperatures above and below the optimum temperature (corresponding to the temperature of minimum morbidity), was responsible to 3.7% of coronary heart disease hospitalisations and 3.5% of stroke hospitalisations. Importantly, most of these excess hospitalisations were attributable to exposure to moderate temperatures rather than extreme temperatures, defined using cut-offs at the 2.5th and 97.5th temperature percentiles.
How might this impact on clinical practice?
Our findings indicate that clinical and public health interventions aiming to reduce adverse cardiovascular events could benefit from considering cold and heat in both moderate and extreme ranges. Advice on preventive behavioural change should be given to patients with heart disease and stroke before and during cold/hot days.
References
Footnotes
Contributors HC, EL, AG, RTB, MSG, SC, LB, AY and RC contributed to study design issues; HC, QL and JW prepared and cleaned the data; QL, JW, HC, LB, EL, AG, RTB, MSG and SC contributed to the data analyses; LB and HC drafted the manuscript; all authors contributed to interpretation of data, provided critical revisions to the manuscript and approved the final draft.
Funding This study was supported by a contract from Health Canada (contract number: 4500302837). This study was also supported by the Institute for Clinical Evaluative Sciences (ICES), which is funded by an annual grant from the Ontario Ministry of Health and Long-Term Care (MOHLTC). Dr Gasparrini was supported by a grant by Medical Research Council UK (Grant ID: MR/M022625/1) Parts of this material are based on data and information compiled and provided by Canadian Information Health Institute (CIHI). The opinions, results and conclusions reported in this article do not necessarily represent the views of ICES, MOHLTC or CIHI.
Competing interests None declared.
Ethics approval The Research Ethics Board of the University of Toronto (protocol reference 28527).
Provenance and peer review Not commissioned; externally peer reviewed.