Article Text

Abstract
Objective To obtain reference values of aortic valve area (AVA) in a large population and to infer the risk of overestimating aortic stenosis (AS) when focusing on flow-corrected indices of severity.
Methods We prospectively measured indices of AS in all consecutive echocardiograms performed in a large referral cardiac imaging laboratory for 1 year. We specifically analysed the distribution of AVA, indexed AVA and velocity ratio (Vratio) in patients with and without AS, the latter defined as the coexistence of valvular outflow obstruction (Vmax ≥2.5 m/s) and morphological findings of valve degeneration.
Results 16 156 echocardiograms were analysed, 14 669 of which did not show valvular obstruction (peak jet velocity <2.5 m/s). In the latter group, AVA was 2.6±0.7 cm2 in 8190 studies with normal valves and 2.3±0.7 cm2 in 6479 studies with aortic sclerosis (AScl). There was a relatively wide overlap between values of AVA, indexed AVA and velocity ratio between studies of patients with AScl and AS. Values of AVA ≤1.0 cm2 were found in 0.5% of studies with normal valves and 1.8% of studies with AScl. These proportions were 3.1% and 9.3% for AVA ≤1.5 cm2, respectively. Vratio ≤0.25 were found in 0.1% of patients without obstruction. Risk factors for a small AVA in patients without obstruction were AScl, female sex, small body surface area, low ejection fraction and mitral regurgitation.
Conclusions Normal values of continuity-equation derived AVA are smaller than previously considered. AVA values below cutoffs of moderate or severe AS can be found in patients without the disease. Flow-corrected indices may overestimate AS in patients with low gradients, particularly in the presence of well-identified risk factors.
- cardiac imaging and diagnostics
- echocardiography
- aortic stenosis
- valvular heart disease
This is an open access article distributed in accordance with the Creative Commons Attribution Non Commercial (CC BY-NC 4.0) license, which permits others to distribute, remix, adapt, build upon this work non-commercially, and license their derivative works on different terms, provided the original work is properly cited, appropriate credit is given, any changes made indicated, and the use is non-commercial. See: http://creativecommons.org/licenses/by-nc/4.0/.
Statistics from Altmetric.com
Introduction
Characterising aortic valve stenosis (AS) relies mostly on ultrasound.1 Using this technique, the diagnosis of AS is straightforward when B-mode signs of valvular degeneration (valvular fibrosis, calcification and restricted leaflet motion) coexist with Doppler evidence of valvular outflow obstruction (VOO, defined as a peak transvalvular jet velocity Vmax ≥2.5 m/s).2 However, establishing AS severity may be a more difficult task. When Vmax, mean pressure gradient (MPG) and effective aortic valve area (AVA) show consistent values below or beyond established cutoffs, grading is simple.2 However, in >30% of patients, these three indices yield discordant grades of severity.3 Reasons for discrepancy may be measurement errors, abnormal flow states, inconsistent thresholds or a combination of these.1–5 In most cases of discrepancy, an AVA ≤1 cm2 prevails over low values of MPG and Vmax to define AS as ‘severe’ and guide clinical decisions. Thus, AVA is frequently considered the most important index to grade AS. Although reference values have never been obtained in a large population, the area of the normal aortic valve is believed to be 3–4 cm2,6 and values <2.0 cm2 are believed to cause VOO. We hypothesised that exploring AVA values in patients without VOO would be useful to unmask the risk of overestimating AS in patients who do suffer the disease. We designed a prospective study to measure AVA in a large series of consecutive echocardiographic examinations focusing on patients without VOO. Additional aims were (1) to identify the risk factors related to a small AVA in patients without VOO, and (2) to address whether alternative flow-corrected metrics such as the body-surface indexed AVA (AVAi) and the velocity ratio (Vratio or dimensionless index) are more specific to identify patients with VOO.
Methods
Study design
We obtained quantitative AS data in a large series of unselected consecutive echocardiograms from a tertiary referral hospital. From 1 July 2015 to 30 June 2016, sonographers and physicians of the adult echocardiography laboratory from our institution were instructed to obtain measurements of AS in all transthoracic studies, irrespective of their indication. All data were analysed anonymously, and the study was performed following current recommendations of the Declaration of Helsinki. The study was approved by the Institutional Ethics Committee which exempted the need for patient informed consent, as it required no modification in standard clinical practice.
Image acquisition and analysis
Ultrasound recordings were obtained according to current guidelines.2 Special care was taken to obtain left ventricular outflow tract (LVOT) images from parasternal long-axis view using a zoom to identify the clearest and largest LVOT annulus recordings. Doppler spectrograms were obtained from apical five-chamber views, using multifrequency transducers and colour Doppler, to optimise alignment with the flow. The pulsed-wave Doppler sample volume was located 0.5 to 1 cm proximal to the aortic valve plane. All measurements were performed using EchoPac (BT08; GE Healthcare). LVOT diameter was measured from mid systolic frames at the hinge point of insertion of the aortic cusps from inner-to-inner edges.2 Stroke volume (SV) was calculated as the product of LVOT cross-sectional area (derived from the former diameter assuming a circular shape) and the LVOT time-velocity integral (TVI). AVA was calculated as SV/aortic TVI; AVAi was calculated as AVA/patient’s body surface area (Du Bois and Du Bois’ formula). The Vratio was calculated as LVOT TVI/Aortic TVI. Measurements were averaged from three consecutive beats in regular (sinus or paced) rhythms and five beats in patients with atrial fibrillation. Image quality was graded as 0 (reliable Doppler measurements unavailable), 1 (poor image quality but obtainable measurements), 2 and 3 (good and excellent image quality, respectively). Studies with 0 image quality or performed by in-training personnel were dismissed. Cardiologists with level-III expertise in cardiac ultrasound read and signed reports from all examinations and re-measured all studies showing an AVA ≤1.5 cm2.
VOO was defined as Vmax ≥2.5 m/s.2 AS was defined as morphological findings of valve degeneration (B-mode signs of valve fibrosis and/or calcification) and the presence of VOO.2 Aortic valves from studies without VOO were classified either as normal or as aortic sclerosis (AScl) based on the absence or the presence of valve degeneration.7 Studies with prosthetic aortic valves or with subvalvular (late-peaking LVOT velocity ≥1.8 m/s) or supravalvular obstruction (anatomical signs of supravalvular stenosis and Vmax ≥2.0 m/s) were excluded from analysis. Custom software written in R was used to forward data from the clinical report system to an anonymised database without any user interaction. Reproducibility of AVA measurements in patients with AS in our laboratory has been previously reported.8 However, because reproducibility may vary in other populations, we underwent a measurement reproducibility analysis in 191 randomly selected examinations without VOO (two level-III blinded cardiologists, 3 weeks apart; online supplementary table 1).
Supplementary file 1
Statistical analysis
Data are presented as mean±SD deviation except otherwise indicated. One-way analyses of variance (followed by Tukey contrasts) and χ2 (followed by Holm-adjusted Fisher pairwise contrasts) tests were used to compare studies with normal, sclerotic or stenotic aortic valves. Intraclass correlation and Bland-Altman analyses were used for assessing agreement. Empirical, normal and empirical cumulative distribution functions were calculated for all AS indices. The 95% CI of the latter were calculated using the Kolmogorov-Smirnov’s D statistic. Bivariate density plots were used to visualise the overlap between quantitative variables. False positive rates for identifying AS in patients without VOO were calculated for different cutoffs of severity, and their 95% CIs were computed assuming a binomial distribution. Uni and multivariate logistic regression analyses were used to assess the factors related to small AVA values in patients without VOO. For multivariate modelling, the full study database was randomly split into learning (n=9656 studies) and testing (n=4974) independent datasets. Variable selection was performed by backward variable selection based on the Alkaike’s information criterion, entering clinically relevant variables and using a cross-validation algorithm to avoid overfitting. Beta coefficients, ORs (and their 95% CIs) and diagnostic cutoff point (based on Youden’s J statistic) of this model were calculated. Its predictive capability was then assessed on the testing dataset by means of the ROC curve, its area under the curve (AUC), 95% CI, as well as its sensitivity, specificity, positive and negative predictive values (based on 2000 bootstrap replicates). Due to their derivation formulae, there is inherent strong collinearity between AS indices, SV and the aortic TVI. Therefore, the full multivariate modelling strategy was performed twice, with and without entering these factors. All analyses were performed in R (V.3.4.0). P values <0.05 were considered significant.
Results
Study population
From an original pool of 29 514 studies, 16 156 echocardiograms from 13 920 patients were finally analysed (figure 1). No VOO was found in 14 669 (8190 and 6479 showing normal and sclerotic valves, respectively), whereas AS was found in 1487. Demographic, clinical and echocardiographic data are shown in table 1 and figure 2.
Clinical and echocardiographic data of the studied population

Study population.
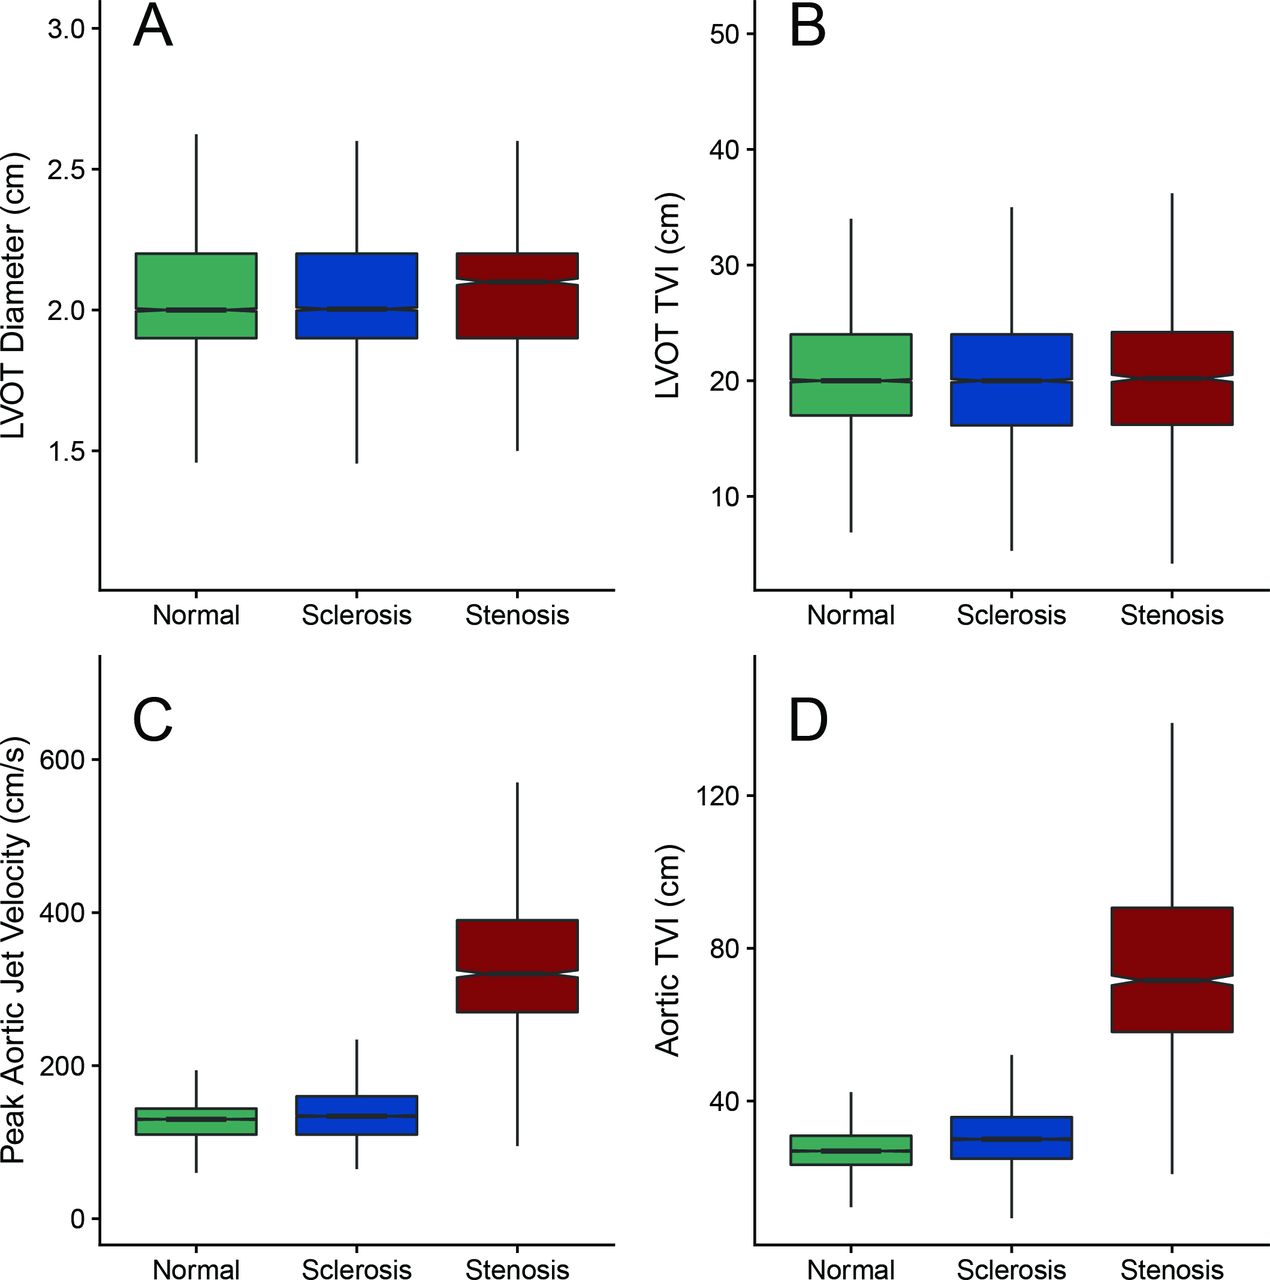
Echocardiographic data. Boxplots of the echocardiographic data of patients with normal (green), sclerotic (blue) and stenotic valves (red). Panel A: LVOT diameter (cm). Panel B: LVOT TVI (cm). Panel C: peak aortic jet velocity (cm/s). Panel D: aortic TVI (cm). LVOT, left ventricular outflow tract; TVI, time–velocity integral.
Indices of AS in patients with and without VOO
AVA was 2.6±0.7 cm2 in studies with normal valves and 2.3±0.7 cm2 in studies with AScl (table 2, figure 3 and online supplementary figure 1). AVAi and Vratio were 1.4±0.4 cm2/m2 and 0.8±0.1, respectively, in studies with normal valves, and 1.3±0.4 cm2/m2 and 0.7±0.2 in studies with AScl. These reference values of AVA, AVAi and Vratio remained almost unchanged when subgroups of studies with low LV ejection fraction, significant regurgitation, irregular rhythm or poor image quality (grade 1) were excluded (table 2). Values of AVA, AVAi and Vratio overlapped between studies with AScl and AS (figure 3 and online supplementary figure 1). AVA values ≤1.5 cm2 were found in 5.8% (95% CI 5.5% to 6.2%) of studies without VOO (table 2). A total 0.5% (0.3 to 0.6) of studies with normal valves showed an AVA ≤1.0 cm2 and 3.1% (2.7 to 3.5) showed an AVA ≤1.5 cm2. In patients with AScl, these proportions were 1.8% (1.5 to 2.1) and 9.3% (8.6 to 10.0), respectively. Values of Vratio ≤0.5 were found in 3.6% (95% CI 3.2% to 4.0%) of studies with normal valves and in 14.6% (95% CI 13.7% to 15.4%) of studies with sclerotic valves. Only 0.1% of the studies without VOO showed a Vratio ≤0.25 (table 2).
Summary statistics of indices of AS in patients without valvular outflow obstruction

The distribution of grading indices of AS. Empirical cumulative distribution functions for AVA, AVAi and Vratio. Vertical dotted lines account for current established cutoffs of AS. AS, aortic valve stenosis; AVAi, indexed aortic valve area; Vratio, velocity ratio.
Predictors of small AVA in the absence of outflow obstruction
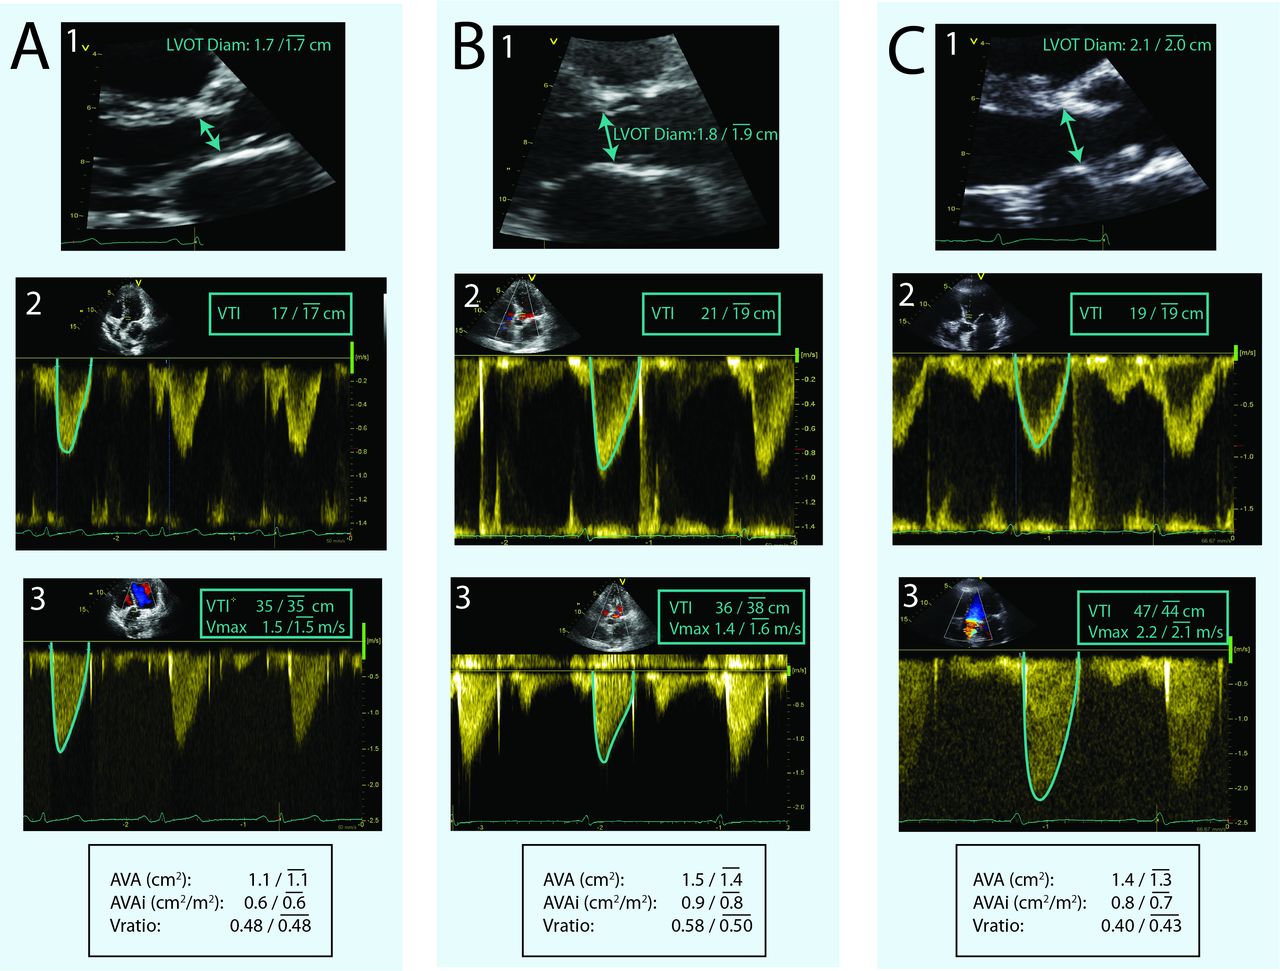
Studies without VOO and AVA ≤1.5 cm2 showed smaller LVOT diameters, smaller LVOT TVIs, smaller SVi and larger aortic TVIs than those with AVA >1.5 cm2 (table 3 and online supplementary figure 2). Risk factors for an AVA ≤1.5 cm2 in the absence of VOO by multivariate analysis were: female sex, AScl, low LV ejection fraction, age, a small body surface and the degree of mitral regurgitation (figure 4). Overall predictive capability of the model was good, as demonstrated in the independent validation dataset (figure 4 Insert): AUC=0.75 (95% CI 0.73 to 0.78), specificity=0.92 (0.90 to 0.93), sensitivity=0.99 (0.91 to 1.00), positive predictive value=0.42 (0.39 to 0.45) and negative predictive value=1.00 (1.00 to 1.00). When SV and aortic TVI were forced in the multivariate model, mitral regurgitation and body surface area were excluded as independent predictors (online supplementary table 2). Risk factors for an AVA ≤1.5 cm2 were also predictors of an AVAi ≤0.85 cm2/m2 and a Vratio <0.5 in the absence of outflow obstruction (online supplementary table 2). Representative examples of studies with a small AVA in the absence of AS are shown in figure 5 and supplemental videos 1– 3.
Clinical and echocardiographic data of studies without valvular outflow obstruction according to AVA > or ≤ 1.5 cm2

Predictors of small AVA values in studies without VOO. Multivariate logistic regression predictors of an AVA ≤1.5 cm2 in studies without VOO. ORs and 95% CI and cutoffs are shown for the model obtained in the learning dataset (n=9656) without entering SV and aortic TVI in the model. Insert: ROC curves, cutoffs and AUC obtained in the testing dataset (n=4974) for this model (blue) and for the one described in the online supplementary table 1, obtained forcing SV and aortic TVI into the model (green). AUC, area under the curve; AVA, aortic valve area; ROC, receiver operating characteristic; TVI, time–velocity integral; VOO, valvular outflow obstruction.
Representative examples of small AVA values obtained in studies without VOO. The top row shows zoom images of the LVOT and measurements of the aortic annulus. The middle row shows pulsed-wave Doppler spectrograms of the LVOT velocities, whereas the bottom row shows continuous-wave Doppler spectrograms of the aortic valve jet. Results are displayed as measured beat /  results of 3-5 consecutive beats. Panel A and online supplemental video 1 are from a 69-year-old woman studied for suspected coronary artery disease. Her echocardiogram was normal except for an impaired relaxation filling pattern. The aortic valve was morphologically normal. Panel B and online supplemental viedo 2 are from a 67-year-old woman studied before chemotherapy. Her aortic valve was morphologically normal. Panel C and online s
upplemental video 3 are from a 75-year-old man with chronic liver disease. Main echocardiographic findings were normal except for a 2+ mitral regurgitation, a systolic pulmonary artery pressure of 40 mm Hg and a sclerotic aortic valve. AVA, aortic valve area; LVOT, left ventricular outflow tract; VOO, valvular outflow obstruction.
results of 3-5 consecutive beats. Panel A and online supplemental video 1 are from a 69-year-old woman studied for suspected coronary artery disease. Her echocardiogram was normal except for an impaired relaxation filling pattern. The aortic valve was morphologically normal. Panel B and online supplemental viedo 2 are from a 67-year-old woman studied before chemotherapy. Her aortic valve was morphologically normal. Panel C and online s
upplemental video 3 are from a 75-year-old man with chronic liver disease. Main echocardiographic findings were normal except for a 2+ mitral regurgitation, a systolic pulmonary artery pressure of 40 mm Hg and a sclerotic aortic valve. AVA, aortic valve area; LVOT, left ventricular outflow tract; VOO, valvular outflow obstruction.
Supplementary file 2
Supplementary file 3
Supplementary file 4
Discussion
To our knowledge, this is the first study providing reference values for AVA, AVAi and Vratio. ‘Normal’ AVA values obtained by the continuity equation are in average 1 cm2 smaller than usually described.6 By focusing on echocardiographic studies from patients without the disease, we show that flow-corrected indices may overestimate AS. Importantly, AVA values consistent with moderate or severe AS can be identified in as many of 3% of patients with normal valves and 9% of patients with AScl. These patients were not diagnosed of AS because their Vmax was<2.5 m/s. However, if eventually Vmax were to increase beyond this threshold, these patients would automatically shift to a moderate or severe (low gradient) AS category based on AVA. Thus, AVA poorly accounts for mild degrees of AS and the cut-off criteria established for moderate and severe AS may overestimate the real haemodynamic relevance of the disease. The Vmax and the pressure gradient should not be overlooked to grade AS, particularly in the less severe degrees of severity.
Haemodynamic criteria to grade AS
The unreliability of focusing excessively on AVA to grade AS has been recently emphasised,9 based on the results of a large retrospective analysis of patients with the disease.10 The present study focuses on patients without the disease to provide further insight into the limitations of flow-corrected indices obtained by Doppler echocardiography. Beyond measurement errors, several factors may account for the observed small values of flow-corrected indices observed even in the absence of VOO. AVA, AVAi and Vratio rely on several physical assumptions which have not been fully validated in the absence of VOO. The peak velocity—as measured using continuous-wave Doppler—overestimates average velocity along the full cross-section of the transvalvular jet if its flow profile is not completely flat. By this and other mechanisms, flow-dependence8 11 and pressure recovery12 may sometime yield misleadingly small AVAs. An alternative interpretation of our findings is that the Vmax >2.5 m/s criterion lacks sensitivity for the diagnosis of VOO, all patients with AScl and small AVA values suffering AS irrespective of their Vmax values. However, from a physiological perspective, a haemodynamically significant outflow obstruction that generates a relevant convective acceleration is highly unlikely with lower transvalvular velocities.13–15
Because the most challenging grading situation is PLGAS, current guidelines emphasise combining several techniques in this scenario.2 Cross-sectional ultrasound and CT must ensure calcification and limited leaflet excursion to grade AS as severe, but there is a high overlap between the morphology of sclerotic and stenotic valves. Cardiac catheterisation is useful to confirm haemodynamic measurements, but AVA/MPG discrepancies are also common using this technique.5 Finally, concurrent abnormalities in the vascular tree may be responsible for the increased afterload to the LV in addition to AS.11 16 Thus, despite this large armamentarium, decision-making in low-gradient AS remains difficult in some patients. The present study shows that the major source of small AVAs in patients without AS is a low SV. Hence, misclassification of AS will most frequently combine a small AVA, a low gradient and a low-flow situation. Furthermore, clinical conditions previously described as highly prevalent in PLGAS17―female sex, age and low body surface area―are identified in our study as the main risk factors for showing small AVAs in patients without VOO.
A post hoc analysis of a prospective clinical trial has shown that outcomes of patients with AS are best predicted in terms of their MPG.18 PLGAS may therefore represent a milder degree of severity than high gradient AS, particularly when transvalvular flow is normal.19 Nevertheless, several observational studies have shown that outcomes of symptomatic patients are improved by valve replacement in low-flow PLGAS.17 20–22 Although PLGAS is currently a IIa-level recommendation of valve replacement,1 4 the benefit of therapy is clearly lower than in high-gradient AS. In fact, a low MPG at the time of treatment is a consistent predictor of lack of clinical improvement after valve replacement.23 24 The limited specificity of current grading criteria could be responsible for driving some patients with milder degrees of AS towards valve replacement. Our findings emphasise that special care needs to be taken to follow current recommendations of an integrated stepwise approach in low-gradient AS.2 The risk factors for misdiagnosis we have identified in the present study—small body surface area, female gender, advanced age, impaired systolic function and significant mitral regurgitation—raise a call for reassessment before indicating valve replacement in these situations.
Our study suggests that there is a wide continuum in the natural history of aortic valve degeneration spanning from a normal aortic valve to severe high-gradient AS. How early in this process patients may benefit from valve replacement is currently a matter of reassessment, particularly considering that the risks of percutaneous therapy are becoming lower. Meanwhile, physicians must be aware that when examined individually, the contradictory information yield by AVA, Vmax and MPG is not exclusively caused by the haemodynamic definitions of AS. Outcome trials prospectively addressing the impact of therapy in earlier stages of the disease need to be performed, not only in terms of symptomatic status,25 but also of lower degrees of haemodynamic significance.
Limitations
The scope of this work was to assess the limitations of conventional transthoracic echocardiography metrics of AS as currently recommended in clinical practice. A different reference method such as CT would have provided interesting results on studies showing small AVA values. A relatively high proportion of studies were unsuitable for analysis. However, the large volume of data allowed for highly powered statistical analyses, allowing for reliable index distribution estimates and narrow CIs. We measured the LVOT diameter at the annulus level instead of 0.5 to 1.0 cm proximal to the valvular plane (at the point where the pulsed-wave Doppler sample volume is placed in the LVOT).26 Which location is best for calculating AVA is a matter of debate,2 27 but the funnel-shape of the LVOT is likely to yield lower values at the annulus.26 In patients with AS, combining Doppler data with LVOT cross-sectional area measured by transoesophageal echocardiography28 or CT29 may increase the accuracy of AVA measurements and yields slightly higher values than those obtained exclusively by transthoracic echocardiography. However, outcome studies have not unequivocally demonstrated improved clinical efficacy of these hybrid methods,29 and transthoracic echocardiography is still the reference technique for clinical decision-making.1 We did not use dedicated continuous-wave (Pedoff) transducers, and we focused exclusively on the apical five-chamber view. However, reported values of AVA, AVAi and Vratio would have been even lower if these additional approaches had been used. Due to the moderate reproducibility of AS indices, the ‘normal’ values herein reported need to be interpreted with caution. However, reproducibility is as a limitation of the continuity equation method per se. Although AScl is an independent risk factor for future cardiovascular events in population studies, this risk is not associated with the progression to AS.7 Only prospective studies will clarify the clinical relevance of small AVA in patients with Vmax <2.5 m/s and help to define whether this threshold should be lowered in patients with low-flow states.
Conclusions
Normal values of continuity-equation derived AVA are smaller than previously considered. Values of AVA consistent with the definitions moderate or even severe AS can be found in patients without outflow obstruction. Until their prognostic significance is clarified, the isolated finding of a small AVA value needs to be interpreted with caution. Women with advanced age, a small body surface area, a low ejection fraction, AScl and/or significant degrees of mitral regurgitation are at the highest risk of overestimating AS when focusing excessively on flow-corrected indices.
Key messages
What is already known about this subject?
Grading aortic valve stenosis is based on peak transvalvular jet velocity (Vmax), mean pressure gradient (MPG) and effective aortic valve area (AVA). In case of discrepancy, the flow-corrected criteria usually prevail to establish severity. Establishing the diagnosis of aortic valve stenosis (AS) requires the existence of valvular outflow obstruction, defined as a Vmax ≥2.5 m/s.
What does this study add?
For the first time, continuity-equation-derived AVA normal values are estimated from a large population. Normal values of AVA are smaller than previously considered. We found that AVA values consistent with moderate or even severe AS can be identified in patients without the disease. AVA may overestimate the severity of AS, particularly in small and elderly women with low ejection fraction, concomitant mitral regurgitation and aortic sclerosis.
How might this impact on clinical practice?
Small AVA values may overestimate AS. In the presence of low Vmax and MPG values, flow-corrected indices of AS must be interpreted with caution.
Acknowledgments
The authors are in debt with all the personnel of the Laboratory of Cardiac Imaging from our institution for their contribution to this study.
References
Footnotes
AG-M and PM-L contributed equally.
AP and EG contributed equally.
Contributors All authors have approved this resubmission. All of the authors have made substantial contributions in the conception or design or analysis and interpretation of data. All the authors have participated drafting the manuscript or revising it critically for important intellectual content. All the authors have finally approved the submitted manuscript. JB, AG-M and PM-L: responsible for the overall content as guarantors.
Funding CPV has been funded by the Juan Rodés Fellowship (JR15/00039) (to CPV) from the Instituto de Salud Carlos III. PML was supported by the Juan de la Cierva Incorporación fellowship (IJCI-2014-19507) from the Ministerio de Economía y Competitividad, Spain and the CIBERCV.
Disclaimer The manuscript has not been published and is not being considered for publication elsewhere.
Competing interests None declared.
Provenance and peer review Not commissioned; externally peer reviewed.
Patient consent for publication Not required.