Article Text

Abstract
Objective To investigate sex differences in prevalence, treatment and control of major cardiovascular risk factors in England.
Methods Data from the Health Survey for England 2012–2017 on non-institutionalised English adults (aged ≥16 years) were used to investigate sex differences in prevalence, treatment and control of major cardiovascular risk factors: body mass index, smoking, systolic blood pressure and hypertension, diabetes, and cholesterol and dyslipidaemia. Physical activity and diet were not assessed in this study.
Results Overall, 49 415 adults (51% women) were included. Sex differences persisted in prevalence of cardiovascular risk factors, with smoking, hypertension, overweight and dyslipidaemia remaining more common in men than in women in 2017. The proportion of individuals with neither hypertension, dyslipidaemia, diabetes nor smoking increased from 32% to 36% in women and from 28% to 29% in men between 2012 and 2017. Treatment and control of hypertension and diabetes improved over time and were comparable in both sexes in 2017 (66% and 51% for treatment and control of hypertension and 73% and 20% for treatment and control of diabetes). However, women were less likely than men to have treated and controlled dyslipidaemia (21% vs 28% for treatment and 15% vs 24% for control, for women versus men in 2017).
Conclusions Important sex differences persist in cardiovascular risk factors in England, with an overall higher number of risk factors in men than in women. A combination of public health policy and individually tailored interventions is required to further reduce the burden of cardiovascular disease in England.
- cardiac risk factors and prevention
- health care delivery
Statistics from Altmetric.com
Introduction
It is estimated that, in 2019, 6.1 million people in England were living with a cardiovascular disease (CVD).1 There are over 136 000 deaths due to CVD in England each year, of which nearly 36 000 happen before the age of 75 years.1 Evidence demonstrates that control of major cardiovascular risk factors, such as blood pressure (BP), cholesterol, diabetes, smoking and overweight, is an effective preventative strategy.2 Although the causal role of those modifiable risk factors on CVD is undisputable,3 evidence suggests that compliance with guideline-recommended levels and targets remains low worldwide.4 5 Furthermore, substantial differences between women and men have been reported for prevalence, treatment and control of CVD risk factors.6–8 This may result from sex differences in lifestyle and environmental exposures, inequalities in healthcare and/or biological differences.9 10
However, sex-specific data on the trends in prevalence, treatment and control of CVD risk factors in England remain limited.11 12 Understanding how the burden of CVD risk factors has been evolving in women and men, and whether there are currently differences in risk factor control, is critical to inform policy making and planning of healthcare delivery. Therefore, this study aimed to investigate sex differences in major CVD risk factors in England between 2012 and 2017, overall and stratified by age, history of CVD and level of socioeconomic deprivation.
Methods
Study design
This study used data from cross-sectional surveys conducted in non-overlapping, nationally representative samples of the English population for six consecutive years (2012–2017).
Data source
The Health Survey for England (HSE) is an annual population-based survey, which uses stratified multistage probability sampling to produce nationally representative estimates of the English population.13 It provides information on a wide range of health and care topics for adults aged 16 and over (as defined by the HSE) and children aged 0–15, living in private households in England. About 8000 adults and 2000 children take part every year, with an overall response rate of 60%. The survey consists of an interview, during which information is collected both at household and individual level. The individual module includes questions regarding general health and lifestyle risk factors. Height and weight are also measured. In a random sample of the households (about 60%), the interview is followed by a nurse visit, during which additional questions are asked about prescribed medicines, BP is measured and blood samples are taken for the analysis of total cholesterol, high-density lipoprotein (HDL) cholesterol and haemoglobin A1c (HbA1c).14
For this study, data were used from the most recent HSE surveys conducted between 2012 and 2017. We included only the adult population. For each risk factor, individuals with missing values were excluded. All the documentation pertaining to survey design and data collection, as well as the raw data, are publicly available.15
Risk factors, treatment and definitions
Individuals with a self-reported history of heart or circulatory disease were categorised as having a history of CVD. Systolic BP (SBP) was calculated as the mean of three readings obtained according to a standardised protocol. Current smoking was self-reported. Body mass index (BMI) was calculated from measured weight (in kilograms) divided by measured height (in metres) squared. Overweight was defined as BMI ≥25 but<30 kg/m2 and obesity was defined as BMI ≥30 kg/m2. HDL cholesterol, total cholesterol and HbA1c were measured using blood collected according to standardised procedures.
Individuals were considered to have hypertension if they met one of the following criteria: (1) doctor-diagnosed hypertension (self-reported), (2) SBP ≥140 mm Hg or diastolic blood pressure (DBP) ≥90 mm Hg16 or (3) the use of antihypertensive medication. Individuals were considered to have diabetes mellitus if they met one of the following criteria: (1) doctor-diagnosed diabetes (self-reported), (2) HbA1c≥48 mmol/mol or equivalent17 or (3) use of antidiabetic medication. Dyslipidaemia was defined as total cholesterol ≥5 mmol/L18 or use of lipid-lowering medication. The control of hypertension, diabetes mellitus and dyslipidaemia was defined as SBP/DBP below 140/90 mm Hg, HbA1c under 48 mmol/mol (6.5%) and total cholesterol below 5 mmol/L, respectively. Percentages of treatment and control were computed for hypertension, diabetes and dyslipidaemia. A summary score was also calculated according to the absence/presence of current smoking, hypertension, diabetes mellitus and dyslipidaemia. Overweight/obesity was not included because it is causally related to the other risk factors. Categories of three and four risk factors were combined due to the low number of individuals with four risk factors. Deprivation was measured using the Index of Multiple Deprivation (IMD) of the area of residence, categorised into five equal groups (where 1 corresponds to least deprived and 5 corresponds to most deprived), according to their national distribution.19
Statistical analyses
Age-standardised summary statistics and respective 95% confidence intervals (CIs) were estimated separately for women and men, standardised to the age distribution for the mid-year population in England in 2017 (direct standardisation). Mean values were reported for continuous variables, and prevalence was reported for categorical variables. Differences between women and men were estimated using linear regression and binomial regression (with a log link) for continuous and categorical variables, respectively. The total number of risk factors was considered as a continuous variable. P values for sex differences in linear trends over time were derived by adding an interaction term between sex and year to each model. Subgroup analyses were performed according to age, categorised in four strata (16–34, 35–49, 50–64 and ≥65 years), history of CVD (absent versus present) and IMD (categorised in fifths). Analyses were performed using the ‘Survey’ package for R 3.6.2, using the sample weights provided by the HSE.
Patient and public involvement
This research was done without patient or public involvement.
Results
This study included 49 415 adults (51% women), with about 8000 individuals per calendar year (online supplementary table S1).
Supplemental material
Blood pressure
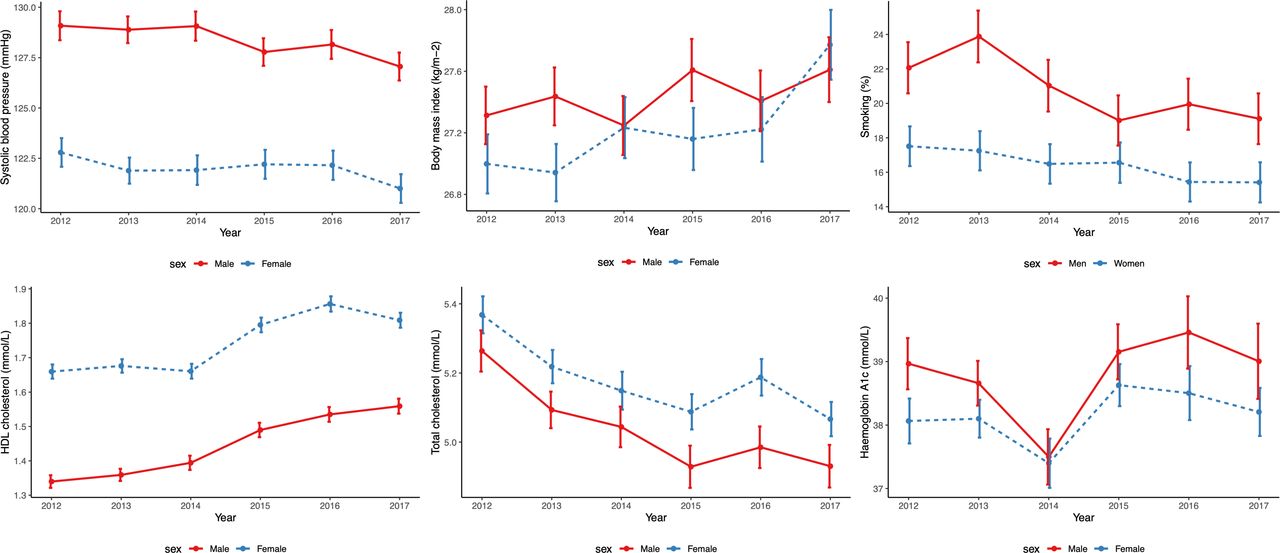
Mean SBP decreased from 123 mm Hg, 95% CI (122 to 124) and 129 mm Hg (128 to 130) in 2012 to 121 mm Hg (120 to 121) and 127 mm Hg (126 to 128) in 2017 for women and men, respectively (figure 1). Mean SBP was lower in women than in men below the age of 65 and in individuals with CVD (online supplementary figures S1 and S2). Between 2012 and 2017, the prevalence of hypertension overall remained relatively stable, with a small increase in the proportion of treated and controlled hypertension, particularly in men (figure 2 and table 1 and online supplementary tables S3–S6). Treatment and control of hypertension were higher in those with CVD and over the age of 65, but there were no differences according to level of deprivation (online supplementary figures S7, S10 and S13).

Trends in cardiovascular risk factors by sex between 2012 and 2017. All estimates are age-standardised to the English standard population in 2017. Error bars indicate 95% CIs. A total of 25 254 women and 24 161 men participated in the surveys between 2012 and 2017. The number of participants for each year was 4270, 4553, 4165, 4107, 4082 and 4077 for women and 4081, 4317, 3987, 3927, 3929 and 3920 for men from 2012 to 2017, respectively. BMI, body mass index; BP, blood pressure; HbA1c, haemoglobin A1c; HDL, high-density lipoprotein.

Treatment and control of hypertension by sex between 2012 and 2017. The numbers beneath the bars represent the mean prevalence of hypertension in the population for each year and sex. Further details in the tables. Hypertension was defined as a systolic/diastolic blood pressure ≥140/90 mm Hg, doctor-diagnosed hypertension or the use of antihypertensive medication. The control of hypertension was defined as systolic/diastolic blood pressure <140/90 mm Hg.
Age-standardised* mean or prevalence of risk factors in 2017 and in 2012, by sex
Anthropometry
Mean BMI increased more in women than in men (online supplementary table S7), but there were no significant differences between the sexes in 2017 (27.8 kg/m2 (27.5, 28.0) and 27.6 kg/m2 (27.4, 27.8) for women and men, respectively). The prevalence of overweight was consistently higher in men than in women, while obesity was higher in women than in men in 2017. Mean BMI was higher in individuals with CVD and in older age groups, but there were no substantial differences between women and men. BMI was also higher in both sexes in the most deprived areas (online supplementary figure S3).
Smoking
Smoking prevalence decreased from 18% (16 to 19) and 22% (21 to 24) in 2012 to 15% (14 to 17) and 19% (18 to 21) in 2017 for women and men, respectively. Smoking prevalence was higher in those under the age of 50 years and without CVD. There was also a marked difference in smoking prevalence according to deprivation (8% (6 to 10) vs 25% (22 to 28) for women and 12% (10 to 15) vs 29% (25 to 33) for men in the least and the most deprived areas, respectively, in 2017).
Lipids
Mean HDL cholesterol increased from 1.66 mmol/L (1.64 to 1.68) and 1.34 mmol/L (1.32 to 1.36) in 2012 to 1.81 mmol/L (1.79 to 1.83) and 1.56 mmol/L (1.54 to 1.58) in 2017 for women and men, respectively. Women had significantly higher values of HDL cholesterol at all time points, irrespective of age, history of CVD or deprivation level. Mean total cholesterol decreased from 5.37 mmol/L (5.31 to 5.42) and 5.26 mmol/L (5.20 to 5.32) in 2012 to 5.07 mmol/L (5.02 to 5.12) and 4.93 mmol/L (4.87 to 4.99) in 2017 for women and men, respectively. Women had higher total cholesterol than men over the age of 50, in individuals with CVD and in the least deprived areas. The prevalence of dyslipidaemia decreased in women and men during the study period but it remained largely untreated (figure 3). Although control improved over time in both sexes, women remained more likely than men to have uncontrolled dyslipidaemia, irrespective of age, history of CVD or deprivation level (online supplementary figures S9, S12 and S15).

Treatment and control of dyslipidaemia by sex between 2012 and 2017. The numbers beneath the bars represent the mean prevalence of dyslipidaemia in the population for each year and sex. Further details in the tables. Dyslipidaemia was defined as total cholesterol ≥5 mmol/L or the use of lipid-lowering medication. The control of dyslipidaemia was defined as total cholesterol <5 mmol/L.
Glycaemia
Mean levels of HbA1c remained relatively stable in women and men over time. There were no differences between the sexes, irrespective of age, history of CVD and deprivation level. However, mean HbA1c levels were higher in the older individuals and in those with CVD. The prevalence of diabetes mellitus remained relatively stable in both sexes, but it was lower in women than in men throughout the study period (6% (5 to 7) and 8% (7 to 9) for women and men in 2017) (figure 4). The proportion of untreated diabetes decreased but this was counterbalanced by an increase in uncontrolled diabetes in both sexes. There was no substantial variation in treatment and control rates by age and deprivation but those proportions were higher in individuals with CVD (online supplementary figures S8, S11 and S14).
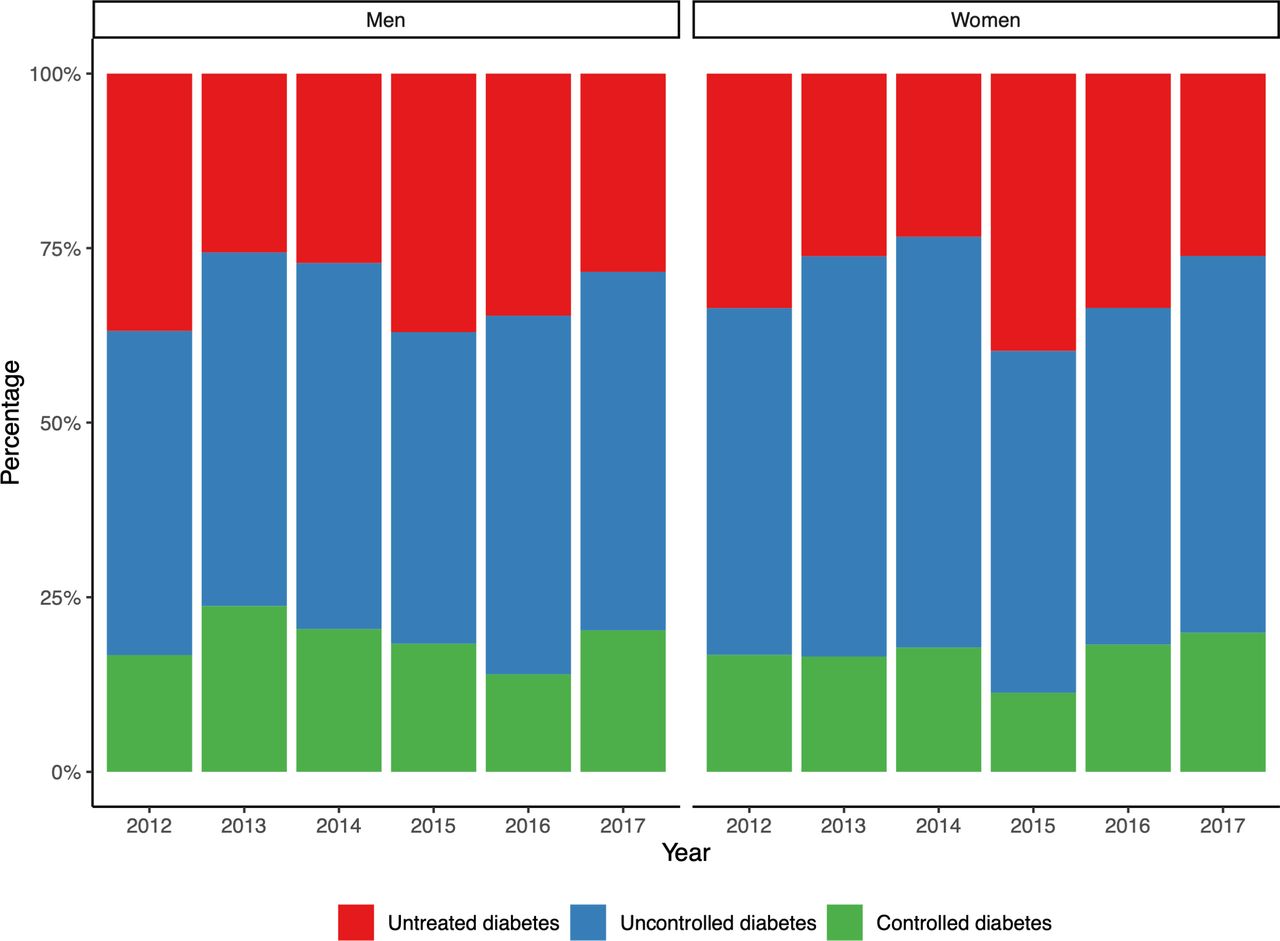
Treatment and control of diabetes mellitus by sex between 2012 and 2017. The numbers beneath the bars represent the mean prevalence of diabetes in the population for each year and sex. Further details in the tables. Diabetes mellitus was defined as haemoglobin A1c≥48 mmol/L, doctor-diagnosed diabetes (except associated with pregnancy) or the use of antidiabetic medication. The control of diabetes mellitus was defined as haemoglobin A1c<48 mmol/L.
Number of risk factors
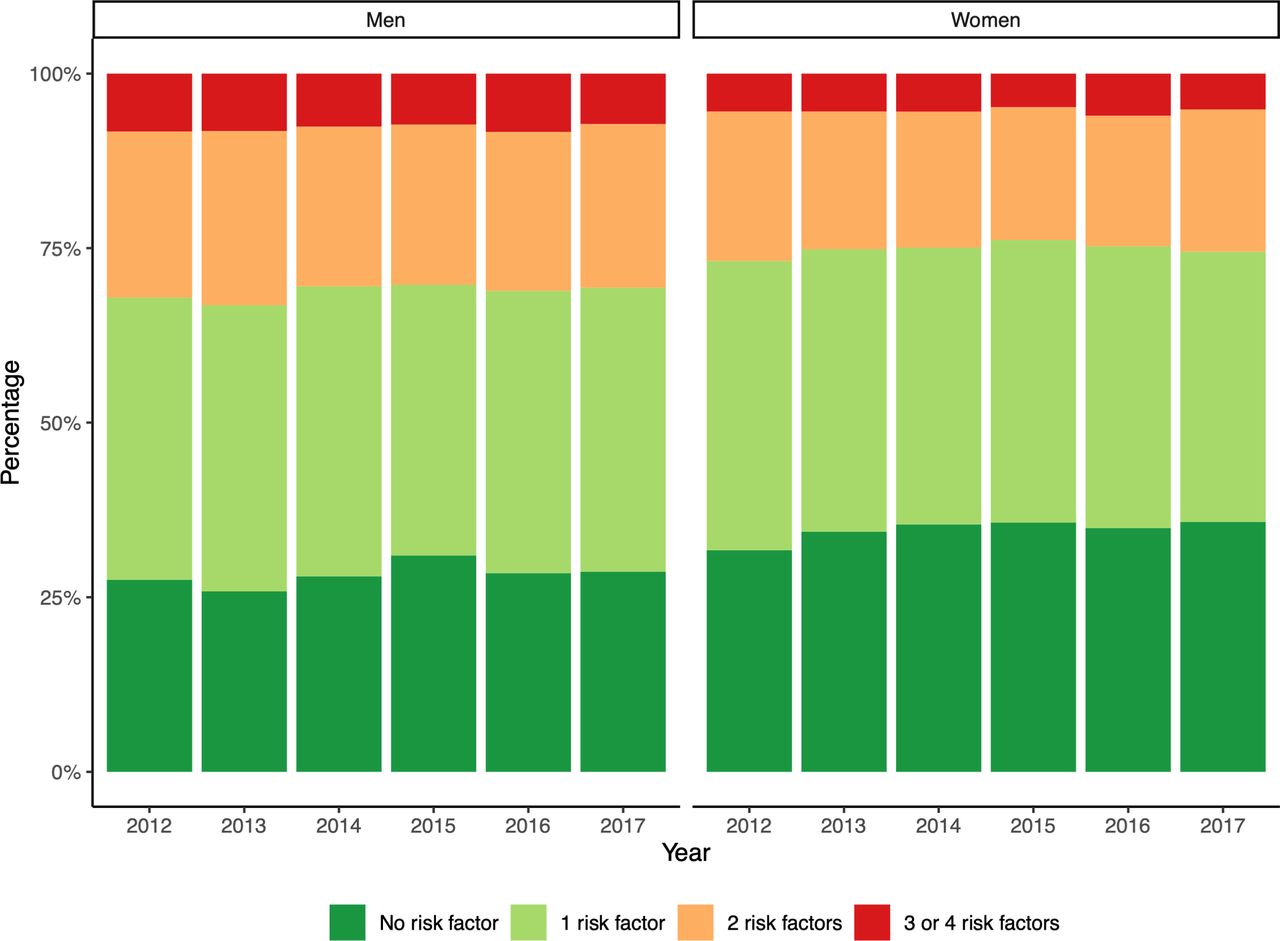
In both sexes, the total number of cardiovascular risk factors decreased during the study period, with the percentage of individuals with none of the cardiovascular risk factors increasing from 32% (30 to 34) and 28% (25 to 30) in 2012 to 36% (34 to 38) and 29% (26 to 31) in 2017 for women and men, respectively (figure 5). Women had, in general, fewer cardiovascular risk factors than men, but the sex difference was attenuated in older age groups and in the most deprived areas (online supplementary figures S5 and S6). In both sexes, the number of risk factors was higher in those with CVD (online supplementary figure S4).

Trends in the number of risk factors by sex between 2012 and 2017. Risk factors were current smoking, hypertension, dyslipidaemia and diabetes mellitus. Overweight/obesity was not included because it is causally related to the other risk factors.
Discussion
This nationally representative study of the English adult population demonstrated that sex differences in CVD risk factors persist. Indeed, overweight, smoking, hypertension, diabetes and dyslipidaemia are currently more prevalent in men than in women, while obesity is more common in women than in men. Those persisting inequalities reflect broadly comparable sex-specific trends in CVD risk factors over time. The total number of cardiovascular risk factors declined more substantially in women than in men over time. Despite a general improvement over the years, treatment and control of hypertension, dyslipidaemia and diabetes remain suboptimal in both sexes. The proportions of treated and controlled hypertension and diabetes were similar in women and men, but women were less likely than men to have treated and controlled dyslipidaemia.
A recent study that included data from 123 national health examination surveys, conducted between 1976 and 2017 in 12 high-income countries, showed that, overall, less than two-thirds of the patients diagnosed with hypertension were prescribed BP lowering treatment and of those only 20% achieved BP control (<140/90 mm Hg).11 There was wide variation in BP control across countries from as low as 29% in Japan to as high as 58% in Germany. Therefore, our estimates of 52% for women and 50% for men in 2017 in England, although unsatisfactorily low, are comparable to similar countries. In addition, those figures are slightly better than those reported by a recent study in the USA (47% for women and 41% for men).7 Our estimates for England in 2017 of 20% control of diabetes for both women and men are lower than those reported in the USA (control of diabetes, defined as HbA1c below 6.5%, achieved in 37% of the women and 25% of the men with diabetes in 2013–2016). The figures of 15% for women and 24% for men, for control of dyslipidaemia in England in 2017, are much lower than those reported in the USA, particularly for women (control of dyslipidaemia, defined as total cholesterol below 240 mg/dL, was achieved in 90% of the women and 94% of the men with dyslipidaemia). The underlying reasons for the discrepancies between countries may be related to differences in health systems (eg, private healthcare insurance) and financial incentives for treating CVD risk factors.20 21
The trends in cardiovascular risk factors in this study, that is, the reduction in the prevalence of smoking, mean SBP and total cholesterol, are consistent with the gradual decline in CVD in the England over the last few decades.22 However, corresponding reductions have not been observed for BMI, with mean population values currently in the overweight range. This is in keeping with the growing epidemic of obesity that seems to disproportionately affect women in comparison to men23 and that may be slowing down the increase in life expectancy in England.24 Our findings lend further support to the disproportionate burden of obesity for women,25 26 which is more likely attributable to wider environmental factors than to biological differences between the sexes.27 28 This highlights the importance of structural approaches addressing the obesogenic environment to reduce the soaring rates of obesity in England, particularly among women.29 30 Despite the rising prevalence of overweight/obesity, the prevalence of diabetes remained relatively stable over time, which may be related to underdiagnosis of diabetes or the time taken for obesity to cause diabetes.31
Notwithstanding some improvement over time, treatment and control of hypertension, diabetes and dyslipidaemia remain suboptimal in both sexes. For instance, hypertension control remains far off Public Health England’s ambition of treating to target 80% of the patients with hypertension by 2029.32 Most patients with diabetes were also not treated according to contemporary guidelines in both sexes, which seems important to reduce CVD risk.33 Treatment and control of dyslipidaemia were higher in men than in women, which may be related to the fact that men have, in general, higher cardiovascular risk and, hence, are more likely to meet the recommendations for initiating treatment than women.34 Furthermore, discrepancies in control rates may be related to differences in healthcare delivery,35 as intensive risk factor management is less commonly pursued in women than in men, even in the presence of CVD.36–38 This may also explain why differences in treatment and control of risk factors between individuals with and without CVD was larger in men than in women.4 35
Patients with CVD were more likely to have treated and controlled hypertension, diabetes mellitus and dyslipidaemia. The underlying reasons for those differences between secondary and primary prevention can be related to closer contact with healthcare services or enhanced risk perception by patients and clinicians alike.39 40 In addition, individuals in the most deprived areas had overall a higher burden of cardiovascular risk factors, particularly smoking. Indeed, the prevalence of smoking more than doubled from the least to the most deprived areas in both sexes, thus calling for targeted smoking cessation to the most deprived subpopulations. By contrast, mean total cholesterol declined with increasing deprivation. Although this could suggest a narrowing of deprivation gap in total cholesterol,41 it is more likely to be due to the lower levels of HDL cholesterol observed in the most deprived areas.
Our findings demonstrate that there has been minimal progress in treatment and control of CVD risk factors in both sexes since 2012, which may explain the stagnant rates of cardiovascular mortality in England since then.42 43 This emphasises the need for a renewed drive to prevent CVD by implementing effective health policy and to address persisting sex inequalities in preventative and therapeutic interventions.44–50 Likewise, inequalities based on deprivation need to be tackled by targeting efforts to high-risk groups, who tend to be the hardest to reach or most vulnerable (eg, minority ethnic populations, the homeless, the elderly).51–53 This should be part of a broader and stronger commitment to mitigate the detrimental impact of longstanding socioeconomic inequalities on population health in England.54
Strengths and limitations
The strengths of the study are the inclusion of a large, nationally representative sample of civilian, non-institutionalised English adults. Response rates were high for each calendar period, with minimal missing data, and data were collected using standardised procedures by trained study personnel, including extensive quality control. In addition, we assessed CVD risk factors from two complementary perspectives (eg, SBP and hypertension, total cholesterol and dyslipidaemia), as evidence has been accruing on the continuous nature of CVD risk.55
Nonetheless, there are some limitations to acknowledge. First, clinical practice may have changed over time, as some guidelines were revised during the study period.17 56 Second, differential sampling error across the various samples could affect comparisons over time. Third, the substantial number of comparisons performed in this study means that some of the reported trends may be due to chance rather than actual differences. Fourth, some of the variables were self-reported. Fifth, we used the IMD of the area of residence as a surrogate for individual deprivation, which may have introduced bias.57 Sixth, as the sampling frame comprised those in non-institutional households, respondents were likely relatively healthy.58 Seventh, we excluded missing values for specific analyses. However, those limitations are expected to have a comparable impact on women and men and, hence, they are unlikely to have biased our main comparisons between sexes. In addition, data were not available for low-density lipoprotein cholesterol, which has a stronger association with CVD than HDL or total cholesterol.59 Comprehensive and consistently reported data were also not available for other important CVD risk factors, such as diet and physical activity.
Conclusion
Important differences remain in CVD risk factors between women and men in England, with an overall higher number of risk factors in men than in women. Treatment and control of hypertension, diabetes mellitus and dyslipidaemia improved over time, but remain suboptimal in both sexes. A multipronged approach combining agentic and structural interventions, including pharmacological treatment and public health policy, is required, if we are to stem the tide of CVD in England.
References 31–59 are provided in online supplementary file.
Key questions
What is already known on this subject?
Cardiovascular disease remains an important cause of death and disability in women and men in England, even though it is largely preventable by managing modifiable risk factors. However, evidence is sparse on how cardiovascular risk factors have evolved over the past few years and whether there are differences between women and men in England.
What might this study add?
Sex differences in cardiovascular risk factors in England persist, with higher prevalence of smoking, overweight, hypertension, diabetes and dyslipidaemia in men than in women in 2017. The total number of risk factors declined more in women than in men. Treatment and control of hypertension, diabetes and dyslipidaemia improved over time, but there is still substantial progress to be made in both sexes. Treatment and control of diabetes and hypertension were comparable between sexes, while treatment and control of dyslipidaemia were lower in women. Physical activity and diet were not assessed in this study.
How might this impact on clinical practice?
More aggressive risk factor management is needed to stem the tide of cardiovascular disease in England, particularly improving treatment and control of hypertension, dyslipidaemia and diabetes and reducing the prevalence of obesity and smoking. This will likely require concerted efforts from multiple stakeholders and a combination of individual and population-based interventions to address the wider determinants of health.
Footnotes
Contributors All authors were involved in study conceptualisation and design. ACPG conducted the analysis and drafted the manuscript. All authors reviewed the manuscript. MW is the guarantor. The guarantor accepts full responsibility for the work and/or the conduct of the study, had access to the data and controlled the decision to publish. The corresponding author attests that all listed authors meet authorship criteria and that no others meeting the criteria have been omitted.
Funding ACPG was funded by the British Heart Foundation.
Disclaimer The funder had no influence on study conduct and reporting.
Competing interests All authors have completed the ICMJE uniform disclosure form at http://www.icmje.org/coi_disclosure.pdf and declare: no support from any organisation for the submitted work; no financial relationships with any organisations that might have an interest in the submitted work in the previous three years; no other relationships or activities that could appear to have influenced the submitted work. MW is a consultant to Amgen and Kirin; no other relationships or activities that could appear to have influenced the submitted work.
Patient and public involvement Patients and/or the public were not involved in the design, or conduct, or reporting, or dissemination plans of this research.
Patient consent for publication Not required.
Provenance and peer review Not commissioned; externally peer reviewed.
Data availability statement Data are available in a public, open access repository. All data are freely available in the public domain.