Article Text

Abstract
Objective To assess temporal clinical and budget impacts of changes in atrial fibrillation (AF)-related prescribing in England.
Methods Data on AF prevalence, AF-related stroke incidence and prescribing for all National Health Service general practices, hospitals and registered patients with hospitalised AF-related stroke in England were obtained from national databases. Stroke care costs were based on published data. We compared changes in oral anticoagulation prescribing (warfarin or direct oral anticoagulants (DOACs)), incidence of hospitalised AF-related stroke, and associated overall and per-patient costs in the periods January 2011–June 2014 and July 2014–December 2017.
Results Between 2011–2014 and 2014–2017, recipients of oral anticoagulation for AF increased by 86.5% from 1 381 170 to 2 575 669. The number of patients prescribed warfarin grew by 16.1% from 1 313 544 to 1 525 674 and those taking DOACs by 1452.7% from 67 626 to 1 049 995. Prescribed items increased by 5.9% for warfarin (95% CI 2.9% to 8.9%) but by 2004.8% for DOACs (95% CI 1848.8% to 2160.7%). Oral anticoagulation prescription cost rose overall by 781.2%, from £87 313 310 to £769 444 028, (£733,466,204 with warfarin monitoring) and per patient by 50.7%, from £293 to £442, giving an incremental cost of £149. Nevertheless, as AF-related stroke incidence fell by 11.3% (95% CI −11.5% to −11.1%) from 86 467 in 2011–2014 to 76 730 in 2014–2017 with adjustment for AF prevalence, the overall per-patient cost reduced from £1129 to £840, giving an incremental per-patient saving of £289.
Conclusions Despite nearly one million additional DOAC prescriptions and substantial associated spending in the latter part of this study, the decline in AF-related stroke led to incremental savings at the national level.
- atrial fibrillation
- oral anticoagulants
This is an open access article distributed in accordance with the Creative Commons Attribution Non Commercial (CC BY-NC 4.0) license, which permits others to distribute, remix, adapt, build upon this work non-commercially, and license their derivative works on different terms, provided the original work is properly cited, appropriate credit is given, any changes made indicated, and the use is non-commercial. See: http://creativecommons.org/licenses/by-nc/4.0/.
Statistics from Altmetric.com
Introduction
Atrial fibrillation (AF) is a common condition affecting around 2% of the general population, and it increases the risk of stroke fivefold.1 AF is thought to be the direct cause of around one-third of ischaemic strokes,2 and AF-related strokes constitute the most severe stroke subtype.3–5 Oral anticoagulation reduces the risk of stroke in high-risk patients with non-valvular AF.6 Both available classes of oral anticoagulants—vitamin K antagonists (most commonly warfarin) and direct oral anticoagulants (DOACs)—effectively reduce the risk of stroke. Additionally, the international thresholds for starting oral anticoagulation in people with AF have been lowered7–9 and the use of oral anticoagulation has increased, while the incidence of AF-related stroke has decreased.10 11 Nevertheless, substantial gaps remain in the numbers of eligible patients having AF diagnosed and being started on or maintained on appropriate oral anticoagulation.10 12 13
Given the rising prevalence of AF due to the ageing and increasingly multimorbid population, drug costs are a potentially important determinant of the wider implementation of oral anticoagulation for stroke prevention. DOACs have been estimated to account for 5% of the overall drug budget in England.14 Several analyses found that even with a substantial cost differential, DOACs would be cost-effective compared with other forms of oral anticoagulation and should be made available to patients.7 14–18 The National Institute for Health and Care Excellence (NICE) analysis, however, included the costs of replacing antiplatelet drugs, which are no longer recommended for patients with AF. Additionally, the evaluation coincided with a change in how stroke risk was assessed. Thus, there is a need to better understand the role of costs incurred by use of oral anticoagulation for AF-related stroke prevention at scale.
The UK is unique in that various national primary and secondary care databases exist in which prospectively collected data relating to clinical care and health outcomes over many years are collated and presented in consistent data fields. We used these data to investigate changes in the number of oral anticoagulation prescriptions and hospitalised AF-related stroke incidence, and the budget impacts of these changes.
Methods
This was a nationwide, multisource, electronic health record study and an associated budget impact analysis of changes in the incidence of AF-related stroke and in the prescription of oral anticoagulation for prophylaxis against stroke in patients with AF over the period 2011–2017. There was no public or patient involvement in this research.
Hospitalised AF-related stroke
The number of episodes of hospitalised AF-related stroke in England was accessed from the Hospital Episode Statistics (HES) data warehouse (copyright NHS Digital 2018, http://content.digital.nhs.uk/hes), in which each patient is given a unique identifying code and all data connected with a hospital admission, outpatient appointment or attendance in an emergency department are recorded. Eligible patients had a primary diagnosis of stroke (ischaemic, haemorrhagic or unspecified) and a secondary diagnosis of AF from 1 March 2010 to 28 February 2018 to ensure full coverage of the study period. Data were aggregated into weekly counts of the number of finished consultant episodes (total time a patient spends under the care of an individual consultant). Transfer to a different consultant team counts as a further episode, but may be tracked via the patient’s unique identifier. We counted episodes for transferred patients as replicate episodes and deleted them from each weekly record.
Stroke was defined according to the International Statistical Classification of Diseases and Related Health Problems, 10th edition (ICD-10) codes for ischaemic (I63.0–I63.9), haemorrhagic (I61.0–I61.9) and unspecified (I64.X) strokes. AF was defined with the ICD-10 code I48.X. Episodes of hospitalisation for patients with a primary diagnosis of non-traumatic intracranial bleeding (ICD-10 codes I60.0–I60.9, I62.0, I62.1 and I62.9) and a secondary diagnosis of AF were also identified. Unless specified, for this study, stroke incidence represents AF-related stroke (stroke as the primary diagnosis and AF as the secondary diagnosis).
Prescribing and prescribing costs
Prescribing data for England were extracted from the Business Services Authorities electronic Prescribing and Costing Tool ((ePACT) see online supplemental table S1). This national repository holds aggregated information about dispensed prescriptions according to the British National Formulary classification system. It also provides volumes and associated costs by general practitioner (GP) practice. The total number of items prescribed and costs of all branded and unbranded warfarin and DOACs were collected for each GP practice for January 2011–December 2017 (see online supplemental table S2). The search metrics were clinical commissioning group (CCG) each group commissions healthcare for a specified region in England), GP practice, small geographical areas based on postal codes, and drug pack code, drug name, year, total cost, total net ingredient cost and average net ingredient cost per quantity (see online supplemental table S3).
Supplemental material
AF prevalence
The national prevalence of AF was derived from the Clinical Domain of the Quality and Outcomes Framework (QOF) database for England. QOF is a national database that collects annual prevalence and treatment data for several conditions, including AF, from all GP practices in England at the end of March each year. Data for the QOF years from 1 April 2010 to 31 March 2018 were extracted to cover the entire study period.
Budget impact analysis
The per-patient healthcare costs in the first year following stroke were based on data from a UK study by Xu et al.1 The researchers included ambulance transport, MRI or CT scans, thrombolysis, acute stroke unit care, rehabilitation stroke unit care, general medical ward care, community rehabilitation, GP visits, secondary prevention and therapy for early supported discharge in the cost calculations where possible. They estimated a mean per-patient cost for care after acute stroke of £13 452, adjusted to 2017 values using the NHS Hospital and Community Health Service inflation index.19 This cost was congruent with that estimated by Youman et al 20 of £12 228, which was used in the 2014 NICE guidance for the management of AF.7 The value £13 452 was used in this study as the cost of management in the first year after stroke.
Given that the clinical indication for oral anticoagulation is not stated in ePACT, we employed the methods used in the NICE anticoagulation therapy commissioning guide21 to calculate the proportion of oral anticoagulants prescribed to treat AF and other disorders. For warfarin, first we extracted the annual prevalence of AF from QOF (range 1.5%–1.8%) and the annual prevalence of new venous thromboembolism (VTE), VTE needing long-term anticoagulation (0.3%) and other conditions requiring oral anticoagulation therapy (chronic rheumatic heart disease, antiphospholipid syndrome, cardiomyopathy and prosthetic heart valve; 0.37%) from the NICE commissioning guidance21 (see online supplemental tables S4 and S5). Second, we derived the annual prevalence of oral anticoagulation use among patients with AF through the 2011–2016 data in the Guidance on Risk Assessment Stroke Prevention in AF tool (PRIMIS, University of Nottingham, Nottingham, UK). The annual percentages of anticoagulation prescribed took into account changes in the population of England, the prevalence of AF, VTE and other conditions, and the prescriptions of oral anticoagulants to patients with AF over that period (see online supplemental table S5). (Of note, the rate of prescribing of oral anticoagulants for VTE did not change between 2009 and 2015.22) For DOACs, we removed any doses that were not licensed for AF.
We extracted the annual number of prescriptions of oral anticoagulants per CCG from ePACT and applied the estimated annual rate of those prescribed for AF to derive the total, warfarin and DOAC prescription rates for patients with AF. The costs associated with warfarin reflected the net ingredient cost as reported in ePACT. Warfarin doses are tailored depending on the international normalised ratio (INR). To estimate the cost of INR monitoring, the total dose in milligrams of warfarin prescribed per study year was divided by 365 to estimate the mean total daily dose. This was then divided by 4.5 (the mean treatment dose in milligrams as calculated by NICE3) to estimate the mean number of patients receiving warfarin. The default cost of INR testing used by NICE is £242 per patient7; therefore, we multiplied the mean number of patients by this value for each study year and summed the results. For DOACs, we used the NHS Electronic Drug Tariff basic prices per pack (see online supplemental table S3). The stroke-associated healthcare costs plus oral anticoagulant prescribing costs were calculated and compared for 2011–2014 and 2014–2017.
Analysis
The incidence of AF-related stroke, with and without standardisation for annual prevalence of AF reported in QOF, was estimated annually over the study period. Stroke incidence, ranked by size of CCG, was compared for the periods January 2011–June 2014 and July 2014–December 2017 to include sufficient numbers of strokes. The numbers of oral anticoagulant items prescribed for patients with AF are presented similarly.
Using Poisson regression models, we investigated whether, at the same time as change in warfarin and DOAC uptake, the incidence of AF-related stroke (all, ischaemic or haemorrhagic stroke) also changed. Prescription year, percentage of DOAC uptake for patients with AF and AF prevalence were included in the Poisson model. To account for between-CCG variation, CCGs were included as a random intercept. Year was included as a continuous variable. Results are presented as incidence rate ratios with 95% CIs.
Comparisons of total prescribing costs, per-patient care costs for AF-related stroke and all care between the two study periods were undertaken to understand the budget impact of oral anticoagulation use. Data are presented as absolute and percentage changes, and incremental costs are shown for the cost of oral anticoagulation prescribing alone and for the cost of stroke management plus oral anticoagulation prescribing.
All analyses were performed using R V.3.5.1 with a significance threshold of p=0.05.
Results
We obtained ePACT data from a mean of 8601 GP practices and QOF data from a mean of 8256 practices (online supplemental table S6). HES data were collected from 200 hospitals per year.
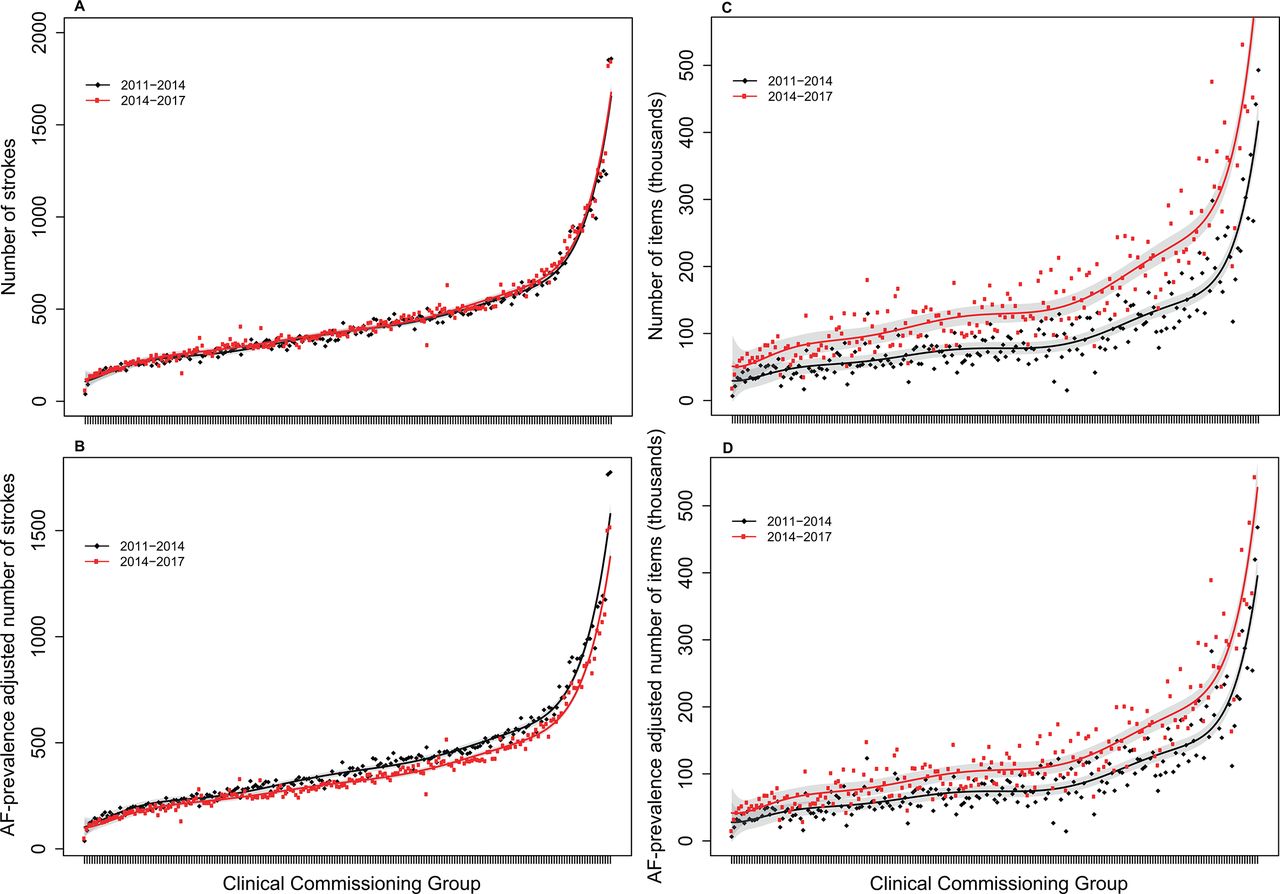
Without adjustment for AF prevalence, the incidence of AF-related stroke did not differ significantly between the periods 2011–2014 and 2014–2017 (figure 1A and online supplemental figures S1 and S2). After adjustment, the incidence of hospitalised AF-related stroke was significantly lower in 2014–2017 than in 2011–2014 (p<0.001, figure 1B). The lowest incidence of hospitalised AF-related stroke across CCGs was five strokes per year and the highest was 575 per year (median 108, IQR 77–150). Significantly more oral anticoagulant items were prescribed for patients with AF in 2014–2017 than in 2011–2014, irrespective of AF prevalence (unadjusted median 77 278 for 2011–2014 vs 128 129 for 2014–2017; adjusted median 73 368 for 2011–2014 vs 104 680 for 2014–2017; all p<0.001; figure 1C,D).

Incidence of hospitalised AF-related stroke and number of oral anticoagulant items prescribed in 2011–2014 vs 2014–2017, ranked by size of clinical commissioning group. (A) Unadjusted numbers of AF-related strokes. (B) Numbers of AF-related strokes adjusted for annual AF prevalence. (C) Unadjusted numbers of oral anticoagulant items prescribed for patients with AF. (D) Numbers of oral anticoagulant items prescribed for patients with AF adjusted for annual AF prevalence. Hospitalised patients with AF-related stroke had stroke as a primary diagnosis and AF as a secondary diagnosis recorded in the Hospital Episode Statistics database. Stroke incidence was adjusted for the AF prevalence reported per year in the Quality and Outcomes Framework, compared with the level at 2011. The red and black curves represent the fitted incidence or number of items for the two study periods, and the grey areas represent the 95% confidence bands. AF, atrial fibrillation.
The number of warfarin items prescribed increased by 5.9% (95% CI 2.9% to 8.9%) in 2014–2017 compared with 2011–2014 (figure 2A). By contrast, the number of DOAC items prescribed rose by 2004.8% (95% CI 1848.8 to 2160.7%, figure 2B).
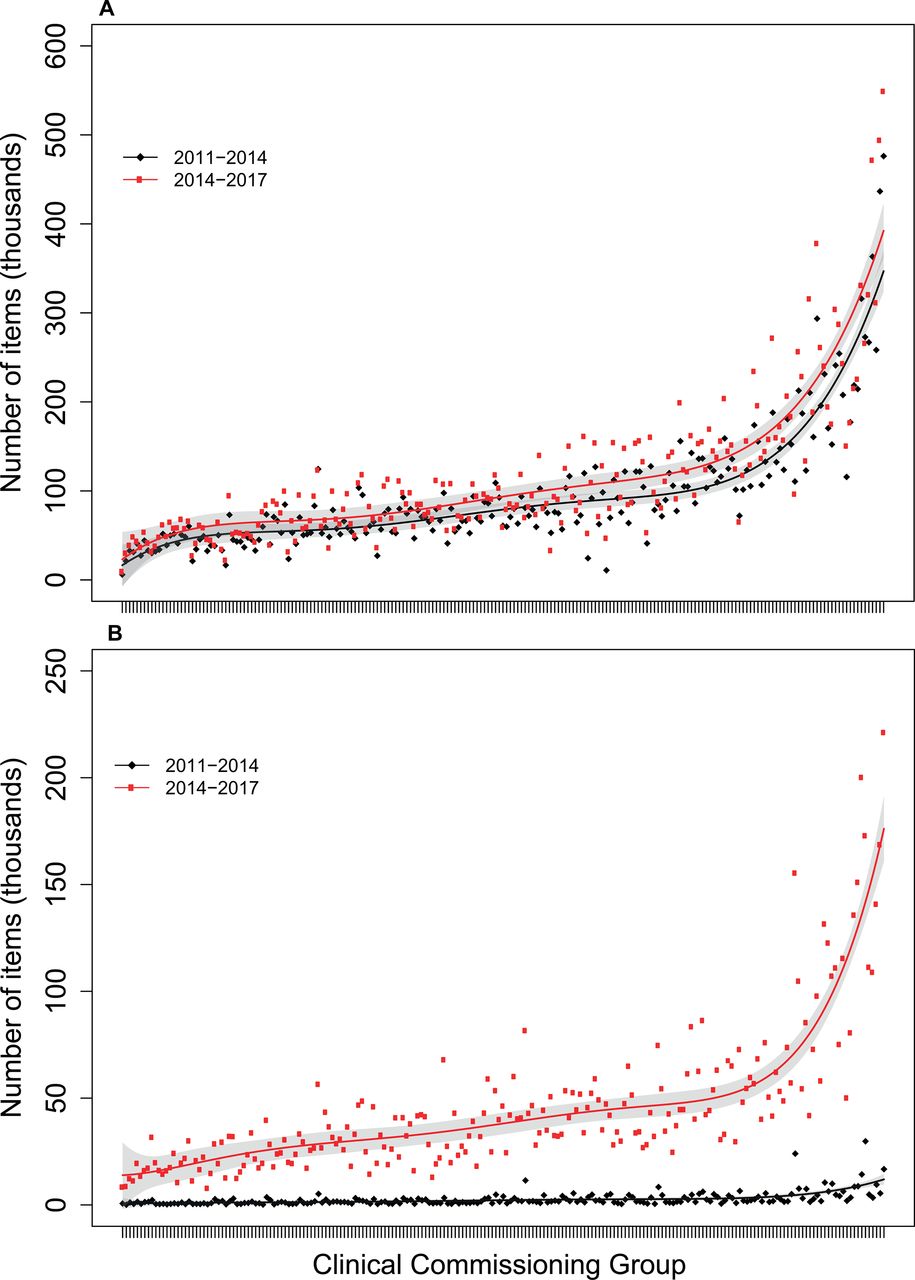
Total numbers of warfarin (A) and direct oral anticoagulant (B) items prescribed for patients with AF in 2011–2014 vs 2014–2017, ranked by size of clinical commissioning group. Data are derived from the National Health Service Business Services Authorities electronic Prescribing and Costing Tool. The red and black curves represent the fitted incidence or number of items for the two study periods, and the grey areas represent the 95% confidence bands.
The incidence of hospitalised AF-related stroke increased with time (table 1), but the proportion of DOAC items prescribed reduced the incidence of all AF-related stroke and ischaemic AF-related stroke. No difference was seen for haemorrhagic AF-related stroke (table 1).
Incidence rate ratios and 95% CIs for the impact of time and the proportion of DOAC items prescribed on hospitalised AF-related stroke incidence
Changes in stroke incidence and associated budget impacts are shown in table 2. AF-related stroke incidence fell by 11.3% (95% CI –11.1% to –11.5%) after being adjusted for AF prevalence. The calculated total spend on management in the year after stroke also fell by 11.3% (95% CI –11.1% to –11.5%). Between the two periods, there was a small change in the number of people receiving warfarin for AF, but those receiving DOACs increased by 1452.7%. The cost of DOAC prescriptions increased by 1273.7%, leading to an overall increase in spending on oral anticoagulant prescriptions of 781.2%. Consequently, these changes led to budget impact for costs of oral anticoagulant prescriptions and monitoring of £733 466 204.
Changes in hospitalised AF-related stroke incidence, prescribing of oral anticoagulants and budget impact
When per-patient costs within the two study periods were considered, the cost of oral anticoagulant prescriptions alone led to an incremental increase of £149 per patient in 2014–2017. However, after taking into account the fall in the cost of management in the first year after hospitalised AF-related stroke, the incremental overall cost of care fell in 2014–2017 to £289 below that in 2011–2014, leading to an incremental saving per patient at the national level.
Discussion
Statement for principal findings
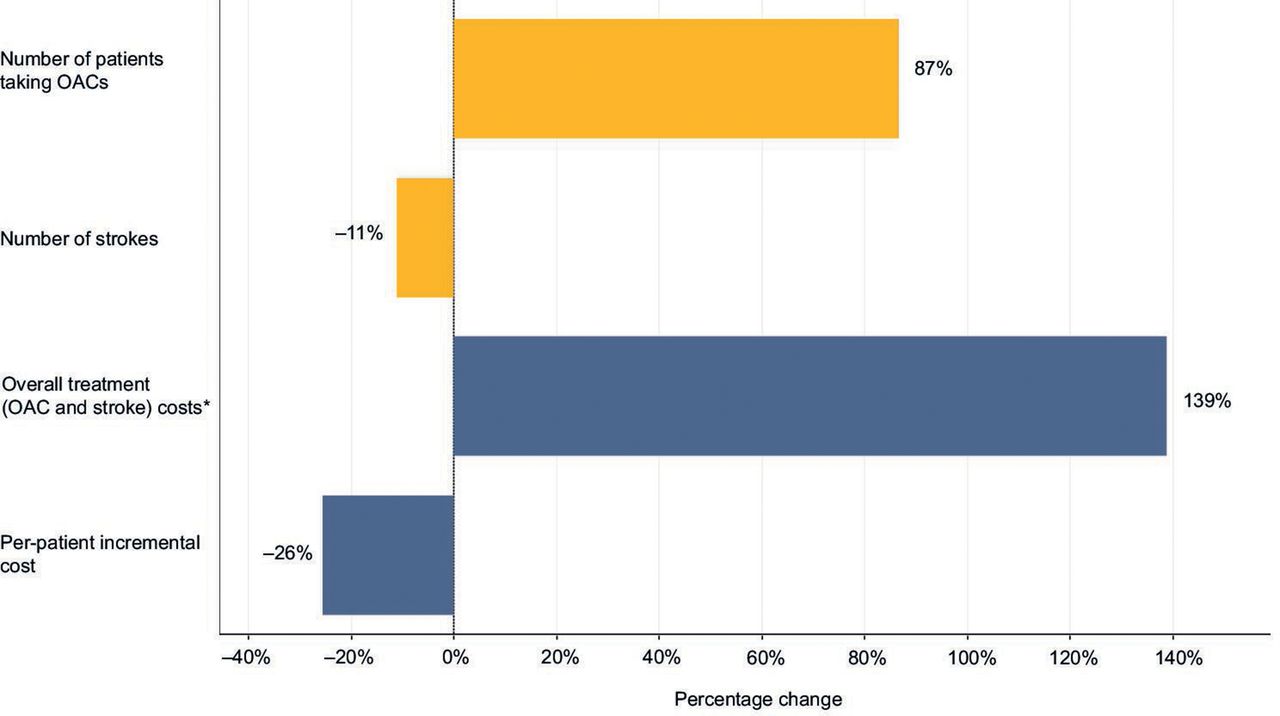
In this nationwide multisource health records evaluation, a substantial change in the number of DOAC prescriptions was seen in 2014–2017 compared with in 2011–2014, but little change was seen in the number of warfarin prescriptions. The associated overall budget impact of the changes in the numbers of oral anticoagulant prescriptions and INR monitoring was £733,466,204. Nevertheless, when the 11.3% reduction in AF-related stroke incidence was considered, an incremental per-patient saving to the overall healthcare system in England was seen (figure 3). More work is needed to investigate the patterns highlighted by this study.
Overall percentage changes in numbers of patients and strokes and in total and incremental per-patient treatment costs between 2011–2014 and 2014–2017. *Calculated as the total prescribing costs for direct oral anticoagulants, warfarin and international normalised ratio monitoring plus management in the first year after stroke. OAC, oral anticoagulation.
The substantial budget impact that we calculated in relation to DOAC prescribing is an important consideration for healthcare services. Not only are more patients with AF being treated, but also adoption of the CHA2DS2–VASc (congestive heart failure, hypertension, age ≥75 years, diabetes mellitus, stroke or transient ischaemic attack, vascular disease, age 65–74 years, sex category) score has broadened the threshold for identification of patients with AF at high risk of stroke and extended the pool eligible to receive oral anticoagulation.23 International guidance now recommends DOACs preferentially, and the number of new patients starting warfarin is falling.22 Although in this analysis the overall prevalence of warfarin prescription was higher than that of DOACs, this may change in the future. Because the cost of INR monitoring does not alter, the cost-effectiveness of warfarin prescribing is likely to decline as fewer patients require monitoring.
For the early period of our study, use of oral anticoagulation to treat AF was low in patients deemed to be at high risk of stroke despite assessment by CHA2DS2–VASc score or its predecessor CHADS2 (congestive heart failure, hypertension, age ≥75 years, diabetes mellitus, stroke (double weight)).24 25 Warfarin prescribing has also been noted to be inappropriately low in some subgroups of patients with AF at high risk of stroke yet overprescribed for some subgroups at low risk of stroke.25 Several national quality improvement initiatives, including changes to QOF in 2012, were made to incentivise GPs to use oral anticoagulants in preference to antiplatelet agents in patients with AF at high risk of stroke. This is illustrated in our study by the finding that around 1 million additional people with AF received oral anticoagulants in the latter period, substantially exceeding the prevalence rise of 351 165 patients with AF in the same period (see online supplemental table S4). This substantial rise in oral anticoagulant use was due partly to DOACs being increasingly prescribed to people newly diagnosed with AF22 26 and to elderly and/or frail patients.27 This finding suggests that the important opportunity gap for treatment is being successfully closed.
Finally, this analysis supports the use of DOACs for stroke prevention in real-world clinical practice. Increased uptake was found to impact on AF-related stroke with no effect on the rate of intracranial haemorrhage. This latter finding is in contrast to meta-analyses, which have indicated reductions in haemorrhagic stroke with increased DOAC use.28 29 The reasons for this difference are unclear. The overall stroke reduction might have been influenced by the uptake of DOACs for higher-risk groups of patients or by the increased uptake of oral anticoagulation therapy in general. Another possibility is that DOACs might have a more specific clinical benefit than vitamin K antagonists in real-world clinical practice that was not seen in randomised controlled trials, although the analyses do not enable us to distinguish between these possibilities.
Limitations
The study has various strengths, such as the 6-year study period, being a national level analysis and including data from multiple sources. However, it also has several important limitations. Stroke data in HES and prescribing data in ePACT are not linked, and the clinical condition for which a drug is prescribed is not indicated in ePACT. Therefore, we could not calculate accurately the numbers of people who were prescribed each drug type. We estimated the annual percentage of oral anticoagulant use in patients with AF versus other conditions using data from multiple national primary care sources. The large dataset, which includes every HES-recorded AF-related stroke in England during the study, and the large quantity of prescribing data lend robustness to this analysis. However, without data on factors such as changes in population demographics and management of other connected long-term conditions, such as hypertension, by lifestyle changes, more general confounders than accounted for could have influenced the results. Another limitation is that the numbers of strokes in individual years were too low to show differences robustly, and we had to compare data from two 3.5-year time periods. A third limitation is that because we were unable to attribute the number of strokes to either DOAC or warfarin separately, the association between strokes and DOAC uptake had to be estimated by Poisson regression. Being unable to link any causality, we could not adjust for the small proportions of non-stroke indications. Therefore, a formal cost-effectiveness calculation was inappropriate and the analyses are descriptive. Nevertheless, some patterns of interest emerged that suggest further economic analyses should be undertaken.
Conclusions
To our knowledge, this is the first nationwide investigation to assess how prescribing patterns for oral anticoagulation and AF-related stroke incidence have changed over time and to consider the potential clinical and budgetary impacts. On initial review, the decline in stroke incidence seems to be at the cost of a large direct budget impact. However, because adjustment for annual change in AF prevalence lowered the incidence of hospitalised AF-related stroke in 2014–2017, per-patient costs were reduced at the national level. Stroke reduction may be improved further by better detection, starting more patients on treatment and optimising treatment,30 and the cost-effectiveness of addressing these opportunities with DOACs should be assessed.
Key messages
What is already known on this subject?
Given the rising prevalence of atrial fibrillation (AF) with the ageing population, clear understanding of how resources are used and the effects on population health is needed.
What might this study add?
The UK is unique in that various national primary and secondary care databases exist in which prospectively collected data relating to clinical care and health outcomes over many years are collated and presented in consistent data fields. These data were used to assess in a novel way temporal changes in oral anticoagulation prescribing and AF-related stroke incidence, along with clinical and budget impacts during the same period.
How might this impact on clinical practice?
On initial review, the decline in stroke incidence seemed to be achieved at the cost of a large direct budget impact. However, because adjustment for annual change in AF prevalence lowered the incidence of hospitalised AF-related stroke in 2014–2017, per-patient cost reductions were revealed at the national level, which might be an important determinant in the wider implementation of oral anticoagulation for stroke prevention.
Acknowledgments
Open access to this paper was supported by Midlands and Lancashire Commissioning Support Unit. JW is supported by the National Institute for Health Research infrastructure at Leeds University. The views expressed are those of the author and not necessarily those of the NHS, the NIHR or the Department of Health.
References
Supplementary materials
Supplementary Data
This web only file has been produced by the BMJ Publishing Group from an electronic file supplied by the author(s) and has not been edited for content.
Footnotes
Twitter @andrzeio, @cpgale3
Contributors AO devised the study and CPG, JCC, JB and JW contributed to the methodology. AO, BP, JB, WS and JW undertook the analyses. RA wrote the first draft with input from AO and RS, and all authors contributed to revisions and editing.
Funding The authors have not declared a specific grant for this research from any funding agency in the public, commercial or not-for-profit sectors.
Competing interests AO received speaker honoraria from Pfizer and provided consultancy to Daiichi Sankyo. CPG received speaker and/or consulting honoraria from AstraZeneca, Bayer, Novartis, Daiichi Sankyo, Bristol Myers Squibb, Menarini and Pfizer, and research grant funding from Abbott and Bristol Myers Squibb.
Patient and public involvement Patients and/or the public were not involved in the design, or conduct, or reporting, or dissemination plans of this research.
Patient consent for publication Not required.
Ethics approval All data used in this study were anonymised and, therefore, ethics approval was not sought.
Provenance and peer review Not commissioned; externally peer reviewed.
Data availability statement Data are available upon reasonable request.