-
PDF
- Split View
-
Views
-
Cite
Cite
Simon P. McGuirk, John Stickley, Massimo Griselli, Oliver F. Stumper, Simon J. Laker, David J. Barron, William J. Brawn, Risk assessment and early outcome following the Norwood procedure for hypoplastic left heart syndrome, European Journal of Cardio-Thoracic Surgery, Volume 29, Issue 5, May 2006, Pages 675–681, https://doi.org/10.1016/j.ejcts.2006.01.061
Close - Share Icon Share
Abstract
Background: This study was undertaken to identify risk factors for early mortality following the Norwood procedure for hypoplastic left heart syndrome (HLHS) and develop a predictive risk model to monitor clinical performance. Methods and Results: Between December 1992 and June 2004, 333 patients with HLHS underwent a Norwood procedure at a single institution. The early mortality was 29% (n = 95). Estimated early mortality improved progressively and was 10% at the end of the series. Multivariable analysis identified that body surface area at operation, size of the ascending aorta, preoperative right ventricular function and source of pulmonary blood flow established at operation were risk factors for early mortality (P ≪ 0.05). These variables were included in a preoperative risk model. The duration of cardiopulmonary support was an independent risk factor, which was included in a separate operative risk model. The performance of the risk models was evaluated by goodness-of-fit analyses, using the Hosmer–Lemeshow test and receiver operating characteristic (ROC) curve. Both models were well calibrated across all deciles (P = 0.64, P = 0.77) and discriminated moderately well. The area under the ROC curve was 0.71 for Model 1 and 0.75 for Model 2. Risk adjustment broadly accounted for the variation in early mortality observed during this series. Conclusions: Patient-related and predetermined operative variables have a major influence on the early outcome following the Norwood procedure for HLHS. The identification of these risk factors allows the risk of early mortality to be calculated. This information could be applied as part of a risk-adjusted performance-monitoring system to enable early identification of meaningful changes in practice.
1 Introduction
The management of hypoplastic left heart syndrome (HLHS) represents one of the greatest challenges in paediatric cardiac surgery. The optimal surgical management for these patients remains controversial. Staged surgical palliation has gained increasing acceptance as the primary treatment option for these patients, although alternative strategies, such as neonatal orthotopic heart transplantation, have been advocated [1].
There has been a substantial improvement in the surgical outcome in patients with HLHS since the Norwood procedure was introduced. Early survival following the Norwood procedure in contemporary series ranges between 73 and 80% [2–4], although an increasing number of centres have reported hospital survival rates of more than 90% [5,6]. Nevertheless, the Norwood procedure remains one of the highest risk procedures in paediatric cardiac surgery [7].
This study was undertaken to identify the anatomic and technical factors that influenced early outcome following the modified Norwood procedure, based on our 12-year single-institution experience. We sought to develop a simple predictive risk model to account for differences in case mix and surgical technique, which could be used to monitor the on-going clinical performance.
2 Materials and methods
Between December 1992 and June 2004, 333 consecutive patients (219 (66%) males and 114 females) with HLHS underwent a Norwood procedure at Birmingham Children's Hospital, UK [8]. The diagnosis of HLHS was based on detailed two-dimensional echocardiography. The majority of patients had classical HLHS (n = 290, 87%) and the remaining 43 patients had a HLHS variant characterised by left ventricular hypoplasia and systemic outflow tract obstruction.
The median diameter of the ascending aorta was 3.0 mm (range, 1.0–10.0 mm), and was ≦2.0 mm in 82 patients (25%). Fifty-four patients (16.2%) had additional cardiac abnormalities including interrupted aortic arch, abnormal systemic or venous drainage, or congenital heart block. Fourteen patients (4.2%) were premature (gestational age ≪ 37 weeks) and 18 patients (5.4%) were originally diagnosed with additional major structural abnormalities or genetic anomalies. Ninety-two patients (28%) had impaired right ventricular function on preoperative echocardiography.
The Norwood procedure was performed at a median age of 4 days (range, 0–217 days). The majority (n = 265, 80%) were operated within the first 7 days and only 13 patients (3.9%) were operated at ≫30 days of age. The median weight at operation was 3.1 kg (range, 1.7–6.6 kg). The weight at operation Z score was −1.17 ± 1.22, based on the British 1990 reference population [9]. The median body surface area (BSA) at operation was 0.20 m2 (range, 0.14–0.33 m2).
All operations were performed by one of the three surgeons using deep hypothermic cardiopulmonary bypass (CPB) with periods of circulatory arrest (DHCA) for arch reconstruction [8]. Antegrade cerebral perfusion was introduced in September 2002 and used during arch reconstruction in 72 patients (22%). The median duration of CPB, aortic cross-clamp and DHCA were 71 min (range, 17–323 min), 51 min (range, 0–109 min) and 55 min (range, 0–121 min), respectively. The median period of cardiopulmonary support (the cumulative duration of CPB and DHCA) was 121 min (range, 20–414 min).
The arch was reconstructed using one of the two established techniques [8]. The original technique involved arch reconstruction without additional patch material (n = 129, 39%). The second technique, used exclusively since April 1999, involved arch reconstruction with a pulmonary homograft patch (n = 204, 61%).
Pulmonary blood flow was established using a systemic to pulmonary artery (systemic–pulmonary) shunt (n = 260, 78%) or a right ventricle to pulmonary artery (RV–PA) conduit (n = 73, 22%) [8]. The systemic–pulmonary shunt generally consisted of a right modified Blalock–Taussig shunt (RMBTS; n = 258, 99.2%). The median diameter of the RMBTS was 3.5 mm (range, 3–5 mm) and the mean shunt diameter indexed to body weight was 1.07 ± 0.18 mm kg−1. Two patients had an anomalous right subclavian artery arising from the descending thoracic aorta. In these cases, the systemic–pulmonary shunt was created using a 3-mm tube conduit between the proximal main pulmonary artery or the aortic arch and the right pulmonary artery. The RV–PA conduit was introduced in March 2002 and involved a tube conduit that passed to the left (n = 17, 5.1%) or right (n = 56, 17%) of the neo-aortic reconstruction. The median diameter of the RV–PA conduit was 5 mm (range, 4–5 mm) and the mean indexed shunt diameter was 1.65 ± 0.30 mm kg−1.
Three epochs were defined based on the techniques used to reconstruct the aortic arch and establish pulmonary blood flow. Between December 1992 and April 1999 (Epoch 1, n = 168), the aortic arch was reconstructed without additional material and pulmonary blood flow was supplied by a systemic–pulmonary shunt. Between April 1999 and March 2002 (Epoch 2, n = 86), the aortic arch was reconstructed with a pulmonary homograft patch and pulmonary blood flow was supplied by a systemic–pulmonary shunt. Finally, between March 2002 and June 2004 (Epoch 3, n = 79), the aortic arch was reconstructed with a pulmonary homograft patch and pulmonary blood flow was established using a RV–PA conduit.
2.1 Data analysis
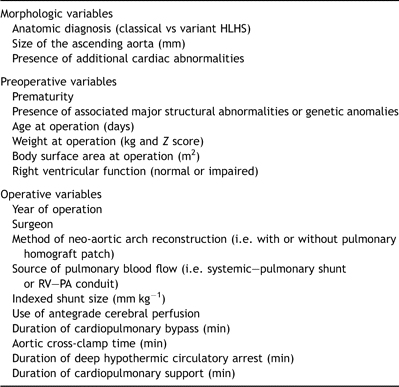
This was a retrospective study based on the review of hospital records and operation notes. Early mortality (in-patient or 30-day) following the Norwood procedure was the primary outcome measure. This was evaluated with reference to a series of morphologic, preoperative and operative variables (Table 1). Complete data were available for 332 patients. Follow-up was complete with a median interval of 3.7 years (range, 32 days to 11.3 years).
Data were examined by analysis of variance using SPSS for Windows (version 12, SPSS Inc., Chicago, IL, USA). Binomial and ordinal data have been expressed as percentage. Continuous data have been expressed as mean ± standard deviation or median (range). The effect of variables on early mortality was independently examined using the χ2-test, two-sided Fisher exact test or binomial logistic regression. A non-linear relationship has been reported between certain continuous variables, such as age and duration of CPB, and early mortality [10]. In this study, continuous variables were analysed as fractional polynomials of the data. Variables with a univariable probability value, P ≦ 0.1, were included in a stepwise logistic regression model. The results of these multivariable analyses have been expressed as logistic coefficients ± standard error for variables with a probability value, P ≪ 0.05.


The performance of each risk model was evaluated using goodness-of-fit analyses. Calibration was assessed using the standardised mortality rate (SMR) and the Hosmer–Lemeshow (H–L) test. Discrimination was assessed using the receiver operating characteristic (ROC) curve.
An estimate of early mortality over time was calculated using an exponentially weighted moving average (EWMA), in which previous observations were systematically down-weighted by 5% per case [11]. The EWMA was originally applied by de Leval et al. [11] to illustrate changes in early mortality during a series of neonatal arterial switch operations for transposition of the great arteries. This technique discounts more remote results and emphasises current experience. With a 5% memory loss, the experience with the 14th previous patient carries about half the weight of the last patient seen. The 95% confidence intervals (CI) for each estimate were calculated using the method (Method 3) described by Newcombe [12].
Changes in early mortality were analysed using two cumulative sum (CUSUM) charts, the cumulative observed minus expected (O–E) plot [13], and the two-sided log-likelihood ratio CUSUM (LLR-CUSUM) [14,15]. The expected outcome was defined as the average 30-day mortality or risk-adjusted 30-day mortality, calculated using Model 1 or Model 2.
Exact estimates for the probabilities of occurrence have been calculated for the cumulative O–E plots, using the method described by Sherlaw-Johnson et al. [16]. The percentile ranges corresponding with these estimates have been plotted in a continuous fashion to provide a guide for the interpretation of these CUSUM charts.
The two-sided LLR-CUSUM consists of two separate one-sided charts, which are plotted jointly [14,15]. The upper chart is designed to determine whether the outcome has deteriorated, which we defined as a doubling in the odds of death. The lower chart is designed to detect an improvement in outcome, which we defined as a halving in the odds of death. Each chart is similar to a sequential probability ratio test (SPRT), which Spiegelhalter et al. [17] used to illustrate how relatively poor performance at Bristol Royal Infirmary might have been identified earlier.
The two-sided LLR-CUSUM is designed to monitor a process sequentially until sufficient evidence of change in outcome has been acquired. This is the point when the chart crosses the upper (b) or lower (a) horizontal boundary threshold. These thresholds were calculated from pre-specified values for notional type I (α*) and type II (β*) error rates [14,17]. Separate alert and alarm thresholds were calculated to reflect different degrees of clinical importance. The alert threshold was set at α* = β* = 0.05 and the alarm threshold at α* = β* = 0.01.
The upper and lower charts are constrained to lie above and below zero in order to make each chart more sensitive to changes in outcome [14,15]. However, strict interpretation of type I and type II error rates is lost. The performance of the LLR-CUSUM is measured in terms of the average run length (ARL) before a conclusion can be drawn when the process is in control or out of control. The in-control and out-of-control ARL are analogous to the type I and type II error rates, respectively [14,15]. The ARL for upper (ARL+) and lower (ARL−) alarm thresholds were estimated using the Markov chain methodology with a multiplier of 300 [14,15]. This multiplier was chosen, using the method illustrated by Grigg et al. [14], to minimise the error associated with the ARL calculation. The in-control ARL for the two-sided LLR-CUSUM (ARLc) was approximated from ARL+ and ARL−[14].
3 Results
3.1 Unadjusted data
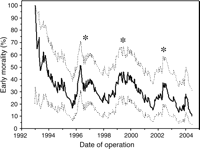
Early mortality following the Norwood procedure was 29% (n = 95). Between December 1992 and September 1995, the estimated early mortality (95% CI) declined from 100% (21–100%) to 17% (6–38%). The estimated early mortality continued to improve throughout the series and was 10% (3–30%) in June 2004 (Fig. 1). The EWMA also identified three periods () during which there was a relative deterioration in early outcome.

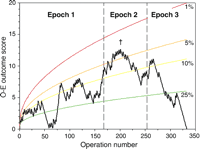
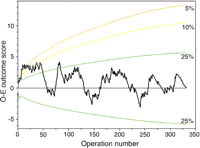
The cumulative unadjusted O–E plot demonstrated that this series comprised two distinct phases (Fig. 2). During the first phase, the observed mortality exceeded the expected mortality and the O–E score increased progressively. The O–E score peaked in April 2000 (†), at which point there were 12.7 excess deaths. This point lay within the upper 1–5% tail of the O–E plot. During the subsequent phase, the observed mortality was less than the expected mortality and the O–E score returned to zero. The decline in observed mortality was more rapid and consistent in Epoch 3.
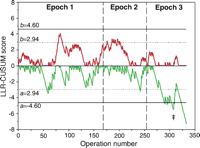
The two-sided unadjusted LLR-CUSUM is illustrated in Fig. 3. The upper chart crossed the alert threshold (b = 2.94) once in Epoch 1 and six times during Epoch 2. However, there was no evidence for an increased risk during the series, as the upper alarm threshold (b = 4.60) was never crossed. The lower chart crossed the alert threshold (a = −2.94) in Epoch 1, Epoch 2 and twice in Epoch 3. In addition, the chart crossed the alarm threshold (a = −4.60) during Epoch 3 (†). This alarm threshold was first crossed in May 2002 (operation 290) and the chart has remained below this threshold since August 2003 (operation 323). This finding represents a substantial, sustained and real improvement in early outcome during the latter part of the series. The in-control ARLc was 1302. The out-of-control ARL+ and ARL− were 70 and 100, respectively.
3.2 Risk modelling and risk adjustment
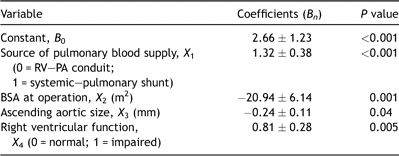
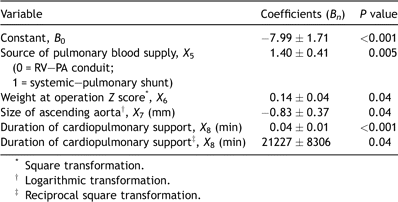
Multivariable analysis identified four preoperative variables that were included in Model 1 (Table 2). These were the source of the pulmonary blood supply (X1), BSA (X2), size of the ascending aorta (X3) and preoperative right ventricular function (X4). Multivariable analysis also identified four preoperative or operative variables that were included in Model 2 (Table 3). These were the source of the pulmonary blood supply (X5), weight at operation Z score (X6), size of the ascending aorta (X7) and duration of cardiopulmonary support (X8).
The mean predicted mortality derived using Model 1 and Model 2 was 28.3% and 27.6%, respectively. Both models predicted a marked variation in the risk-adjusted probability of early mortality, ranging 1.2–77% (median 27%) in Model 1 and 2.8–100% (median 21%) in Model 2.
Goodness-of-fit analyses demonstrated that both models were well calibrated. The SMR was 1.00 and 1.03 and the H–L test statistic was 6.03 (P = 0.64) and 4.84 (P = 0.77), respectively. The calibration remained consistent across all deciles. Both models had moderate discrimination characteristics with an area under the ROC curve (95% CI) of 0.71 (0.65–0.77) for Model 1 and 0.75 (0.69–0.81) for Model 2.
3.3 Risk-adjusted data
Risk adjustment broadly accounted for the changes in outcome observed in the unadjusted data. The risk-adjusted cumulative O–E plot for Model 1 is illustrated in Fig. 4. The risk-adjusted scores were closer to the expected, ranging between −2.4 and 4.9 excess deaths. These scores lay primarily between the upper and lower 25% tails of the plot. Comparable findings were also evident with Model 2.
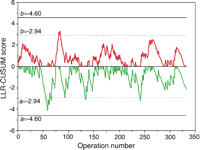
The two-sided risk-adjusted LLR-CUSUM for Model 1 is illustrated in Fig. 5. The risk-adjusted chart remained within the upper or lower alarm thresholds throughout the monitoring period. This finding confirms that risk adjustment was able to account for the divergent performance observed in Fig. 3. Risk adjustment did not account for all variations in outcome. The upper alert threshold was crossed once and the lower alert threshold was crossed four times. The cause of these chart signals was not apparent, although none represented a substantial change in performance. Similar findings were also observed using Model 2.
The in-control ARLc for the risk-adjusted LLR-CUSUM was 1541. Based on our current activity, this chart could run for many decades before a false-positive alarm might be expected. By contrast, the out-of-control ARL+ and ARL− were 83 and 110, respectively. This means that divergent practice would be identified within approximately 2 years.
4 Discussion
This study has reported the early outcome following the modified Norwood procedure for HLHS in a series of 333 patients. This represents the entire, unselected experience with the surgical management of HLHS at our unit, since its inception in December 1992 until June 2004. The early mortality in this series was 29%. This figure is comparable with other published reports [2–4]. In addition, we have reported a substantial and sustained improvement in early mortality. The EWMA estimate of early mortality decreased to 10% by the end of this series. This finding is consistent with more recent studies, which have reported hospital survival rates of 90% or more [5,6].
A number of authors have reported a similar improvement in the outcome following the Norwood procedure over time [2,3,18]. A variety of reasons have been postulated to explain this ‘era effect’, including increasing antenatal diagnosis, improved perioperative management and modifications in surgical technique [2,3]. In our experience, the improvement in early mortality was primarily attributable to the introduction of the RV–PA conduit as the source of pulmonary blood flow.
The Norwood procedure with RV–PA conduit represents one of the most important recent developments in the management of HLHS [19]. The principle advantage of this modification is that it abolishes the diastolic ‘runoff’ from the systemic to the pulmonary circulation, which characterises the systemic–pulmonary shunt. This raises diastolic pressure, increases coronary perfusion pressure and may ensure a more stable balance between the systemic and pulmonary circulations [20]. Pizarro et al. [6] demonstrated that the RV–PA conduit was associated with a better early outcome following the Norwood procedure. In this series, the odds of death halved following the introduction of the RV–PA conduit. Multivariable analyses also demonstrated that the RV–PA conduit was associated with a substantial improvement in early outcome, which was independent of other risk factors.
Several other risk factors for mortality following the Norwood procedure have been reported. These include prematurity, lower weight, older age, anatomic subtype, inadequate preoperative resuscitation or the presence of additional cardiac, extra-cardiac or chromosomal abnormalities [2–4,18,21,22]. In our experience, early outcome was independently associated with the patient's BSA or weight, the size of the ascending aorta and the preoperative right ventricular function.
Low birth weight is a risk factor for death after many cardiac surgical procedures, including the Norwood procedure [2,3,18,21,22]. Weinstein et al. [21] reported that the operative mortality following the Norwood procedure for patients weighing ≦2.5 kg was 51% compared with an overall early mortality of 26% at their institution. More recent reports suggest that the outlook for these patients may have improved [3], especially following the introduction of the RV–PA conduit [19].
There is contradictory evidence about the influence of morphologic variables on outcome following the Norwood procedure. The size of the ascending aorta has been the subject of considerable debate [2–4,18,22]. In this study, a diminutive ascending aorta was associated with an increased risk of early mortality, which was not influenced by the technique used to reconstruct the neo-aortic arch. These findings probably reflect the continued difficulty in establishing an unobstructed coronary blood flow in patients with a small ascending aorta [18,22].
The preoperative condition of patients has a profound effect on surgical outcome. Abnormal preoperative right ventricular function, in particular, is associated with an increased risk of early mortality [2,3,21]. We were not able to determine the cause of right ventricular dysfunction in this series. It might have reflected inadequate or incomplete preoperative resuscitation or diminished coronary perfusion. Nevertheless, this finding emphasises the importance of aggressive and complete resuscitation before the Norwood procedure is performed.
The duration of DHCA has also been associated with an increased mortality after the Norwood procedure [5,22]. Modified perfusion techniques, such as antegrade cerebral perfusion, might improve the outcome by reducing the duration of ischaemia. However, perfusion technique did not influence early mortality in this series. By contrast, the duration of cardiopulmonary support was an independent risk factor. This is in keeping with previous reports and probably reflects the increased risk associated with longer and more complex procedures [3,10].
Routine monitoring of results has an increasingly important role to play in the provision of safe and effective medical care. In paediatric cardiac surgery performance monitoring might improve the likelihood of survival and reduce the risk of serious complications. However, performance monitoring in paediatric cardiac surgery is intrinsically difficult because of the wide variation in case mix. A variety of methods have been advocated to overcome this problem, including reporting benchmark procedures [23]; stratifying procedures into risk groups [7]; or adjusting for the complexity of the procedure [24]. Fundamental objections have been raised about the validity of each of these methods [25].
This study has established that a limited number of preoperative and known operative variables can reliably predict the early outcome following the Norwood procedure for HLHS. The outcome predicted using the preoperative model varied markedly between individual patients. For example, the expected early mortality for patients with BSA of 0.24 m2, 5 mm ascending aorta, good ventricular function and undergoing a Norwood procedure with RV–PA conduit is 11%. In contrast, the expected early mortality for a patient with BSA of 0.16 m2, 1.5 mm ascending aorta, impaired ventricular function and undergoing a Norwood procedure with systemic–pulmonary shunt is 47%. This is clinically important information, which could help counsel parents about the likely risk of death. Nevertheless, the patient's preoperative risk is modified by intraoperative events [3]. The inclusion of the duration of cardiopulmonary support in the operative risk model improved the ability of the risk model to discriminate between patients who died and survived.
The preoperative and operative risk models were incorporated into a system to monitor the clinical effectiveness of the Norwood procedure for HLHS, which could account for differences in case mix and surgical technique. This monitoring system used separate and complementary CUSUM charts to sequentially monitor the cumulative performance over time. We believe that this risk-adjusted performance-monitoring system could be prospectively applied to identify problems early, evaluate the effectiveness of new procedures or compare practice within a single institution or amongst a number of institutions.
5 Study limitations
The retrospective design of this study precluded the assessment of risk factors not entered in the model. Complete data on known risk factors for early mortality, such as antenatal diagnosis and tricuspid regurgitation, were not available for many patients and were not included in the analysis. We also identified a high level of correlation between some of the variables, which may have confounded the multivariable analysis and prevented us from identifying independent associations between variables and early outcome.
The risk models described in this study reflect the population from which they were derived. Although internally consistent, they are speculative and have not been validated on an independent population. Internal and external validation studies are required to clarify the predictive abilities of these models. It would be advantageous to omit subjective risk factors, such as impaired right ventricular function, from the model in order to eliminate the potential for gaming. Great care should be exercised when considering the application of this information for patient prognostication because there is a substantial variation in the early mortality risk for each individual patient.
The Norwood procedure for HLHS remains a relatively infrequent procedure. Consequently, a monitoring system could run for a considerable period before a conclusion is reached. Nevertheless, we believe that this caveat should not preclude their application as part of routine clinical monitoring. We would advocate the inclusion of ‘alert’ thresholds that might be used to identify apparent changes in practice that merit more systematic evaluation.
6 Conclusion
This study has reported the early outcome for 333 consecutive patients with HLHS undergoing the Norwood procedure over a 12-year period. There was marked variation in the expected early outcome for these patients. Much of this heterogeneity was attributable to patient-related variables, over which the medical and surgical teams have little control. The individual patient risk was also influenced by operative variables. In particular, the introduction of the RV–PA conduit was associated with a substantial and sustained improvement in early outcome, which was independent of the other risk factors. The data allowed the development of two risk models, which described the risk of early mortality following the Norwood procedure in patients with HLHS. We believe that this information could be instituted as part of a performance-monitoring system to allow the early identification of other meaningful changes in clinical practice.
Exponentially weighted moving average estimate of early mortality with 5% down-weighting per case, plotted with 95% confidence intervals. There was a progressive improvement in early mortality throughout the series. There were three periods (

Cumulative unadjusted observed minus expected plot. Expected early mortality was the average 30-day mortality for the entire series (29%). Percentile ranges corresponding to exact estimates that the observed data might have occurred by chance have been plotted simultaneously. During the first part of the series, the plot moved upwards to a peak (†) because observed mortality was greater than expected. During the subsequent phase, the plot moved progressively downwards as observed mortality was less than expected.
Cumulative unadjusted two-sided log-likelihood ratio CUSUM chart. The upper chart was designed to detect a doubling in the odds of death and the lower chart was designed to detect a halving in the odds of death. Expected early mortality was the average 30-day mortality for the entire series (29%), as in Fig. 2. Each charts move upwards if observed mortality is greater than expected and downwards if observed mortality is less than expected. Doubling the odds of death is detected when the upper chart crosses the upper (b) horizontal boundary threshold whereas halving the odds of death is detected when the lower chart crosses the lower (a) horizontal boundary threshold. These boundary thresholds were constructed from notional type I and type II error rates. There was a substantial improvement in early mortality during Epoch 3 (†) as the lower chart crossed and remained below the lower alarm threshold (a = −4.60).
Cumulative risk-adjusted observed minus expected plot. Data are presented in a similar format to Fig. 2. Patient-specific expected early mortality was estimated using Model 1. The risk-adjusted data was much closer to expected, generally lying between the upper and lower 25% tails of the plot.
Cumulative risk-adjusted two-sided log-likelihood ratio CUSUM chart. Data are presented in a similar format to Fig. 3. Patient-specific expected early mortality was estimated using Model 1, as in Fig. 4. The risk-adjusted data showed no evidence for doubling or halving the odds of death as the upper and lower charts remained within the upper and lower boundary thresholds.
Table 1. Potential predictors of early mortality included in logistic regression analyses
Table 2. Risk model (Model 1) for early mortality following Norwood procedure
Table 3. Risk model (Model 2) for early mortality following Norwood procedure
The authors would like to thank Dr Chris Sherlaw-Johnson, University College London, London, Dr Olivia Grigg and Dr David Spiegelhalter, MRC Biostatistic Unit, Cambridge, for their advice and support with the statistical analyses.
Simon McGuirk was supported by a British Heart Foundation Junior Research Fellowship (FS/03/102).
References
- hypoplastic left heart syndrome
- pulmonary circulation
- ascending aorta
- repair of single ventricle with aortic outflow obstruction and aortic arch hypoplasia (hypoplastic left heart syndrome) (eg, norwood procedure)
- operative risk
- preoperative care
- risk adjustment
- risk assessment
- ventricular function, right
- mortality


