


Abstract
Aims To study recovery of segmental wall thickening (SWT), ejection fraction (EF), and end-systolic volume (ESV) after acute myocardial infarction (AMI) in patients who underwent primary stenting with drug-eluting stents. Additionally, to evaluate the predictive value of magnetic resonance imaging (MRI)-based myocardial perfusion and delayed enhancement (DE) imaging.
Methods and results Twenty-two patients underwent cine-MRI, first-pass perfusion, and DE imaging 5 days after successful placement of a drug-eluting stent in the infarct-related coronary artery. Regional myocardial perfusion and the transmural extent of DE were evaluated. A per patient perfusion score was calculated and consisted of a summation of all segmental scores. Myocardial infarct size was quantified by measuring the volume of DE. At 5 months after AMI, cine-MRI was performed and SWT, EF, and ESV were quantified. EF increased from 48±11 to 55±9% (P<0.01). SWT at 5 months was inversely related to baseline segmental DE scores (P<0.001) and segmental perfusion scores (P<0.001). EF and ESV at 5 months were related to acute infarct size (R2=0.65; P<0.001 and R2=0.78; P<0.001, respectively) and the calculated perfusion score (R2=0.23; P=0.02 and R2=0.14; P=0.09, respectively) at baseline.
Conclusion Marked recovery of left ventricular function was observed in patients receiving a drug-eluting stent for AMI. DE imaging appears to be a better prognosticator than perfusion imaging.
Introduction
At present, the preferred reperfusion treatment for patients with acute myocardial infarction (AMI) is early primary angioplasty with the placement of a drug-eluting stent in the infarct-related coronary artery.1–3 Early restoration of coronary blood flow by primary angioplasty salvages myocardium at risk and reduces infarct size, but may also lead to distal embolization and microvascular plugging, resulting in microvascular obstruction.4,5 These regions with microvascular obstruction within the infarcted myocardium can be detected by first-pass perfusion imaging performed with magnetic resonance imaging (MRI).6 Total myocardial infarct size (region with myocyte necrosis) and the transmural extent of infarction can be demonstrated with delayed enhancement (DE) imaging performed 10–20 min following perfusion imaging.7 Although previous studies demonstrated the value of perfusion and DE imaging for predicting regional and global myocardial function at long-term follow-up after AMI,8–13 the results of these studies have been equivocal. Differences in outcome may have been caused by differences in reperfusion therapy, time to reperfusion, and timing of baseline scan. In the present study, a well-defined group of patients who suffered AMI underwent myocardial perfusion and DE imaging 5 days after primary stenting with a drug-eluting stent. Specifically, we studied segmental wall thickening (SWT), ejection fraction (EF), end-systolic (ESV) and end-diastolic volume (EDV) at 5 months after AMI. Additionally, we investigated the predictive values of perfusion and DE imaging.
Methods
Patient population
Patients with an AMI who received a drug-eluting stent in the infarct-related coronary artery within 6 h of onset of symptoms were possible candidates for the present study. Inclusion of patients was hampered by the fact that patients referred from other hospitals were transferred back within a few hours after primary angioplasty. Eventually, we studied 30 patients (25 male, 53±10 years old) admitted to the coronary care unit with AMI. Three possible candidates refused to participate: one patient was visiting from another country, two patients were claustrophobic. Diagnosis of AMI was based on clinical symptoms, ST-segment elevation on electrocardiogram, and angiographically demonstrated occlusion of a coronary artery. All culprit lesions were stented with a drug-eluting stent within 6 h (mean 2.5 h) of onset of symptoms. Thrombolysis in myocardial infarction (TIMI) flow grade 3 was obtained in all vessels. Exclusion criteria consisted of any contraindication to MRI. All participants gave informed consent to the study protocol, which was approved by the medical ethics committee of the Erasmus MC, Rotterdam. Of the original study population, 22 patients had the first MRI scan 5±3 days after admission and the second MRI scan 20±7 weeks later. Eight patients did not undergo a second scan: one patient died of a stroke (non-cardiac death), two patients had a defibrillator implanted, and five patients refused to come back.
MRI protocol
A clinical 1.5 T MRI scanner with a dedicated cardiac four-element phased-array receiver coil was used for imaging (Signa CV/i, GE Medical systems, Milwaukee, WI, USA). Repeated breath-holds and gating to the electrocardiogram were applied to minimize the influence of cardiac and respiratory motion on data collection. The first ce-MRI protocol consisted of cine-MRI, first-pass perfusion imaging, and DE imaging. The second MRI protocol consisted of cine-MRI alone.
SWT and left ventricular volumes were assessed with cine-MRI using a steady-state free-precession technique (FIESTA) with the following imaging parameters: 6–10 s per breath-hold per slice (depending on heart rate); 24 phases per slice location; field of view (FOV), 36×36 cm2; TR, 3.4; TE, 1.4; flip angle, 45°; matrix, 160×128; bandwidth, 83 kHz; 0.75 NEX. To cover the entire left ventricle, 9–12 consecutive slices of 8 mm were planned in short axis view (gap of 2 mm) perpendicular to the horizontal long axis (four-chamber view) of the left ventricle.
First-pass perfusion imaging was performed during 30–40 consecutive heart beats after administration of gadolinium-DTPA (0.1 mmol/kg, Magnevist®, Schering, Berlin, Germany). The pulse sequence consisted of a preparation sequence followed by an interleaved gradient-echo echo-planar sequence.14 The temporal resolution per slice was 120 ms and allowed imaging of five to eight slices within each R–R interval, depending on the heart rate. The following imaging parameters were used: FOV, 36×36 cm2; rectFOV, 0.75; TR, 6.8; TE, 1.2; ET, 4; bandwidth, 125 kHz; flip angle, 20°; matrix, 128×96. Perfusion images were planned to cover the basal, mid, and apical parts of the left ventricle in the same direction as the cine images.
Myocardial distribution of DE was studied 10–20 min following perfusion imaging with a 2D T1-weighted inversion recovery gradient-echo sequence with the following imaging parameters: FOV, 40×32 cm2; slice thickness, 8 mm; gap 2 mm; TR, 7.3; TE, 1.6; flip angle, 20°; TI, 180–275 ms; matrix, 256×192; 1 NEX; bandwidth, 17.9 kHz. The inversion time was adjusted per patient to null the signal of remote myocardium. Slice locations of the DE images were copied from the cine images.
Data analysis and definitions
First-pass perfusion, DE, and cine-MRI images were matched for position using anatomical landmarks like papillary muscles and the insertion of the right ventricle. For regional analysis, the left ventricle was divided into 16 myocardial segments. Two investigators (T.B. and R.J.v.G.), blinded to the clinical data, analysed all perfusion and DE segments and a decision was made on the basis of consensus.
Dedicated post-processing software was used to quantify left ventricular wall thicknesses and left ventricular volume (centreline method; Mass, Medis, Leiden, The Netherlands). SWT was calculated by subtracting the end-diastolic wall thickness from the end-systolic wall thickness and was expressed in millimetres. ESV and EDV were quantified by drawing endocardial and epicardial contours on the short axis series of the cine-MRI images and EF was calculated as: (EDV−ESV)/EDV×100%. Papillary muscles were considered to be part of the left ventricular lumen and hence included in the left ventricular volume.
Myocardial perfusion was evaluated per segment and scored as: 1, normal perfusion (homogeneous enhancement of myocardium); 2, mild perfusion defect (subendocardial layer of hypoenhancement); and 3, severe perfusion defect (>30% transmural extent of hypoenhancement) (Figure 1). A myocardial perfusion score was calculated per patient and consisted of a summation of all segmental perfusion scores. All patients had the same amount of segments (16) in the calculated perfusion score. DE-myocardium was clearly differentiated from remote myocardium (nulled signal) with the use of an inversion recovery pulse sequence. The volume of DE was quantified by manually selecting the enhanced regions from the consecutive 2D slices encompassing the left ventricle. DE volume was multiplied by 1.05 g/mL to obtain myocardial infarct mass (1 mL corresponds to 1.05 g). Also, the transmural extent of DE was scored per segment as: 1=0% (no DE), 2=1–25% (transmural extent of DE), 3=26–50%, 4=51–75%, and 5=76–100%. A myocardial segment was judged as non-assessable if the region of DE could not be differentiated clearly from the healthy myocardium (breathing artifacts and erroneous ECG triggering).
Statistical analysis
Continuous data are expressed as mean ± standard deviation, and dichotomous data are expressed as numbers and percentages. Paired Student's t-tests were applied to evaluate differences in EF, ESV, and EDV between baseline (i.e. 5 days post-AMI) and follow-up (i.e. 5 months post-AMI). The relationship between the baseline DE scores and follow-up SWT was analysed by one-way analysis-of-variance (ANOVA). However, these analyses should be interpreted with care as possible correlations between segments within patients might exist with consequent possible underestimates for the standard errors and hence for the corresponding P-values. Univariate linear regression analyses were applied to evaluate the relationship between the separate prediction variables (CPK, the per patient calculated perfusion score, acute infarct mass) and EF, ESV, and EDV at follow-up. Similar analyses were performed to study the relationship between the separate prediction variables and the change in EF, ESV, and EDV between baseline and follow-up. Multiple linear regression analyses were then applied to evaluate to what extent the separate prediction variables had additive predictive value for EF, ESV, and EDV at follow-up. The first model evaluated the additive predictive value of the calculated perfusion score in addition to CPK. The second model evaluated the additive predictive value of acute infarct mass in addition to CPK. The third model evaluated the additive predictive value of the calculated perfusion score and the acute infarct mass in addition to CPK. All prediction variables were put in the model at once (no elimination procedure). The linearity assumption was assessed by examining the scatter plots (Figures 3 and 5) and these demonstrated that no other than linear relationships were to be expected. Furthermore, a normal distribution of the residuals was found (P–P plots of regression standardized residuals) and the mean value of the residuals was zero. We report regression coefficients (β) with 95% confidence intervals, P-values, and model R2-values (percentage of variance in the outcome variable explained by the prediction variable). All tests were two-sided, and statistical significance was accepted at P≤0.05. SPSS for Windows, release 11.0.1, SPSS Inc., was used for all analyses.
Results
Patient population
Fifteen patients had an anterior AMI, whereas seven patients had an AMI of the inferior or lateral wall. Mean peak CPK level in all patients was 3112±2001 U/L (range 187–7359 U/L). More patient characteristics are listed in Table 1. EF increased from 48±11% at baseline to 55±9% (P<0.01) at follow-up. ESV remained unchanged (84±4 to 81±4 mL; P=0.6), but EDV increased from 160±44 to 172±55 mL at follow-up (P=0.03).
Regional analysis
Myocardial perfusion could be evaluated in all 352 segments. In 30 (9%) segments, a mild subendocardial perfusion defect was detected and 30 (9%) segments exhibited a severe perfusion defect extending beyond the subendocardium (Figure 1, Table 2). All perfusion defects were located within the perfusion territory of the infarct-related coronary artery. An inverse relationship was found for the perfusion status of the microvasculature at 5 days after AMI and SWT at 5 months after AMI (P<0.001, Figure 2). The transmural extent of DE could be evaluated in 320 segments. Thirty-two segments (9%) were not assessable due to impaired image quality. In 105 (32%) segments, a pattern of DE was detected within the perfusion territory of the infarct-related coronary artery (Table 2). An inverse relationship was found for the transmural extent of DE at 5 days after AMI and SWT at 5 months after AMI (P<0.001, Figure 3).
Global left ventricular analysis
A positive correlation between time to reperfusion and the perfusion score (R=0.48, P<0.05) was observed. Univariate regression analysis revealed that the per patient calculated perfusion score was statistically significantly related to EF at follow-up, such that patients with the lowest perfusion score had the highest EF (R2=0.23; Figure 4, Table 3). Baseline calculated perfusion scores were not related to ESV and EDV at follow-up. In addition, no relationship was found for the calculated perfusion score and the change in EF, ESV, and EDV between baseline and follow-up. Univariate regression analysis revealed that quantified acute infarct mass was statistically significantly related to EF (R2=0.65), ESV (R2=0.78), and EDV (R2=0.68) at 5 months post-AMI (Figure 5, Table 3). Acute infarct mass was also associated with the change in ESV (R2=0.37) and EDV (R2=0.44), but not with the change in EF (R2=0.19). Quantified acute myocardial infarct mass was correlated with peak CK concentrations (R=0.76, P<0.001). Univariate regression analysis revealed that CPK peak concentrations were statistically significantly related to EF (R2=0.33), ESV (R2=0.28), and EDV (R2=0.22) at follow-up. The results of the multiple regression analyses are listed in Table 3. The calculated perfusion score had no additive predictive value in addition to CPK with regard to EF, ESV, and EDV at follow-up. Acute infarct mass had additive predictive value in addition to CPK with regard to EF, ESV, and EDV at follow-up. Finally, with all prediction variables in the model, acute infarct mass was the only significant predictor of EF, ESV, and EDV at 5 months after infarction.
Discussion
The present study demonstrates the recovery of left ventricular function in patients who suffered AMI and were treated with a drug-eluting stent in the infarct-related coronary artery within 6 h of onset of symptoms. Additionally, the predictive value of perfusion and DE imaging performed at 5 days after AMI was evaluated. The main findings were that (i) a marked increase in overall mean EF was observed compared with previously published data,9,11 (ii) EF, ESV, and EDV at 5 months after AMI can be estimated by performing ce-MRI 5 days after AMI. DE imaging appears to be a better prognosticator than perfusion imaging, and (iii) although epicardial coronary blood flow was restored in all patients within 6 h of onset of symptoms, microvascular obstruction was identified with perfusion imaging at 5 days post-AMI in 19 patients (87%).
Previous studies have investigated the recovery of regional and global left ventricular function in patients who suffered AMI by performing ce-MRI. However, results of these studies have been equivocal. Gerber et al.10 performed perfusion and DE imaging 4 days after AMI and found that perfusion imaging was less accurate than DE imaging in predicting regional contractile recovery at 7 months. In contrast, Taylor et al.13 performed perfusion imaging in patients within 24 h after AMI and reported that a delayed wash-in of contrast in the infarcted myocardium was a better predictor than DE imaging of recovery of SWT and EF 3 months after AMI. In the present study, EF, ESV, and EDV at 5 months after AMI appeared to be better predicted by DE imaging than by perfusion imaging. Furthermore, an inverse relationship between DE and regional contractile function after 5 months of follow-up was observed with minimal SWT in segments with >75% transmural extent of DE. The majority of the studies using only DE imaging reported an inverse relationship between the transmural extent of DE and the improvement in regional contractile function, with generally minimal improvement in dysfunctional segments with a >75% transmural extent of DE. For example, Ingkanisorn et al.11 assessed SWT in patients after AMI and reported an inverse relationship between the transmural extent of DE and SWT at follow-up study. Choi et al.,8 reported that only 5% of segments with a >75% transmural extent of DE demonstrated an improved contractile function at follow-up, whereas Beek et al.9 reported improvement in 29% of these segments, although severe dysfunction remained present in the majority of these segments. In contrast to all other studies, Petersen et al.12 reported that only segments with a >75% transmural extent of DE improved.
The different outcomes in the various studies are difficult to explain, but could be caused by a number of confounding factors. First, patients with different reperfusion strategies for AMI, such as primary angioplasty, thrombolysis, and spontaneous resolution of infarct symptoms, were included. Primary PCI with the placement of a drug-eluting stent in the infarct-related artery is presently the preferred reperfusion treatment for AMI. TIMI 3 flow in the infarct-related artery can be accomplished in most cases and very low numbers of restenosis have been reported. Residual stenosis or restenosis of an infarct-related artery is often found in patients treated with thrombolysis and this influences the remodelling process. Secondly, time to reperfusion varied from <6 h13 to 1 month11 after onset of symptoms. Time to reperfusion determines the amount of stunned (salvaged) and necrotic myocardium15 and the integrity of the microvasculature.4,5 Thirdly, baseline scans were performed between <24 h13 up to 21 days after AMI.12 Myocardial infarct evolution is a complex process of early infarct expansion (up to 48 h post-AMI)16 followed by myocardial infarct shrinkage in time.11 Perfusion and DE imaging parameters will subsequently alter with proceeding time after AMI. Infarct size might be underestimated with DE imaging if performed too early after AMI. We performed baseline scans in a clinically applicable time interval between completing stabilization on the coronary care unit and discharge home from the cardiology ward. Fourthly, the chosen endpoints per study varied from the change in regional contractile function and EF to contractile function and EF at follow-up. In the present study, a marked increase in overall mean EF was observed from 48±11% at baseline to 55±9% at follow-up. However, a moderate correlation was found between DE and perfusion imaging and the change in EF, ESV, and EDV between 5 days and 5 months post-AMI. Improvement of myocardial contractile function is dependent on recovery of stunned myocardium and compensatory hypertrophy of salvaged myocardium during left ventricular remodelling. It is still unknown in what time span recovery of contractile function of dysfunctional stunned myocardium can be expected and the degree of compensatory hypertrophy is influenced by numerous factors, such as: neurohumoral stimulation, medication, etc. Although a marked increase in EF was observed in the present study, it is possible that with baseline scans performed earlier after AMI we might have observed an even greater improvement in EF. Predicting the change in EF, ESV, and EDV during this complex process of left ventricular remodelling might lead to false interpretations of recovery as baseline values may fluctuate during the first period after AMI. For this reason, we correlated perfusion and DE imaging with EF, ESV, and EDV at 5 months after AMI. EF, ESV, and EDV were chosen as endpoints as several studies showed that these endpoints are major determinants of clinical outcome after AMI.17
Although the number of patients in the present study is relatively small, DE imaging appears to be a better prognosticator than perfusion imaging. DE imaging might be a better predictor of EF, ESV, and EDV at 5 months after AMI as total infarct size remains underestimated with perfusion imaging. Myocardial perfusion defects, as identified with perfusion imaging, correspond to the region of microvascular obstruction within the infarcted region, but do not include necrotic myocardium with an intact microvasculature and hence normal perfusion16 (Table 2). In contrast, with DE imaging entire myocardial infarct size, including the region with microvascular obstruction, is assessed. In a canine model of AMI, total infarct size (DE imaging) and the extent of microvascular obstruction (perfusion imaging) corresponded to post-mortem histology findings.16 DE imaging allows the visualization of infarcted myocardium, as a contrast agent like gadolinium-DTPA enhances the signal in regions with myocyte necrosis. X-ray microanalysis showed an accumulation of gadolinium-DTPA exclusively in the infarcted myocardium 10–20 min after intravenous administration.18 The results of this study show that an imaging technique which allows the differentiation between viable and non-viable myocytes might be preferred over an imaging technique that solely visualizes the integrity of the microvasculature. Contrast echocardiography, besides having the great advantage of being a bedside imaging tool, only allows the assessment of microvasculature integrity and does not provide accurate information regarding infarct size. Another currently available non-invasive imaging modality is nuclear medicine, which allows the differentiation between regions with viable and non-viable myocytes but is hampered by the currently offered low spatial resolution. ce-MRI allows the assessment of total infarct size and provides detailed information on regional and global left ventricular function. Unfortunately, its availability is still limited.
Methodological considerations
The size of the present study population is relatively small and conclusions for subgroups, such as patients with diabetes, women vs. men, etc., cannot be drawn. Furthermore, a possible selection bias could have been present in this study as eight patients were unable or refused to undergo a second MRI. Importantly, none of these patients dropped out due to cardiac death or severe heart failure, making selection bias unlikely. In the present study, we did not perform angiographic follow-up to exclude in-stent restenosis, but all patients received a drug-eluting stent in the infarct-related coronary artery with very low numbers of restenosis reported.3 There was no clinical evidence of recurrent myocardial ischaemia. Quantification of the volume of microvascular obstruction is hampered by the low spatial resolution offered by the currently available acquisition technique and the temporal resolution, which does not allow coverage of the whole ventricle in one R–R interval.
Conclusions
In the era of primary stenting with drug-eluting stents as reperfusion treatment for patients with AMI, marked recovery of left ventricular function is observed. Global left ventricular function at 5 months post-AMI can be estimated by performing ce-MRI at 5 days post-AMI. DE imaging appears to be a better prognosticator than perfusion imaging.
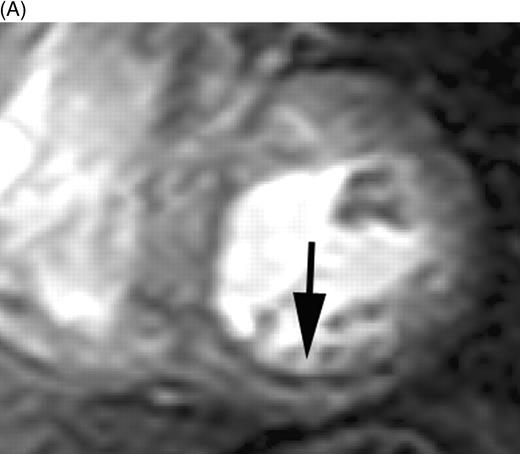
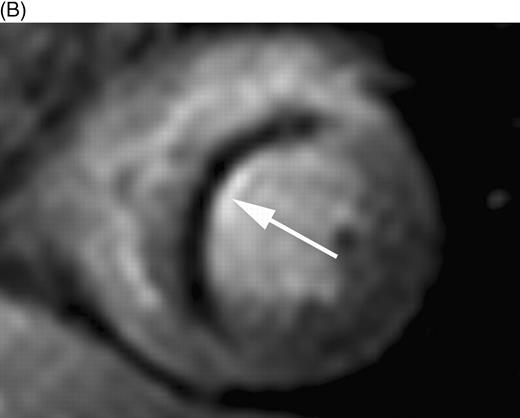
Figure 1 First-pass perfusion images in patients 5 days after AMI indicating (A) subendocardial perfusion defect (score 2) in the inferior wall and (B) a severe perfusion defect in the interventricular septum extending beyond the subendocardium (score 3).
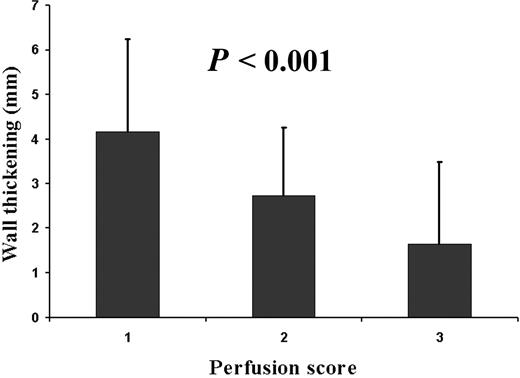
Figure 2 Myocardial segments with mild or severe perfusion defects demonstrated impaired SWT at 5 months post-AMI (ANOVA, P<0.001). 1, normal perfusion; 2, subendocardial perfusion defect; 3, severe perfusion defect (also Figure 1).
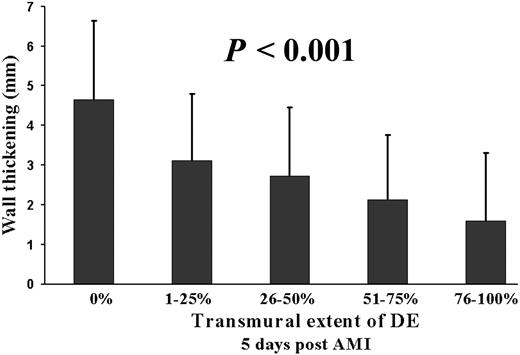
Figure 3 SWT at 5 months post-AMI is inversely related to the transmural extent of DE at 5 days post-AMI (ANOVA, P<0.001).
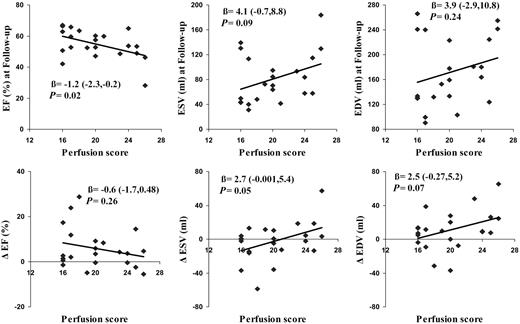
Figure 4 The calculated perfusion score per patient correlated better with EF at 5 months after AMI than the change in EF between 5 days and 5 months post-AMI. The calculated perfusion score was not related to ESV and EDV at 5 months follow-up and the change in ESV and EDV between 5 days and 5 months post-AMI (Δ=change between 5 days and 5 months).
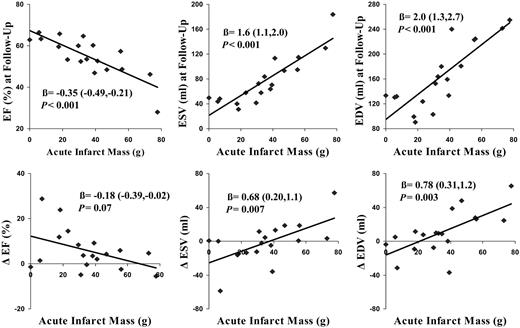
Figure 5 Acute myocardial infarct mass correlated better with EF, ESV, and EDV at 5 months after AMI than the change in EF, ESV, and EDV between 5 days and 5 months post-AMI (Δ=change between 5 days and 5 months).
Patient characteristics (n=22)
| Age (years) | 52±12 |
| Men | 16 (73) |
| Smoking | 15 (68) |
| Diabetes mellitus | 1 (5) |
| Hypertension | 6 (27) |
| Hypercholesterolaemia | 5 (23) |
| Family history of coronary artery disease | 12 (55) |
| Post-AMI | |
| Left ventricular EF (%) | 48±11 |
| Creatine kinase peak (IU) | 3112±2001 |
| Anterior infarction | 15 (68) |
| Inferior/lateral infarction | 7 (27) |
| Abciximab | 14 (64) |
| ACE inhibitor | 18 (82) |
| β-Blocker | 22 (100) |
| Clopidogrel | 22 (100) |
| Statin | 20 (91) |
| Aspirin | 22 (100) |
Values are presented as number (%) or mean±standard deviation.
An overview of all segmental perfusion and DE scores
| Segmental perfusion score | Segmental DE score | Total number of segments | ||||
|---|---|---|---|---|---|---|
| 1 | 2 | 3 | 4 | 5 | ||
| 1 | 212 | 18 | 11 | 11 | 8 | 260 |
| 2 | 3 | 3 | 14 | 5 | 5 | 30 |
| 3 | 0 | 0 | 4 | 6 | 20 | 30 |
| Total number of segments | 215 | 21 | 29 | 22 | 33 | 320 |
| Segmental perfusion score | Segmental DE score | Total number of segments | ||||
|---|---|---|---|---|---|---|
| 1 | 2 | 3 | 4 | 5 | ||
| 1 | 212 | 18 | 11 | 11 | 8 | 260 |
| 2 | 3 | 3 | 14 | 5 | 5 | 30 |
| 3 | 0 | 0 | 4 | 6 | 20 | 30 |
| Total number of segments | 215 | 21 | 29 | 22 | 33 | 320 |
Univariate and multivariate linear regression analyses
| EF at follow-up | ESV at follow-up | EDV at follow-up | ||||||||||
|---|---|---|---|---|---|---|---|---|---|---|---|---|
| β | β, CI | P-value | R2 | β | β, CI | P-value | R2 | β | β, CI | P-value | R2 | |
| Univariate analyses | ||||||||||||
| CPK | −2.7×10⁻³ | −0.004, −0.001 | 0.005 | 0.33 | 0.01 | 0.003, 0.018 | 0.01 | 0.28 | 0.01 | 0.002, 0.02 | 0.03 | 0.22 |
| Perfusion score | −1.2 | −2.3, −0.2 | 0.02 | 0.23 | 4.1 | −0.7, 8.8 | 0.09 | 0.14 | 3.9 | −2.9,11 | 0.24 | 0.02 |
| Infarct mass | −0.35 | −0.49, −0.21 | <0.001 | 0.65 | 1.6 | 1.1, 2.0 | <0.001 | 0.78 | 2.0 | 1.3, 2.7 | <0.001 | 0.68 |
| Multivariate analyses | ||||||||||||
| Model 1 | ||||||||||||
| CPK | −2.2×10⁻³ | −0.005, 0.001 | 0.09 | 0.34 | 0.01 | −0.001, 0.02 | 0.06 | 0.28 | 0.02 | 0, 0.033 | 0.05 | 0.23 |
| Perfusion score | −0.35 | −1.8, 1.1 | 0.63 | −0.46 | −7.1, 6.1 | 0.9 | −2.7 | −12, 6.5 | 0.50 | |||
| Model 2 | ||||||||||||
| CPK | −0.9×10⁻³ | −0.0003, 0.001 | 0.39 | 0.67 | −0.5×10⁻³ | −0.007, 0.008 | 0.88 | 0.78 | −0.8×10⁻³ | −0.01, 0.01 | 0.90 | 0.68 |
| Infarct mass | −0.28 | −0.50, −0.07 | 0.01 | 1.5 | 0.82, 2.3 | <0.001 | 2.1 | 0.89, 3.2 | 0.002 | |||
| Model 3 | ||||||||||||
| CPK | −0.8×10⁻³ | −0.003, 0.002 | 0.50 | 0.67 | 1.3×10⁻³ | −0.007, 0.01 | 0.75 | 0.78 | 1.3×10⁻³ | −0.01, 0.01 | 0.84 | 0.70 |
| Perfusion score | −0.11 | −1.5, 1.3 | 0.87 | −0.93 | −5.6, 3.7 | 0.68 | 2.6 | −10, 4.8 | 0.46 | |||
| Infarct mass | −0.28 | −0.52, −0.035 | 0.04 | 1.6 | 0.84, 2.4 | 0.001 | 2.2 | 0.94, 3.5 | 0.002 | |||
β, regression coefficient; CI, 95% confidence interval.
References
Andersen HR, Nielsen TT, Rasmussen K, Thuesen L, Kelbaek H, Thayssen P, Abildgaard U, Pedersen F, Madsen JK, Grande P, Villadsen AB, Krusell LR, Haghfelt T, Lomholt P, Husted SE, Vigholt E, Kjaergard HK, Mortensen LS. A comparison of coronary angioplasty with fibrinolytic therapy in acute myocardial infarction.
Keeley EC, Boura JA, Grines CL. Primary angioplasty versus intravenous thrombolytic therapy for acute myocardial infarction: a quantitative review of 23 randomised trials.
Lemos PA, Saia F, Hofma SH, Daemen J, Ong AT, Arampatzis CA, Hoye A, McFadden E, Sianos G, Smits PC, van der Giessen WJ, de Feyter P, van Domburg RT, Serruys PW. Short- and long-term clinical benefit of sirolimus-eluting stents compared to conventional bare stents for patients with acute myocardial infarction.
Henriques JP, Zijlstra F, Ottervanger JP, de Boer MJ, van't Hof AW, Hoorntje JC, Suryapranata H. Incidence and clinical significance of distal embolization during primary angioplasty for acute myocardial infarction.
Verma S, Fedak PW, Weisel RD, Butany J, Rao V, Maitland A, Li RK, Dhillon B, Yau TM. Fundamentals of reperfusion injury for the clinical cardiologist.
Wu KC, Kim RJ, Bluemke DA, Rochitte CE, Zerhouni EA, Becker LC, Lima JA. Quantification and time course of microvascular obstruction by contrast-enhanced echocardiography and magnetic resonance imaging following acute myocardial infarction and reperfusion.
Judd RM, Lugo-Olivieri CH, Arai M, Kondo T, Croisille P, Lima JA, Mohan V, Becker LC, Zerhouni EA. Physiological basis of myocardial contrast enhancement in fast magnetic resonance images of 2-day-old reperfused canine infarcts.
Choi KM, Kim RJ, Gubernikoff G, Vargas JD, Parker M, Judd RM. Transmural extent of acute myocardial infarction predicts long-term improvement in contractile function.
Beek AM, Kuhl HP, Bondarenko O, Twisk JW, Hofman MB, van Dockum WG, Visser CA, van Rossum AC. Delayed contrast-enhanced magnetic resonance imaging for the prediction of regional functional improvement after acute myocardial infarction.
Gerber BL, Garot J, Bluemke DA, Wu KC, Lima JA. Accuracy of contrast-enhanced magnetic resonance imaging in predicting improvement of regional myocardial function in patients after acute myocardial infarction.
Ingkanisorn WP, Rhoads KL, Aletras AH, Kellman P, Arai AE. Gadolinium delayed enhancement cardiovascular magnetic resonance correlates with clinical measures of myocardial infarction.
Petersen SE, Voigtlander T, Kreitner KF, Horstick G, Ziegler S, Wittlinger T, Abegunewardene N, Schmitt M, Schreiber WG, Kalden P, Mohrs OK, Lippold R, Thelen M, Meyer J. Late improvement of regional wall motion after the subacute phase of myocardial infarction treated by acute PTCA in a 6-month follow-up.
Taylor AJ, Al-Saadi N, Abdel-Aty H, Schulz-Menger J, Messroghli DR, Friedrich MG. Detection of acutely impaired microvascular reperfusion after infarct angioplasty with magnetic resonance imaging.
Slavin GS, Wolff SD, Gupta SN, Foo TK. First-pass myocardial perfusion MR imaging with interleaved notched saturation: feasibility study.
Christian TF, Schwartz RS, Gibbons RJ. Determinants of infarct size in reperfusion therapy for acute myocardial infarction.
Gerber BL, Rochitte CE, Melin JA, McVeigh ER, Bluemke DA, Wu KC, Becker LC, Lima JA. Microvascular obstruction and left ventricular remodeling early after acute myocardial infarction.
White HD, Norris RM, Brown MA, Brandt PW, Whitlock RM, Wild CJ. Left ventricular end-systolic volume as the major determinant of survival after recovery from myocardial infarction.

