


Abstract
Aims To examine the relationship between revascularization within 7 days and 1-year mortality among ST-elevation myocardial infarction patients enrolled in GUSTO-V trial (n=13 451). To examine the relative contribution of system and patient level factors to the variation in international revascularization rates, and their impact on mortality outcomes.
Methods and results Patients from North America (USA, Canada), Australia, and Europe (UK, France, Germany, Italy, Spain, Poland, Norway, The Netherlands, Belgium, Finland) were included in the study. Revascularization was associated with lower 1-year mortality. Norway, Belgium, Spain, Poland, and Italy also had lower than expected revascularization rates but higher than expected mortality rates. France and USA had almost two times the expected rate of 7-day revascularization, which was associated with modest mortality benefits. Patients' propensity for revascularization based on clinical factors alone was associated with lower 1-year mortality (OR 0.97, 95% CI: 0.96–0.99). Country-level factors had an impact on propensity for revascularization but no impact on 1-year mortality.
Conclusion Our study reveals the potential for some countries with lower than expected 7-day revascularization rates to improve their clinical outcomes. Also highlighted is the possibility for more economically efficient delivery of care in USA and France.
Introduction
The optimal rate of revascularization among ST-elevation myocardial infarction (STEMI) patients following fibrinolytic therapy is unknown. The 2004 American College of Cardiology/American Heart Association (ACC/AHA) guidelines offer a Class IIb recommendation to routine use of coronary angiography and percutaneous coronary intervention (PCI) among these patients.1 Recent evidence from observational studies suggests that higher revascularization rates may be associated with lower mortality rates.2–4
International variation in the use of angiography and revascularization procedures following STEMI is well documented.5–11 However, the extent to which the variation is modulated by differences in clinical characteristics vs. differences in practice patterns driven by system-factors such as the availability of resources is not clear. Significant under-utilization of revascularization procedures resulting in potentially preventable mortality and morbidity have prompted some health care systems to establish national targets for revascularization rates.12,13 In contrast, excessive revascularization may be associated with diminishing returns with respect to clinical outcomes and escalating health care costs.14
Using data from the recent international GUSTO-V trial, a large international trial of 16 588 ST-elevation myocardial infarction patients treated with two differing pharmacological therapies, we examined the relationship between revascularization (defined as within 7 days of admission) and 1-year mortality among STEMI patients. In addition, we examined the extent to which system level factors rather than differences in patients' clinical characteristics contribute to the variation in international revascularization rates, and the extent to which these deviations impact mortality outcomes. The results could assist administrators and policy makers in benchmarking current rates and formulating national target rates of revascularization.
Methods
The GUSTO-V study has been previously described.15 Briefly, 16 588 patients with ST-segment elevation myocardial infarction presenting within 6 h of symptom onset were randomized to standard-dose reteplase or half-dose reteplase and full-dose abciximab. Patients from 820 hospitals in 20 countries were enrolled in the trial between July 1999 and February 2001. There was no significant difference in the primary end-point of all cause mortality at 30 days in the two treatment groups (5.9% in the reteplase and 5.6% in the combined reteplase and abciximab arm, P=0.43).
Patient population
In order to provide adequate samples for comparison, only those countries enrolling more than 100 patients in the trial from North America, Australia, and Europe were included in our study. A total of 14 056 patients were enrolled in 13 countries: USA (2900); Germany (2492); Poland (1759); The Netherlands (1304); UK (1246); Canada (1232); Italy (1175); Spain (614); Australia (503); France (403); Belgium (180); Norway (143); and Finland (105).
In GUSTO-V, coronary angiography and revascularization occurred at the discretion of the investigator and were recorded for all patients if they occurred within 7 days after enrolment or before hospital discharge (whichever was earlier). In order to avoid bias as a result of early hazard among non-revascularized patients, we restricted the study population to patients who survived for 7 days following their acute myocardial infarction.3
Statistical analysis
Baseline demographic and clinical characteristics as well as country-specific rates of angiography and revascularization [PCI and coronary artery bypass graft (CABG) surgery] within 7 days of admission were examined.
Cox regression analysis was used to examine the relationship between revascularization and 1-year mortality among 7-day survivors after adjusting for baseline variables. We supplemented this primary analysis with sensitivity analyses of all enrolled patients (in which revascularization was included as time-dependent covariate), and of those patients who survived upto 30 days after their myocardial infarction.
Risk-adjusted revascularization rates and 1-year mortality rates
Logistic regression analyses were used to calculate both a propensity score for revascularization within 7 days and for 1-year mortality on the basis of patients' baseline demographic and clinical characteristics.
For each of the 13 countries, expected revascularization rates and expected 1-year mortality rates were calculated as averages of their patients' estimated propensities for 7-day revascularization and mortality risk, respectively. Both estimates were based on patients' demographic and clinical characteristics. We calculated each country's ratio of observed revascularization rate to its expected revascularization rate (O/E revascularization ratio) and its observed mortality rate to its expected mortality rate (O/E mortality ratio). Countries with O/E revascularization ratios <1 had lower than expected rates of revascularization and those with O/E mortality ratios <1 had better mortality outcomes than expected.
Impact of country-level factors
To measure the impact of country level factors, we calculated a second propensity score for revascularization within 7 days after supplementing patient level data with country-level factors. Two descriptors of the health care systems of participating countries were included. The first was the percentage of the gross domestic product (GDP) spent on health care in each country in 2002.16 This is considered an indicator of the affordability of a country's health care system. And the second measure was the World Health Organization 2002 life expectancy estimate for each country as an estimate of the average indicator of the overall health of a country.17
We then re-calculated each country's O/E revascularization ratio using propensity scores based on patient and country level factors. The deviation between the O/E revascularization ratio based on patient factors alone and that based on patient and country factors is a measure of the impact of non-clinical, system factors such as the availability of health care resources. The incremental impact of this deviation on outcomes after adjusting for patients' propensity for 7-day revascularization based on clinical factors alone was assessed using logistic regression analysis. In addition, the likelihood ratio test statistic, defined as −2 times the difference in log likelihood values corresponding to the full model (including both clinical and country variables) and the reduced model (including only the clinical variables), was calculated to examine the contribution of country level factors to mortality outcomes.
Results
The study population consisted of 13 451 patients enrolled in 13 countries in GUSTO-V who survived up to 7 days after their acute myocardial infarction (Table 1). There were significant differences in patients' baseline demographic and clinical characteristics across countries. Patients in France and USA were younger (median age<60 years), whereas patients in Australia, UK, Italy, and Spain were older at presentation (median age≥63 years). Fewer females were enrolled in France (16%) and Spain (16.1%) compared with Poland (27.4%) and USA (27.4%). The study population was predominantly Caucasian with the highest percentage of non-Caucasian patients being enrolled in USA (10.6%).
Baseline characteristics by country of enrollment of 7 day survivors
| Baseline data | USA | CN | AU | UK | FR | GERM | IT | BEL | FIN | NETH | NOR | SP | POL |
|---|---|---|---|---|---|---|---|---|---|---|---|---|---|
| n | 2805 | 1187 | 488 | 1174 | 381 | 2393 | 1123 | 172 | 104 | 1263 | 136 | 583 | 1642 |
| Age (years)a | 59 (51, 69) | 61 (52, 71) | 64 (54, 73) | 63 (55, 72) | 57 (50, 70) | 62 (53, 70) | 63 (54, 71) | 62 (53, 70) | 62 (53, 73) | 62 (52, 70) | 62 (54, 72) | 63 (52, 71) | 61 (51, 69) |
| Female | 27.4 | 24.5 | 25.2 | 25.0 | 16.0 | 25.2 | 20.7 | 25.0 | 26.0 | 22.1 | 25.7 | 16.1 | 27.4 |
| White | 89.4 | 91.7 | 96.1 | 98.6 | 97.1 | 98.0 | 99.8 | 97.7 | 96.2 | 96.8 | 100.0 | 99.7 | 99.9 |
| Weight (kg)a | 84 (73, 95) | 80 (69, 89) | 78 (69, 87) | 76 (67, 85) | 75 (68, 85) | 80 (70, 89) | 75 (66, 84) | 78 (65, 86) | 80 (71, 90) | 79 (70, 88) | 80 (72, 87) | 75 (68, 82) | 77 (69, 85) |
| Height (cm)a | 173 (165, 180) | 170 (165, 177) | 172 (165, 177) | 171 (164, 176) | 170 (165,175) | 172 (166, 178) | 170 (164, 174) | 171 (165, 176) | 173 (166, 178) | 174 (168, 180) | 175 (167, 180) | 168 (163, 172) | 170 (164, 175) |
| Systolic BP (mmHg)a | 132 (116, 149) | 136 (120, 152) | 134 (119, 150) | 140 (122, 153) | 138 (120, 150) | 140 (120, 150) | 135 (120, 150) | 138 (120, 150) | 143 (130, 158) | 135 (120, 150) | 145 (127, 164) | 136 (120, 150) | 130 (120, 150) |
| Heart rate (bpm)a | 73 (63, 85) | 72 (61, 83) | 70 (60, 84) | 71 (60, 83) | 72 (62, 85) | 75 (63, 86) | 70 (60, 81) | 73 (62, 87) | 70 (62, 85) | 70 (60, 80) | 70 (60, 82) | 71 (60, 82) | 75 (64, 85) |
| Previous MI | 15.6 | 17.9 | 15.8 | 16.3 | 11.3 | 12.3 | 13.6 | 12.8 | 16.3 | 12.0 | 10.3 | 10.3 | 17.8 |
| Prior CHF | 2.6 | 2.6 | 2.9 | 2.6 | 1.6 | 3.6 | 1.0 | 2.9 | 3.8 | 1.1 | 2.2 | 1.5 | 6.3 |
| Diabetes | 17.4 | 16.0 | 15.6 | 9.5 | 11.5 | 16.9 | 15.5 | 15.7 | 12.5 | 10.4 | 6.6 | 20.4 | 12.6 |
| Hypertension | 38.7 | 30.7 | 37.3 | 26.3 | 33.3 | 39.4 | 39.0 | 26.7 | 33.7 | 19.6 | 23.5 | 27.8 | 36.4 |
| H.cholester. | 23.5 | 22.4 | 21.5 | 15.0 | 27.6 | 13.7 | 13.4 | 16.9 | 12.5 | 10.6 | 12.5 | 19.2 | 9.1 |
| Smoking | 44.0 | 45.0 | 33.8 | 44.4 | 44.9 | 43.4 | 46.1 | 45.9 | 42.3 | 52.3 | 44.1 | 48.5 | 50.7 |
| Prior CABG | 6.0 | 3.6 | 3.9 | 2.0 | 2.1 | 3.6 | 2.0 | 4.1 | 1.9 | 3.0 | 2.2 | 1.9 | 1.1 |
| Prior PCI | 12.5 | 6.7 | 5.5 | 3.2 | 7.1 | 6.0 | 3.7 | 8.1 | 2.9 | 4.6 | 3.7 | 3.8 | 1.8 |
| PVD | 4.7 | 5.1 | 5.5 | 3.7 | 7.1 | 4.0 | 5.0 | 3.5 | 1.9 | 3.6 | 2.2 | 5.3 | 5.8 |
| Killip >1 | 7.6 | 9.9 | 20.3 | 21.7 | 5.5 | 11.7 | 13.9 | 11.0 | 4.8 | 4.0 | 5.1 | 7.7 | 12.3 |
| Anterior MI | 31.5 | 32.0 | 39.5 | 36.6 | 37.5 | 41.0 | 38.8 | 33.7 | 52.9 | 33.5 | 44.1 | 41.0 | 36.7 |
| Time to tx (hours)a | 2.4 (1.7, 3.3) | 2.4 (1.7, 3.4) | 2.6 (1.9, 3.6) | 2.8 (2.2, 3.8) | 3.1 (2.4, 4.3) | 2.7 (1.9, 3.8) | 2.8 (1.9, 3.8) | 2.5 (1.8, 3.4) | 2.7 (1.9, 3.9) | 2.6 (2.0, 3.5) | 3.1 (2.3, 4.5) | 3.1 (2.4, 4.2) | 2.8 (2.0, 4.1) |
Countries: CN, Canada; AU, Australia; FR, France; GERM, Germany; IT, Italy; BEL, Belgium; FIN, Finland; NETH, The Netherlands; NOR, Norway; SP, Spain; POL, Poland.
MI, Myocardial infarction; CHF, congestive heart failure; H.cholester., Hypercholesterolaemia; PVD, peripheral vascular disease; tx, treatment.
aData presented are medians and inter-quartile ranges.
The overall 1-year mortality rate in GUSTO-V was 8.3%. One-year survival curves among patients who did and did not undergo revascularization among 7-day survivors are presented in Figure 1. Revascularization was associated with significantly lower 1-year mortality. In sensitivity analyses based on all patients and 30-day survivors, 7-day revascularization continued to be associated with improved survival at 1-year. This association persisted even after adjusting for differences in baseline characteristics. All baseline variables presented in Table 1 were included in the multivariable analysis. Among 7-day survivors, revascularization was associated with a significantly lower hazard of 1-year mortality [Hazard ratio (HR)=0.69, 95% CI: 0.55–0.86]. Similarly, in a model including all patients and revascularization as a time-dependent covariate, the HR and 95% CI for revascularization were 0.81 and 0.68–0.97, respectively. And finally among 30-day survivors, the hazard of 1-year mortality among revascularized patients was 0.55 (95% CI: 0.41–0.73).
One-year survival among patients who did and did not undergo revascularization within 7 days (Left: all patients; Middle: 7-day survivors; Right: 30-day survivors).
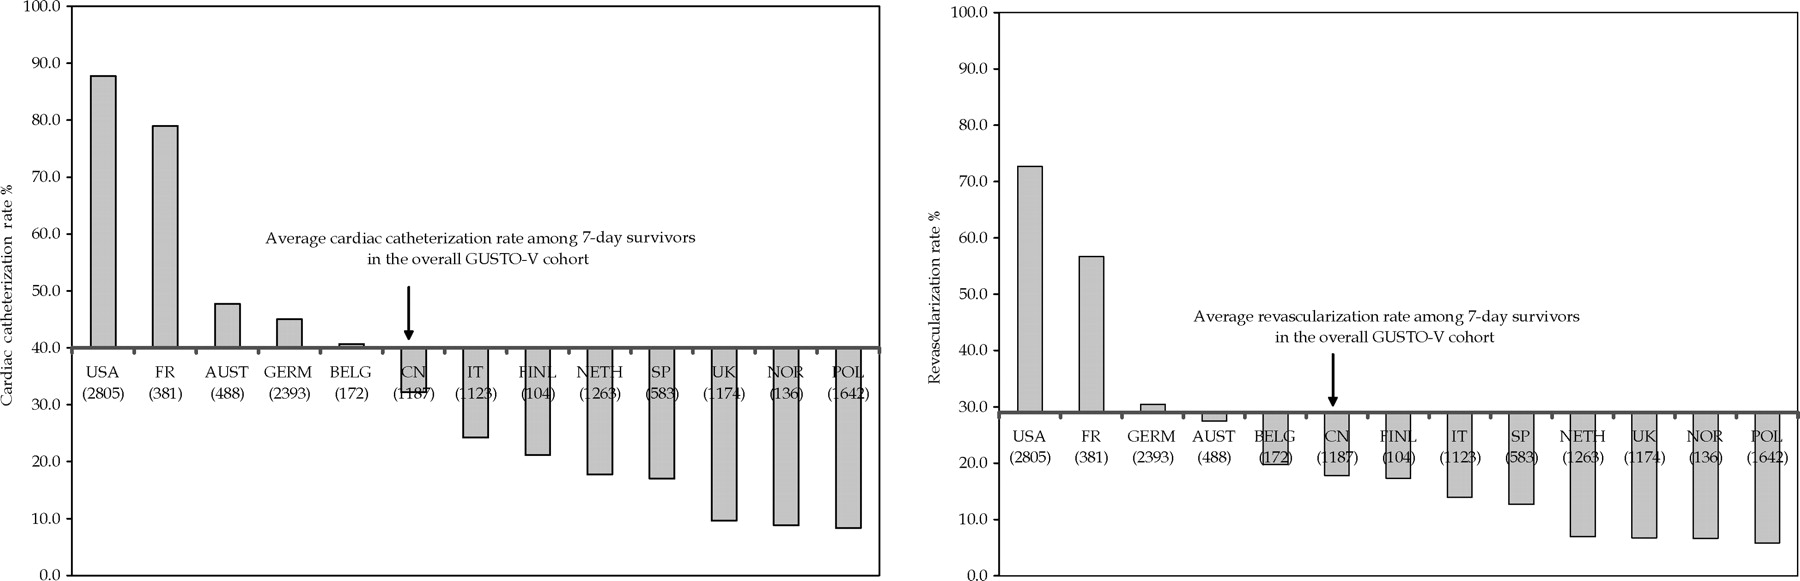
Cardiac catheterization and revascularization rates in the overall GUSTO-V cohort that survived to 7-days were 40 and 29%, respectively. Country-specific rates, described as a deviation from this average rate, are presented in Figure 2. Rates of cardiac catheterization ranged from a high of 87.7% in USA to a low of 8.3% in Poland, 8.8% in Norway, and 9.5% in UK. As expected, the use of cardiac catheterization and revascularization were significantly positively correlated. Hence, revascularization rates (PCI or CABG) ranged from 72.7% in USA to 6.6% in Poland and 6.7% in UK. As can be seen in Table 2, a majority of the revascularization rate was accounted for by PCI. Median hours to PCI ranged from 3.3 h in The Netherlands to over 3 days in Canada and Italy. Time to PCI is likely to have been modulated by the percentage of patients transferred and the geographic distance. Transfer rates among PCI patients ranged from 10.3% in France to 88.9% in Norway. Use of stents was consistently high across the countries. Using a proxy definition of ‘rescue’ as urgent PCI within 3 h, we found that 17.2% of the procedures met this definition. There was considerable variation in ‘rescue’ PCI rates, ranging from 0% in Norway to 36.6% in France. We also examined the relationship between time to PCI and 1-year mortality rates and found an inverse relationship: 6.5% mortality when PCI was done within 12 h; 4.3% when it was done between 12 and 24 h; 3.6% when it was done between 24 and 48 h; 3.4% when it was done between 48 and 96 h; and 2% when PCI was done at or after 96 h post-thrombolytic therapy.
Geographic variability in cardiac catheterization and revascularization presented as a deviation from overall average rates among 7-day survivors in GUSTO-V.
International variation in 7-day PCI rates across countries
| Country | USA | CN | AU | UK | FR | GERM | IT | BEL | FIN | NETH | NOR | SP | POL |
|---|---|---|---|---|---|---|---|---|---|---|---|---|---|
| PCI, n | 1663 | 199 | 118 | 77 | 213 | 712 | 150 | 33 | 15 | 85 | 9 | 73 | 95 |
| % PCI | 59.3 | 16.8 | 24.2 | 6.6 | 55.9 | 29.8 | 13.4 | 19.2 | 14.4 | 6.7 | 6.6 | 12.5 | 5.8 |
| Median time to PCI (hours) | 38.8 | 76.5 | 50.2 | 45.5 | 39.6 | 39.9 | 89.7 | 59.5 | 40.8 | 3.3 | 68.6 | 69.8 | 9.7 |
| % Tranfers | 52.8 | 39.2 | 33.9 | 46.8 | 10.3 | 22.6 | 16.0 | 30.3 | 20.0 | 31.8 | 88.9 | 13.7 | 16.8 |
| % Stent | 92.7 | 92.0 | 89.8 | 80.5 | 90.1 | 80.3 | 91.3 | 78.8 | 100.0 | 71.8 | 88.9 | 93.2 | 61.1 |
| % Rescuea | 14.9 | 14.1 | 13.6 | 13.0 | 36.6 | 13.3 | 16.7 | 21.2 | 20.0 | 43.5 | 0.0 | 16.4 | 34.7 |
aRescue defined as urgent PCI within 3 h of thrombolytic therapy.
A logistic regression model was used to calculate the propensity for revascularization for each patient who survived to day 7 (Table 3). The model included all baseline variables presented in Table 1. The C-index for the model was 0.63. Clinical predictors included previous revascularization, weight, hypercholesterolaemia, time from symptom onset to treatment, history of congestive heart failure, age, and female gender. Propensity scores for revascularization within 7 days ranged from 0 to 76.4%.
Propensity for revascularization among 7-day survivors
| Description | OR | Lower 95% CI | Upper 95% CI | χ2 | P-value |
|---|---|---|---|---|---|
| Age (10 years) | 0.89 | 0.85 | 0.92 | 37.5 | <0.01 |
| Female | 1.30 | 1.15 | 1.45 | 19.3 | <0.01 |
| Height (10 cm) | 1.08 | 1.02 | 1.15 | 6.6 | 0.01 |
| Weight (10 kg) | 1.15 | 1.12 | 1.19 | 76.6 | <0.01 |
| Sys. BP (10 mmHg) | 0.96 | 0.94 | 0.97 | 27.3 | <0.01 |
| Previous MI | 0.73 | 0.64 | 0.83 | 23.8 | <0.01 |
| Previous CHF | 0.53 | 0.40 | 0.70 | 19.8 | <0.01 |
| Hypertension | 1.11 | 1.01 | 1.21 | 5.2 | 0.02 |
| Hypercholesterolaemia | 1.34 | 1.21 | 1.49 | 30.1 | <0.01 |
| Smoking | 0.88 | 0.80 | 0.95 | 9.3 | <0.01 |
| Previous CABG | 1.23 | 0.99 | 1.53 | 3.5 | 0.06 |
| Previous PCI | 2.21 | 1.87 | 2.60 | 88.5 | <0.01 |
| Killip class >1 | 0.81 | 0.71 | 0.92 | 10.4 | <0.01 |
| Time to tx (10 min)a | 0.31 | 0.23 | 0.41 | 66.2 | <0.01 |
C-index=0.63. Sys. BP, Systolic blood pressure.
aTime to tx=Time to treatment from symptom onset to treatment.
A second logistic regression model was developed to calculate patients' 1-year probability of death on the basis of their demographic and clinical characteristics (Table 4). The C-index for the model was 0.80. Important factors associated with 1-year mortality included age, Killip class >1, heart rate, anterior myocardial infarction, previous myocardial infarction, and systolic blood pressure.
Factors associated with one-year mortality among 7-day survivors
| Description | OR | Lower 95% CI | Upper 95% CI | χ2 | P-value |
|---|---|---|---|---|---|
| Age (10 years) | 2.17 | 2.39 | 1.98 | 254.5 | <0.01 |
| Sys. BP (10 mmHg) | 0.92 | 0.96 | 0.89 | 17.1 | <0.01 |
| Heart rate (10 bpm) | 1.19 | 1.24 | 1.14 | 57.3 | <0.01 |
| Previous MI | 1.52 | 1.21 | 1.90 | 12.9 | <0.01 |
| Previous CHF | 1.62 | 1.16 | 2.26 | 7.9 | <0.01 |
| Diabetes | 1.41 | 1.13 | 1.74 | 9.6 | <0.01 |
| Hypercholesterolaemia | 0.75 | 0.58 | 0.96 | 5.0 | 0.03 |
| Smoking | 1.42 | 1.15 | 1.75 | 11.0 | <0.01 |
| Previous CABG | 1.67 | 1.13 | 2.45 | 6.8 | 0.01 |
| PVD | 1.52 | 1.10 | 2.09 | 6.4 | 0.01 |
| Killip class >1 | 2.31 | 1.88 | 2.83 | 63.7 | <0.01 |
| Anterior MI | 1.56 | 1.31 | 1.87 | 23.7 | <0.01 |
C-index for model=0.80.
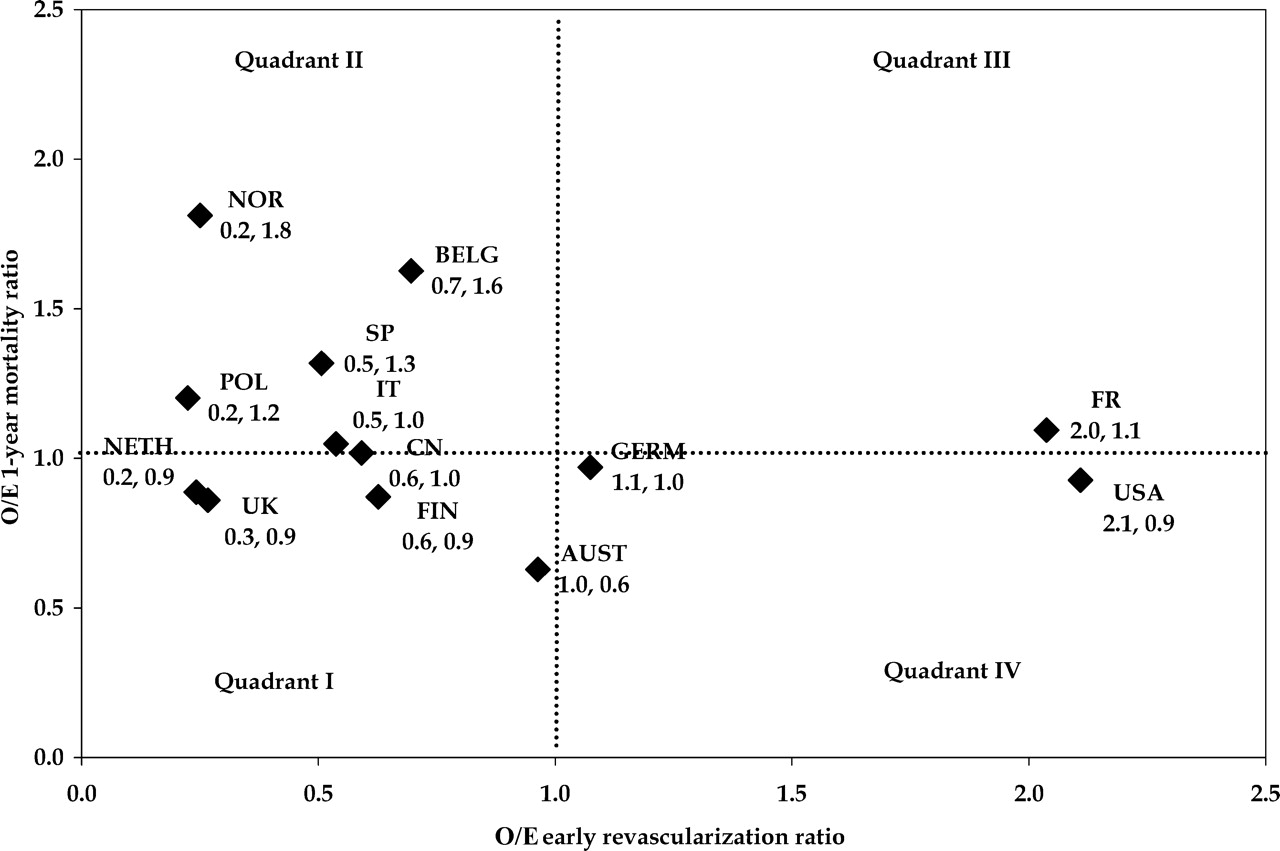
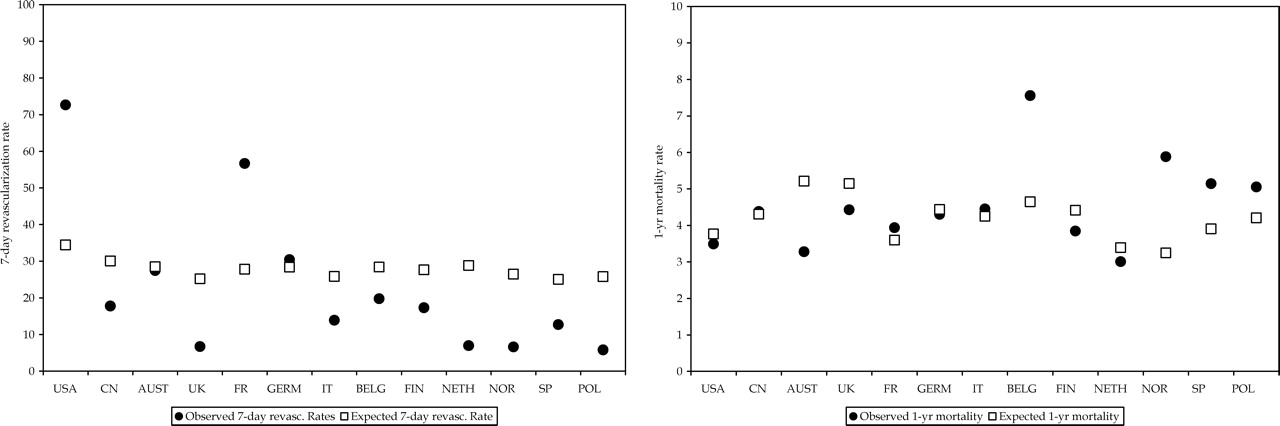
The observed vs. expected rates for both propensity for revascularization within 7-days and 1-year mortality after adjusting for baseline clinical characteristics for each country are presented in Figure 3. The smallest deviation between observed and expected rates of revascularization was observed in Australia and Germany. Belgium, Norway, Spain, and Poland had higher than expected mortality rates. The relationship between risk-adjusted revascularization rates and risk-adjusted 1-year mortality rates was examined graphically (Figure 4). Countries in the lower left quadrant (Quadrant I), such as the UK and Finland, had lower than expected 7-day revascularization rates and lower than expected 1-year mortality rates. Countries in the upper left quadrant (Quadrant II), such as Norway and Belgium, had lower than expected revascularization rates and higher than expected mortality rates. However, countries such as France and USA had almost two times the rate of 7-day revascularization with modest mortality benefits.
Observed and expected rates of 7-day revascularization and 1-year mortality after adjusting for patients' baseline clinical characteristics.
O/E ratio of mortality vs. O/E ratio of revascularization.
Impact of country-level factors
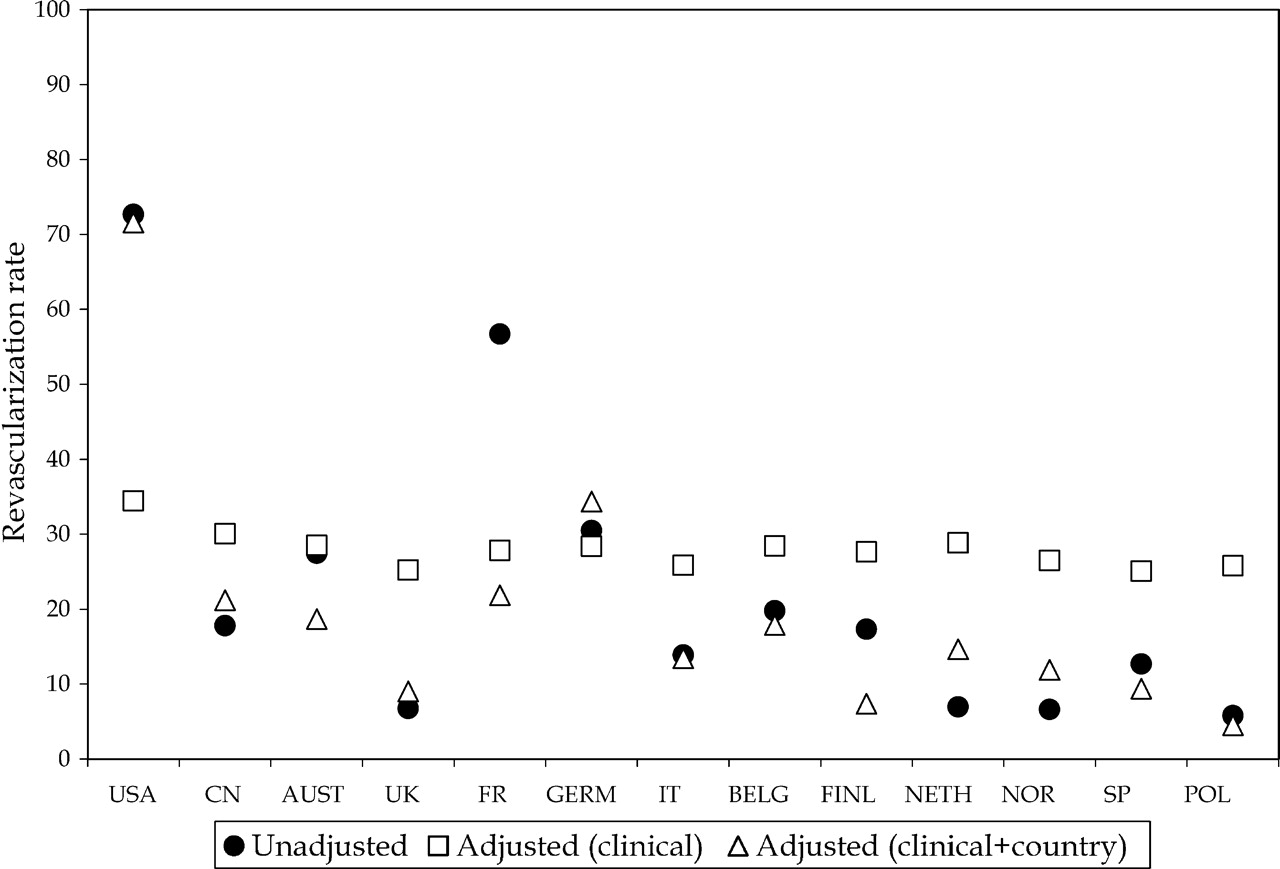
Country-level factors had a significant impact on patients' propensity for revascularization. Addition of life-expectancy and GDP variables into the logistic regression model greatly improved the model's discriminatory power (C-index 0.82, 95% CI: 0.80–0.84). Country-specific revascularization rates—unadjusted, adjusted for clinical factors, and adjusted for clinical and country factors—are presented in Figure 5. Country factors increased patients' propensity for revascularization within 7 days in USA and in Germany and decreased their propensity in all other countries.
Country-specific unadjusted rate of revascularization, revascularization rate adjusted for clinical characteristics, and revascularization rate adjusted for clinical characteristics and country characteristics.
The impact on country factors, in terms of the deviation between patients' propensity for revascularization based on clinical factors alone and that based on clinical and country factors is presented in Table 5. In a logistic regression analysis, patients' propensity for revascularization based on clinical factors alone was associated with significantly lower odds of 1-year mortality (OR 0.97, 95% CI: 0.96–0.99). However, the impact of the deviation between patients' propensity based on clinical factors alone vs. that based on clinical and country factors, did not have a significant impact on 1-year mortality outcomes. Comparing the nested models, the full model including the clinical and country factors and the reduced model including only the clinical factors, resulted in a non-significant likelihood ratio (χ2 likelihood ratio=3.2, P≈0.08) confirming that the country-level variables were not significantly associated with mortality outcomes among 7-day survivors of acute myocardial infarction receiving fibrinolytic therapy.
Actual vs. predicted rates of revascularization among 7-day survivors
| Country | Actual revascularization rate | Actual 1-year mortality rate | Propensity for revascularization based on patients' clinical factorsa±SD | Propensity for revascularization based on clinical+country factorsb±SD | Deviationc |
|---|---|---|---|---|---|
| USA | 72.7 | 3.5 | 34.4±11.5 | 71.6±7.0 | +37.2 |
| Canada | 17.8 | 4.4 | 30.1±10.1 | 21.2±5.0 | −8.9 |
| Australia | 27.5 | 3.3 | 28.5±10.1 | 18.7±4.5 | −9.8 |
| UK | 6.7 | 4.4 | 25.2±8.2 | 9.0±2.3 | −16.2 |
| France | 56.7 | 3.9 | 27.8±8.7 | 21.9±4.8 | −6.0 |
| Germany | 30.5 | 4.3 | 28.4±8.9 | 34.3±6.7 | +6.0 |
| Italy | 13.9 | 4.5 | 25.9±7.7 | 13.4±3.2 | −12.4 |
| Belgium | 19.8 | 7.6 | 28.4±9.4 | 17.9±4.5 | −10.5 |
| Finland | 17.3 | 3.8 | 27.6±8.9 | 7.4±2.1 | −20.3 |
| The Netherlands | 7.0 | 3.0 | 28.8±8.4 | 14.7±3.3 | −14.2 |
| Norway | 6.6 | 5.9 | 26.5±8.0 | 11.9±3.0 | −14.6 |
| Spain | 12.7 | 5.1 | 25.1±7.9 | 9.4±2.3 | −15.7 |
| Poland | 5.8 | 5.1 | 25.8±7.9 | 4.5±1.2 | −21.3 |
SD, Standard deviation.
aC-index=0.64.
bC-index=0.82.
cDifference in patients' propensity rates based on clinical factors (Column 4) and those based on clinical and country factors (Column 5).
Discussion
Using data from GUSTO-V, a recent large international clinical trial of STEMI, we examined the relationship between revascularization within 7 days following fibrinolytic therapy and 1-year mortality. Our study has several important findings. First, overall revascularization following fibrinolytic therapy appears to be associated with better 1-year mortality outcomes. These results are consistent with those observed among 14 day survivors in the Swedish registry.3
Secondly, as previously documented, there is considerable geographic variation in 7-day revascularization rates post-fibrinolysis.2,17 However, it appears that only a portion of this variation is explained by differences in the clinical characteristics of patients. As shown in Table 5, the propensity for 7-day revascularization based only on baseline characteristics was significantly different from the actual revascularization rates in all countries. In USA and France, revascularization rates were significantly higher than expected, whereas Canada, UK, Italy, The Netherlands, Spain, and Poland had significantly lower rates than those estimated using baseline variables. In fact, when we included country level variables such as percentage of GDP expenditure on health and life expectancy, the predictive power of our model improved considerably (C-index increased from 0.63 to 0.82). This suggests that system variables such as the availability of health care resources and the overall health of the population have an impact on intervention rates in this population.
Thirdly, and perhaps most importantly, our study documents a threshold effect of the impact of the rate of revascularization within 7 days on 1-year mortality. The country-specific optimal rate of revascularization following fibrinolysis may be estimated as a function of its patients' baseline characteristics. Countries with actual revascularization rates well below expected rates based on their patients' clinical characteristics, such as Poland, Belgium, Italy, Spain, and Norway, may be able to improve their patients' outcomes by increasing overall revascularization rates. However, positive deviation from risk-adjusted rates (adjusted for patient clinical factors alone) as a result of country-level factors had no impact on 1-year mortality outcomes. Therefore, in countries like USA, with revascularization rates significantly higher than expected revascularization rates, there are significant opportunities for more economically efficient care delivery without adversely affecting patient mortality.
Fourthly, despite the relationship between revascularization and 1-year mortality, it appears that differences in revascularization rates between countries does not entirely account for inter-country differences in 1-year mortality. In general, countries with very low rates of revascularization, such as Poland, Norway, Spain, and Belgium had the highest mortality rates. However, there were also notable deviations from this pattern. For example, The Netherlands had the lowest mortality rates, despite having one of the more conservative revascularization practices. Similarly, at the other end of the spectrum, USA with the highest revascularization rate of 71% did not achieve the lowest mortality rate. Both Australia with 28% revascularization rate and The Netherlands with 8% revascularization rate had a lower adjusted mortality rate than USA, suggesting that factors other than revascularization and clinical characteristics of patients, such as the use of evidence-based medications, may account for the differences in mortality across countries. Our inability to examine these other factors remains a limitation of our study.
In GUSTO-V, there was no systematic assessment of the success of thrombolytic therapy and cardiac catheterization and revascularization were performed at the discretion of the investigator. As shown in Table 2, PCI accounted for most of the revascularization procedures in GUSTO-V. Although a majority of the PCI procedures across all countries involved coronary stent implantation, there was considerable international variation in the rates of transfers and times to PCI. Although some studies, conducted in the stent era, have found improved outcomes associated with routine early PCI, the recent ASSENT-4 PCI trial of primary vs. tenecteplase-facilitated PCI found an excess of 90-day mortality, shock, or congestive heart failure in the facilitated PCI arm: this was coupled with a significant interaction between stent use and worse outcomes.18–22 Evidence around the use of rescue PCI after failed thrombolytic therapy remains equivocal, however. The recent REACT study found a significant improvement in event-free survival among patients who underwent rescue PCI after failed thrombolytic therapy compared with repeat thrombolysis or conservative treatment.23 This finding was different from that reported by the MERLIN trial in which the only improvement associated with rescue angioplasty was a reduction in subsequent revascularization.24 However, both these studies were relatively small and larger trials are needed to address these issues.
Although our study has the advantage of assessing a large sample of homogenous patients with detailed clinical data, it is feasible that a longer follow-up beyond 1-year could yield different conclusions.4 Revascularization may also have a significant impact on quality of life outcomes; however, this was beyond the scope of our study, and no data on these outcomes were collected as part of GUSTO-V. We restricted our primary analysis of the relationship between propensity for revascularization and 1-year mortality to 7-day survivors. This is an established method of assuring that the results are not biased by early hazard among patients who were not revascularized.3 Among the 589 7-day deaths that were excluded from the analysis, only 70 (<0.5% of overall population) underwent revascularization. We therefore do not believe that the exclusion of these patients affected the results of our study.
The focus of our paper was examining variation in international rates of revascularization and how this variation impacts 1-year mortality. However, geographic regions within countries may also be heterogeneous with respect to revascularization rates: our analysis does not explore this issue. Patients included in the study were enrolled at 714 sites across the countries. Differences in site characteristics (such as availability of on-site revascularization facilities) may explain some of the country level variation. However, no site-level information was collected as part of the study and remains a major limitation. Lastly, our revascularization rates capture procedures during the first 7 days or index admission (whichever was shorter). Therefore, we may have underestimated procedure rates if revascularization occurred in subsequent hospitalizations. However, our objective was to examine the relationship between early revascularization (day 7) and mortality and many of the countries with low revascularization rates had longer median lengths of stay (Poland: 12; UK: 6; and The Netherlands: 8 days) than the average, reducing the potential for this underestimation.
Conclusion
In this analysis of a large contemporary international clinical trial of ST-elevation myocardial infarction, revascularization following fibrinolytic therapy appears to be associated with the benefit of lower mortality. Our findings deserve prospective testing and confirmation. Our study also shows that there is potential for some countries (Norway, Belgium, Spain, Italy, Poland) with lower than expected 7-day revascularization rates to improve their clinical outcomes. Similarly, the potential exists in some countries (USA and France) for more economically efficient delivery of care without a deleterious effect on mortality.
Acknowledgements
The GUSTO-V trial was funded by Centocor (Malvern, PA, USA) and Eli Lilly (Indianapolis, IN, USA).
Conflict of interest: the sponsors of the clinical trials had no role in the design, analysis, interpretation, or the writing of the report.
References
Author notes
This paper was guest edited by Prof. Freek W.A. Verheugt, University Medical Center Nijmegen, The Netherlands

