Abstract
Aims: To assess observations with multimodality imaging of the Absorb bioresorbable everolimus-eluting vascular scaffold performed in two consecutive cohorts of patients who were serially investigated either at 6 and 24 months or at 12 and 36 months.
Methods and results: In the ABSORB multicentre single-arm trial, 45 patients (cohort B1) and 56 patients (cohort B2) underwent serial invasive imaging, specifically quantitative coronary angiography (QCA), intravascular ultrasound (IVUS), radiofrequency backscattering (IVUS-VH) and optical coherence tomography (OCT). Between one and three years, late luminal loss remained unchanged (6 months: 0.19 mm, 1 year: 0.27 mm, 2 years: 0.27 mm, 3 years: 0.29 mm) and the in-segment angiographic restenosis rate for the entire cohort B (n=101) at three years was 6%. On IVUS, mean lumen, scaffold, plaque and vessel area showed enlargement up to two years. Mean lumen and scaffold area remained stable between two and three years whereas significant reduction in plaque behind the struts occurred with a trend toward adaptive restrictive remodelling of EEM. Hyperechogenicity of the vessel wall, a surrogate of the bioresorption process, decreased from 23.1% to 10.4% with a reduction of radiofrequency backscattering for dense calcium and necrotic core. At three years, the count of strut cores detected on OCT increased significantly, probably reflecting the dismantling of the scaffold; 98% of struts were covered. In the entire cohort B (n=101), the three-year major adverse cardiac event rate was 10.0% without any scaffold thrombosis.
Conclusions: The current investigation demonstrated the dynamics of vessel wall changes after implantation of a bioresorbable scaffold, resulting at three years in stable luminal dimensions, a low restenosis rate and a low clinical major adverse cardiac events rate. Clinical Trial Registration Information: http://www.clinicaltrials.gov/ct2/show/NCT00856856
Introduction
Bioresorbable scaffolds have to face multiple challenges which justify the careful evaluation of this novel technology. First of all, the polymeric scaffolds have to match the mechanical properties of metallic stents. It has been demonstrated that the acute recoil of a novel scaffold was not inferior to the one observed with an equivalent device in metal1,2. Secondly, it has been established in human testing that the mechanical integrity and the absence of recoil were maintained over a period of six months3. During that time lapse, the biological process of restenosis, consisting of neointimal formation and constrictive remodelling, is known to subside and therefore does not justify the implantation of a permanent metallic prosthesis4. In the following months, it has been shown that physiological and pharmacological vasomotion reappears, confirming the fact that the scaffold loses its mechanical stiffness as the amorphous tie chains between crystal lamellae of polylactide are hydrolysed (Figure 1)5. Afterwards, the polymer is progressively replaced by a malleable provisional matrix of proteoglycan6. Despite its malleable and deformable structure the scaffold does not undergo any reduction in area7. Following the coverage of struts and loss of mechanical support, it is assumed that the vessel can respond to pharmacological agents that reduce the plaque burden behind the struts without creating any malapposition, since the malleable and dismantling scaffold will follow the adaptive Glagovian remodelling of the vessel wall.
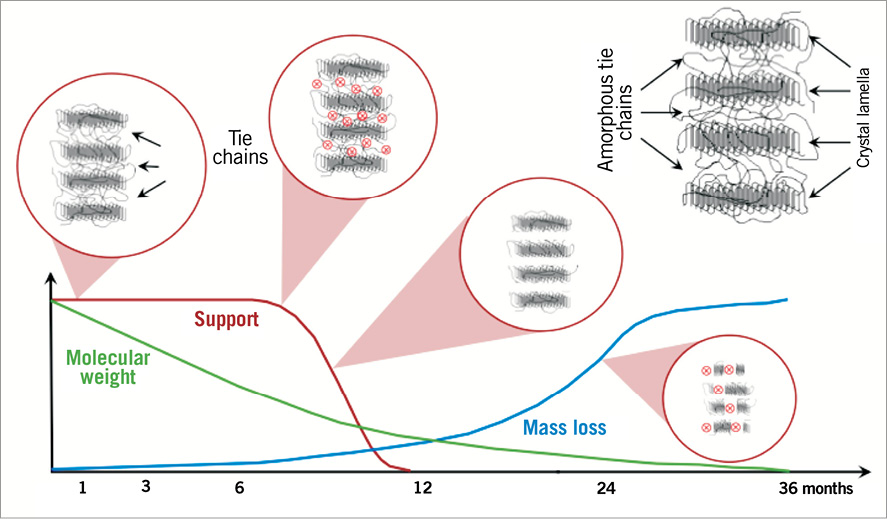
Figure 1. The Absorb bioresorbable vascular scaffold poly-L-lactide bioresorption process up to 36 months, when the polymeric device is expected to be fully resorbed. 1) Polymer hydration following implantation. Polylactides are hydrophilic thus water can penetrate the implant. 2) Depolymerisation by hydrolysis, observed as a reduction in molecular weight (green line). 3) Polymer fragmentation into segments of low-weight polymer due to the scission of amorphous tie chains linking the crystalline regions, resulting in subsequent gradual loss of the radial strength (red line). 4) Assimilation or dissolution of monomers. The soluble monomer (e.g., L-lactate) is changed into pyruvate which eventually enters the Krebs cycle and is further converted into carbon dioxide and water, eliminated by the lung and kidney30.
Optical coherence tomography (OCT) has provided the investigators with an extraordinary imaging tool capable of scrutinising micro-discontinuity of struts3, but this optical technique cannot differentiate the polylactide from proteoglycan which is one of the first structural changes to occur in vascular repair6. However, the technique can precisely quantify, in microns, the thickness of the tissue layers that isolate the superficial plaque from the lumen8. In contrast, ultrasonic interrogation of the polymeric strut can monitor the bioresorption process9,10. Palpography, using radiofrequency backscattering, has been able to analyse the subtle changes in vascular strain and can detect the return of the physiological cyclic strain11,12.
Rarely has a novel revascularisation technique been so intensively scrutinised during the early days of its development – the sequential assessment over three years provides new observations but potentially also raises new questions. The ultimate expectation of this novel technology is the occurrence of late lumen enlargement, associated with wall thinning and adaptive remodelling13.
The Absorb BVS device (Abbott Vascular, Santa Clara, CA, USA) was tested in 101 patients of the ABSORB Cohort B Trial which was subdivided into two groups of patients: the first group (B1) underwent invasive imaging with QCA, IVUS greyscale, IVUS-VH and OCT at six and 24 months, whereas the second group (B2) reported in detail in the current manuscript underwent invasive imaging at 12 months and at 36 months. The purpose of the present report is to describe the multimodality imaging performed post-procedure, at 6, 12, 24 and 36 months and to report the clinical follow-up at 36 months of the entire cohort of patients. (NCT00856856)
STUDY POPULATION
The study population, study device, study procedure and definitions have been previously described3,7,9. Angiographic assessment, vasomotion test, IVUS greyscale analysis and IVUS-based radiofrequency backscattering were analysed in an independent core lab. The study was sponsored by Abbott Vascular (Santa Clara, CA, USA).
STUDY DEVICE
The Absorb BVS consists of a polymer backbone of Poly (L-lactide) (PLLA) coated with a thin layer of a 1:1 mixture of Poly-D, L-lactide (PDLLA) polymer, and the antiproliferative drug everolimus to form an amorphous drug-eluting coating matrix containing 100 micrograms of everolimus/cm2 of scaffold3,14. To enhance the mechanical strength of the struts and to reduce acute and late recoil, the strut design and the manufacturing process of the polymer were modified from the first version of the device. The new design has in-phase zigzag hoops linked by bridges that allow a more uniform strut distribution, reduce maximum circular unsupported surface area and provide more uniform vessel wall support and drug transfer. Additionally, a modified manufacturing process eliminated impurities such as monomer, oligomer and solvents, which resulted in a slower hydrolysis (in vivo degradation) rate of the polymer, thus preserving its mechanical integrity for a longer period of time. The actual duration of resorption of the second generation is in vivo approximately 18 months longer than the first generation, and the mass loss of the second-generation Absorb scaffold takes approximately 36 months.
ANGIOGRAPHIC ASSESSMENT
In each patient, the scaffolded segment and the peri-scaffold segments (defined by a length of 5 mm, proximal and distal to the scaffold edge) were analysed by quantitative coronary angiography (QCA) post-procedure and at follow-up, using an interpolated method for the reference vessel diameter (RVD)3,7,9.
VASOMOTION TEST
Changes in vasomotion (mean lumen diameter) prior to, and post-nitrate were assessed in paired matched angiographic view(s) in the scaffolded segment and in the 5 mm proximal and 5 mm distal adjacent segments3,7,9.
IVUS GREYSCALE ANALYSIS
Treated vessels post-procedure and at follow-up were examined with phased array intravascular ultrasound catheters (EagleEye™; Volcano Corporation, Rancho Cordova, CA, USA) using a pullback speed of 0.5 mm per second. The region of interest, beginning 5 mm distal to, and extending 5 mm proximal to the treated segment, was examined15. There are three contours that can be delineated by IVUS: the endoluminal contour (lumen area), the leading edge of the struts (scaffold area), and the EEM area (vessel area). There are thus four compartments that can be quantified in IVUS: the luminal area, the neointimal area between the lumen and the scaffold contours (=scaffold area–lumen area), the plaque behind the area of the struts (=vessel area–scaffold area) and the vessel area. Incomplete apposition was defined as one or more scaffold struts separated from the vessel wall, while acquired late incomplete apposition was defined as incomplete apposition at follow-up that was not present post-procedure15. For echogenicity assessment of polymeric struts at baseline and follow-up, a computer-aided greyscale value analysis programme for strut characterisation was used16,17.
IVUS RADIOFREQUENCY ANALYSIS
Backscattering of radiofrequency signals provides information on vessel wall tissue composition (IVUS-VH)18-21. Four tissue components (necrotic core [NC] - red; dense calcium [DC] - white; fibrous [F] - green; and fibro-fatty [FF] - light green) were identified with autoregressive classification systems, and expressed as percentages (per cross-section, NC+DC+FF+F=100%)18,19. The change in quantitative analyses of these areas between implantation and follow-up was used as a surrogate assessment of the chemical and structural alteration of the polymeric struts3,7,9.
OCT
As an optional investigation, intravascular OCT imaging using either a time-domain OCT (M3 system; LightLab Imaging [LLI], Westford, MA, USA) or a frequency-domain OCT (C7XR system; LLI) was performed at baseline and at follow-up14,22-26. None of the OCT acquisition was performed with an occlusion technique. The OCT measurements were performed either at 1 mm longitudinal intervals or at 200 micron intervals (strut core analysis) within the treated segment, using proprietary software for offline analysis (LLI). Details of the analysis method have been previously described3,27-29.
The thickness of the coverage was measured between the endoluminal side of the strut core and the boundary of the lumen, drawing the line of measurement from the mid part of the endoluminal edge of the black core of the struts toward the centre of gravity of the lumen in the analysed cross-section30. The threshold for the coverage is 30 microns, which corresponds to the average inter-observer measurement (300 struts analysed two times, 35±6 μm) of the endoluminal light backscattering frame of the strut. At three years, the appearance of the struts can be detected as a black core which sometimes displays irregular high-intensity areas, possibly indicative of the presence of de novo connective tissue (cellularisation) that progressively replaces the proteoglycan that is initially present after the resorption of the polymer.
STATISTICAL ANALYSIS
For binary variables, percentages were calculated. Continuous variables are presented as mean and standard deviation. In cohort B2, overall comparison of serial measurement was assessed by applying the Friedman test, and pairwise comparisons between post-procedure and follow-up were performed by a Wilcoxon signed-rank test adjusted by the Bonferroni method.
For imaging assessment, serial analysis including pre-TLR assessment is presented in the tables, while truly serial analysis of each time point excluding pre-TLR values is presented in the supplement.
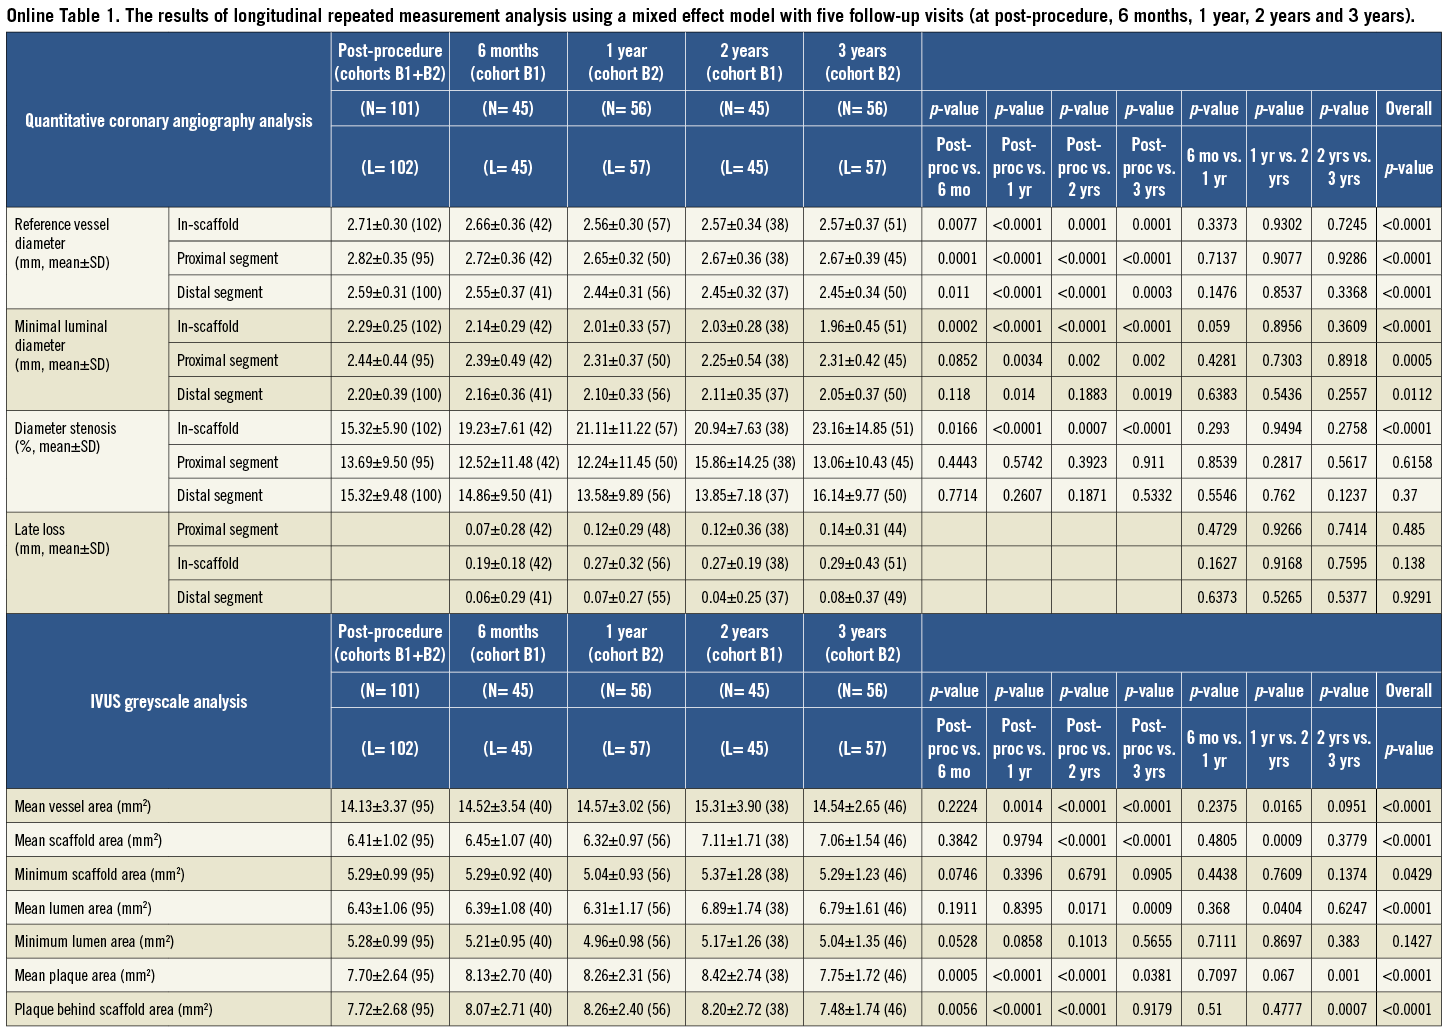
To assess the changes of imaging variables over time, the longitudinal repeated measurement analysis using a mixed effect model with five follow-up visits (at post-procedure, 6 months, 1 year, 2 years and 3 years) was performed in the SAS procedure PROC MIXED by pooling two cohorts (B1 and B2), as these two groups of patients were comparable in baseline characteristics. Compound symmetry covariance structure was used in the mixed model. In fact, there is no additional random effect beyond the residual error in this analysis. The PROC MIXED model is used for its capability to handle longitudinal data with certain missing patterns. The results are presented in the Online data supplement31.
As no formal hypothesis testing was planned for assessing the success of the study, no statistical adjustment was applied. P-values presented are exploratory analyses only and should therefore be interpreted cautiously.
Results
CLINICAL OUTCOME OF THE ENTIRE COHORT OF THE COHORT B (COHORTS B1 AND B2)
A total of 101 patients were enrolled in this study and the same investigational device (Absorb BVS first generation 1.1) was successfully implanted in all patients (Table 1). Additional metallic drug-eluting stents were implanted in three lesions. Clinical follow-up at three years was available in all but one patient who withdrew consent, although the vital status of the patient was available through the referring physician. During the three-year follow-up period, there were no possible, probable, or definite scaffold thromboses32. There were three non-Q-wave myocardial infarctions and seven ID-TLRs, which resulted in a three-year major adverse cardiac event rate of 10% (Table 2). Dual antiplatelet therapy was maintained in 98% (99/101), 81.2% (82/101), 24.0% (24/101) and 21.6% (21/97) at 6, 12, 24 and 36 months, respectively.
CLINICAL OUTCOMES OF THE COHORT B2 WITH IMAGING FOLLOW-UP AT 12 AND 36 MONTHS
Clinical events up to 24 months have been previously reported3,7,9. Between one and three years, three ischaemia-driven (ID) target lesion revascularisations (TLR) and two non-ID TLR events occurred (Figure 2). The first patient received a 3.0×18 mm Absorb BVS in a large proximal LAD with a maximal diameter of 3.9 mm, resulting in 270 degrees of malapposition post-procedure. The one-year angiographic follow-up showed no restenosis in the scaffolded segment while OCT demonstrated extensive malapposition. The patient presented with Braunwald Class I unstable angina on day 564. Repeat angiography on day 567 revealed a significant in-scaffold restenosis, and the patient received a 3.0×18 mm XIENCE V® stent (Abbott Vascular). The three-year angiography revealed no restenosis in this metallic drug-eluting stent. The second patient had recurrent stable angina (CCS Class II) with reversible anterior ischaemia on myocardial scintigraphy. Follow-up coronary angiography at day 833 revealed a restenosis (% DS: 64%) of the scaffold in the mid LAD, which was treated with a 3.0×23 mm XIENCE V stent. The third patient, who had received a 3.0×18 mm Absorb BVS scaffold in the proximal RCA, underwent one-year planned angiography that revealed a progression of coronary stenoses in the distal RCA and the distal LM. The patient underwent CABG on day 439 but presented with unstable angina on day 590. Repeat angiography demonstrated a significant new lesion (% DS: 74%) in the mid RCA proximal and distal to the anastomosis of a coronary bypass, including the distal bifurcation. Despite the absence of restenosis in the Absorb BVS scaffold (in-segment late loss 0.02 mm, in-scaffold late loss 0.12 mm), a 4.0×38 mm Promus Element stent was placed across the new lesion in the mid RCA with a short overlap of the Absorb BVS scaffold. Because of the overlap, the event was adjudicated by the independent clinical events committee as ID-TLR, although the ARC definitions of TLR pertain specifically to repeat procedures due to restenosis of the device or its adjacent segments 5 mm proximal and distal to the device32.
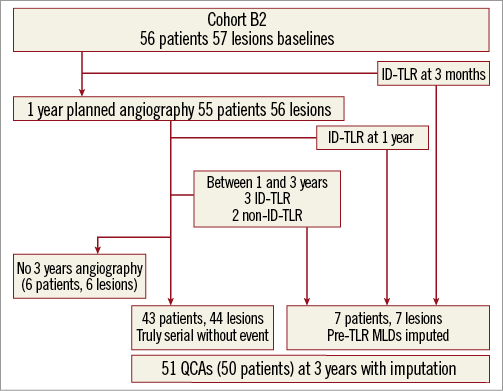
Figure 2. Patient flow chart of cohort B2. ID: ischaemia-driven; QCA: quantitative coronary angiography; TLR: target lesion revascularisation
One patient underwent a non-ID-TLR at two years due to persistent incomplete strut apposition observed on OCT without any evidence of ischaemia. The other patient (102913-012) had a non-ID-TLR in the proximal LAD at day 722 to treat a new stenosis in the left main trunk without binary restenosis in the Absorb BVS scaffold (in-scaffold LL: 0.55 mm, in-segment LL: 0.38 mm). During the process of stent implantation in the left main stem, the proximal part of the scaffold was dilated by a balloon and therefore the event was adjudicated as non-ID-TLR despite absence of binary restenosis in the scaffolded segment.
QUANTITATIVE CORONARY ANGIOGRAPHY AT 6, 12, 24 AND 36 MONTHS
The late loss at 6, 12, 24 and 36 months was 0.19, 0.27, 0.27 and 0.29 mm, respectively (Figure 3). In the group without TLR, the average late loss was similar at one year (0.22 mm) and three years (0.20 mm). For the entire cohort (n=101), there were six in-segment restenoses at three years with a binary restenosis rate of 6%.
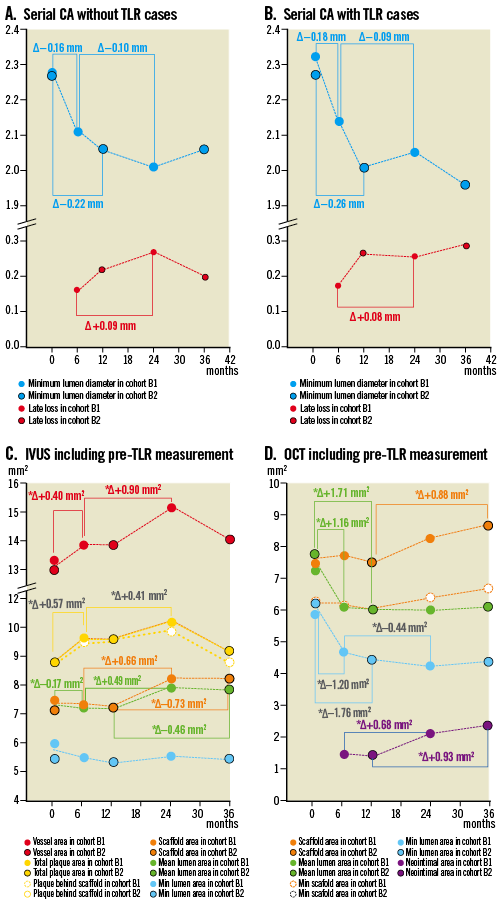
Figure 3. The four panels illustrate graphically the measurements in QCA without pre-TLR value (A), QCA with pre-TLR (B), IVUS (C) and OCT (D) performed post-procedure, at 6, 12, 24 and 36 months. The different parameters are colour-coded.
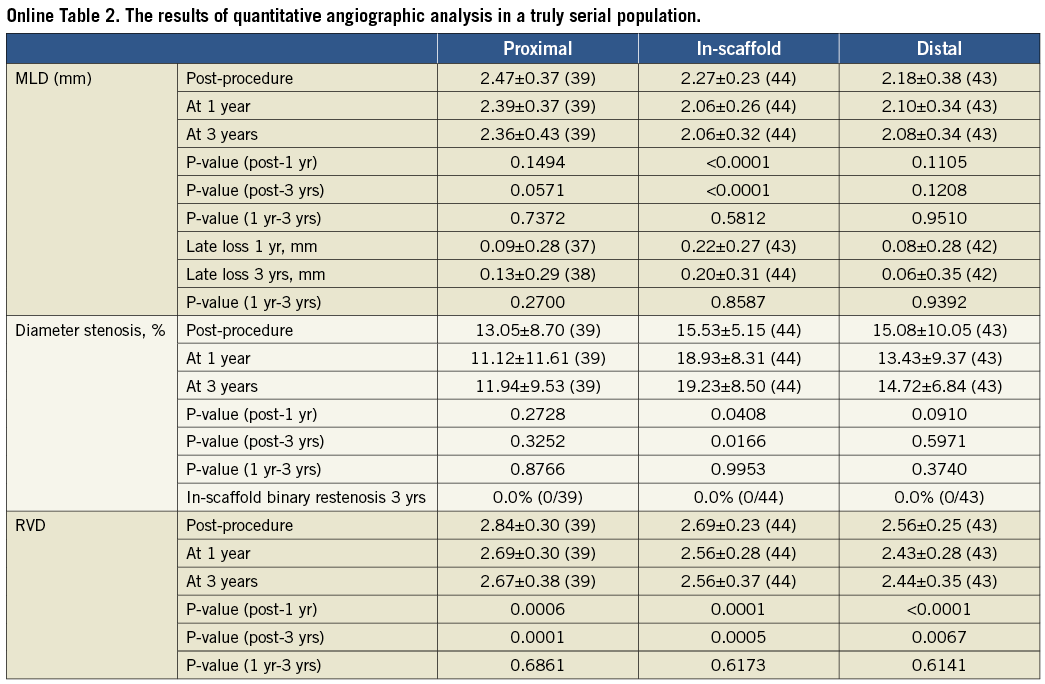
In Table 3, the angiographic results of one and three-year follow-up, including pre-TLR values, are presented. Among the five cases with TLR between one year and three years, three were clinically driven while two were not. Among the three clinically driven TLR, two presented with a binary restenosis in the scaffolded segment (Figure 4). In carrying forward the last observation at the time of TLR, there were between one and three years, and no statistically significant differences in MLD, late loss, diameter stenosis and reference diameter in the patients with serial QCA data.
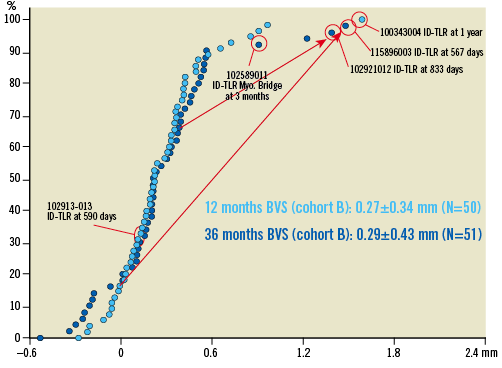
Figure 4. Cumulative frequency distribution curves of angiographic late loss at one (light blue) and three years (dark blue) including QCA values at the time of target lesion revascularisation whenever it occurs (see text). The red arrows indicate the important changes in late loss between one and three years in patients who underwent ID-TLR (ischaemia-driven target lesion revascularisation).
VASOMOTION REACTION TO NITRATE (COHORT B2)
In 47 patients the mean lumen diameter inside the scaffold measured prior to and following intracoronary injection of nitrate showed a significant increase in the scaffold from 2.45±0.37 mm to 2.50±0.39 mm (p=0.005). Figure 5 shows the relative changes of mean LD in the proximal, distal and scaffolded segments.
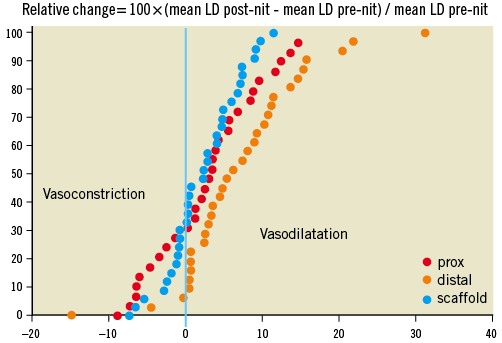
Figure 5. Cumulative frequency distribution curves of relative changes (%) of mean lumen diameter after nitrate administration in the proximal (red), scaffold (blue) and distal (orange) segments. Relative change (in percentage) was calculated as changes in mean diameter prior to and after intracoronary nitrate administration divided by mean lumen diameter prior to nitrate. In the scaffold and proximal segments, one third of the lesions showed paradoxical vasoconstriction, while in the distal segment only 10% of the lesions showed such vasomotion.
IVUS POST-PROCEDURE, AT 6, 12, 24 AND 36 MONTHS
IVUS analysis is available post-procedure and at 6, 12, 24 and 36 months (Figure 3). Results of the measurement at 6, 12 and 24 months have been previously published3,7,9. In the cohort B2, serial IVUS analysis is available post-procedure, at 12 and 36 months in 44 patients with 45 lesions, including three pre-TLR IVUS values (Table 4).
In the overall analysis (Figure 3 and Online data supplement), one of the most striking observations was the significant increase in mean scaffold, mean lumen, mean total plaque and mean vessel area between the first and the second year of observation. This enlargement of the scaffold accounted for the modest increase in neointimal area at two years (0.25 mm2) detected by ultrasound, so that the minimal lumen area remained unchanged at 12 and 24 months. Mean lumen area did increase significantly between 12 and 24 months (Online data supplement).
Between two years and three years there was a substantial plaque reduction following the stepwise increase at six months, one year and two years. The result is a small non-significant increase between post-procedure and three years (Δ+0.27 mm2, p=0.08). The expansive remodelling in vessel area documented at two years regressed considerably at three years in parallel with the reduction in plaque behind the struts.
In patients with serial IVUS at one and three years, incomplete apposition was observed at three years in three patients with an average malapposed area of 1.05±0.97 mm2. Two patients had malapposition at baseline, which resolved at one and three years. At one year, two patients presented with late acquired malappositions, which were resolved at three years. Three patients, who had no malapposition at baseline and one year, developed malapposition at three years.
IVUS ECHOGENICITY AND VH ANALYSIS POST-PROCEDURE, AT 6, 12, 24 AND 36 MONTHS
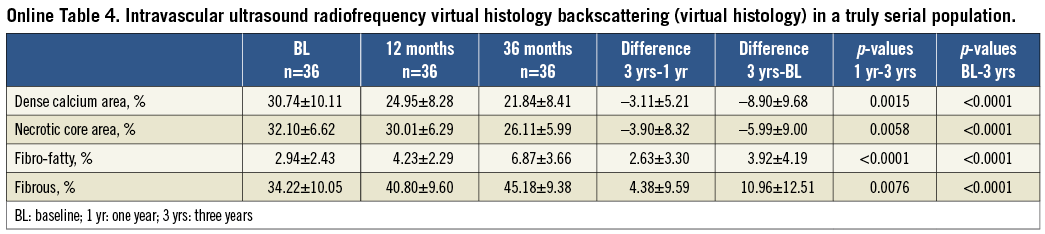
The results at 6, 12 and 24 months have been published previously3,7,9. The results of echogenicity and VH analysis are presented in Figure 6. Percent hyperechogenicity on greyscale and radiofrequency backscattering from dense calcium and necrotic core decreased substantially between the first and third year, whereas fibrous and fibro-fatty tissue increased significantly between the first and third year.
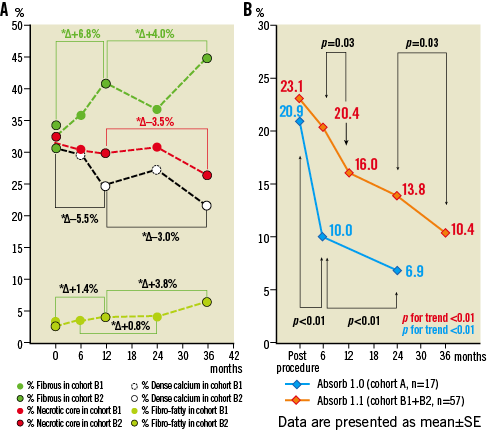
Figure 6. The two panels illustrate graphically the measurements in IVUS-VH (A) and echogenicity (B) performed post-procedure, at 6, 12, 24 and 36 months. Figure shows the changes in virtual histology over time –the polymeric struts are initially detected as pseudo dense calcium surrounded by necrotic core and interfere with the assessment of endogenous dense calcium and necrotic core. However, the sharp decrease in dense calcium and necrotic core between 24 and 36 months may also reflect the end of the inflammatory process with regression of the plaque behind the struts as illustrated in panel C of Figure 3. The steady increase of the fibrous and fibro-fatty component may correspond to the neointimal formation. Changes in % hyperechogenicity over time in the ABSORB cohort B (orange line) and cohort A (blue line). For echogenicity assessment of the polymeric struts at baseline and follow-up, a computer-aided greyscale value analysis programme for strut characterisation was used17,18.
OPTICAL COHERENCE TOMOGRAPHY POST-PROCEDURE, AT 6, 12, 24 AND 36 MONTHS
The results at 6, 12 and 24 months have been published previously3,7,9. The overall OCT analysis is graphically illustrated in Figure 3. After an initial decrease in minimal and mean lumen area, the stabilisation of these parameters was observed despite an increase in neointima between one and three years, which was compensated by the parallel increase in mean and minimum scaffold area.
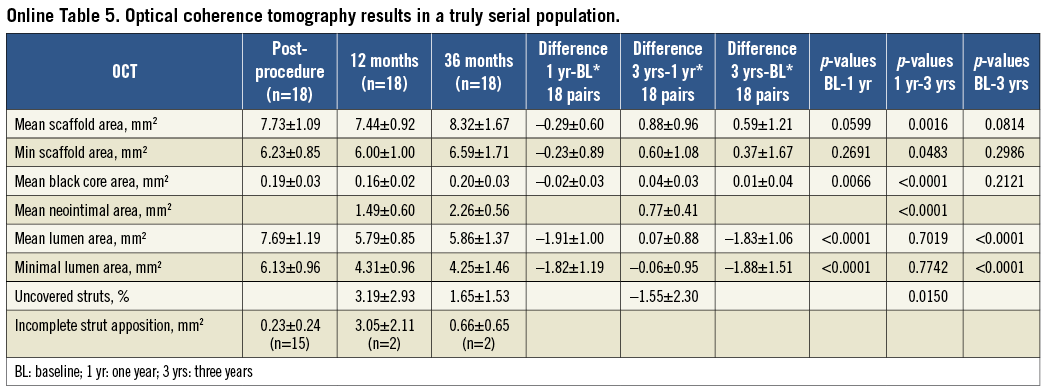
At the time of the trial design the OCT investigation was optional. In cohort B2, 20 patients with 21 lesions underwent an OCT post-procedure. Out of these 21 lesions, 19 underwent serial OCT at one year and three years including two patients with OCT prior to TLR. In cohort B2, OCT measurements demonstrated a significant late scaffold area enlargement (Table 5, mean: Δ0.88±1.72 mm2, p<0.001, mimimum: Δ0.67±1.10 mm2, p=0.03) between one and three years, and a significant increase in neointimal formation (Δ0.93±0.84 mm2, p<0.001) with, as a result, the mean and minimal lumen area remaining stable between the two follow-up time points.
The number of struts counted in an all-frame analysis (200 micron interval) steadily increased from baseline (672.2±32.2) to one year (702.2±48.7) and to three years (726.4±70.1), probably reflecting the dismantling of the scaffold. The mean black core area was unchanged from baseline to three years. The contours of the black box were visually delineated by the analyst of the core lab (every mm frame analysis), resulting in unchanged quantitative assessment of the area. In an all-frame analysis available in 13 patients, the black core volume showed a modest but significant decrease from one to three years. Ninety-eight percent of struts were covered and three scaffolds showed malapposed struts with an average malapposition area of 0.60 mm2.
Discussion
The main findings of the study are the following. 1) Echogenicity and VH analysis suggest advanced bioresorption of the polymeric device. 2) On IVUS, the mean and minimum scaffold areas significantly increase and compensate for the increase in neointimal hyperplasia - resulting in an increase of mean lumen area from one to three years with an unchanged minimal lumen area from one year to three years. The total plaque area shows a biphasic change with an increase between the first and second year and a plaque reduction between the second and third-year follow-up. 3) OCT confirms the IVUS findings regarding the increase in the scaffold area and neointimal area from one to three years. 4) Angiographic late luminal loss between one and three years remains unchanged with a binary in-segment restenosis of 6% for the entire cohort B. 5) The major adverse cardiac events rate at three years remains low.
ADVANCED BIORESORPTION
Figure 6 shows changes in % hyperechogenicity in serial pullbacks at six and 24 months and at one and three years. These two observations are combined since they have a similar rate of bioresorption that nevertheless has not yet reached its minimal value compared to the bioresorption of the cohort A device, using a first-generation scaffold with a faster resorption12. In the preclinical study, full resorption is complete at 36 months. The use of ultrasound to monitor the degradation process of biopolymers has been proposed previously and tested in an in vitro set-up. Wu et al showed that the degradation rate of biodegradable polymers can be closely monitored by ultrasound techniques10.
At variance with this mode of investigation, OCT assessment of the black core volume showed a significant but modest decrease between one and three years. It is important to remember that this optical technique cannot differentiate the polylactide from the provisional matrix of proteoglycan. The preclinical studies have clearly demonstrated by gel permeation chromatography the absence of the polylactide at three years with its replacement by proteoglycan. The black core area was determined by visual contour delineation and does not take into account subtle change in greyness of black cores or the appearance of light reflecting structures inside the black core (Figure 7). Obviously, assessment of light reflectivity should be applied to assess subtle modifications of light absorption and backscattering objectively33. Previous and current (unpublished data) preclinical assessments of histology and OCT have indicated that changes in strut appearance on OCT correspond to the cellularisation of the provisional matrix and the appearance of connective tissues surrounding the cell nuclei stained in black in a Movat histological preparation (Figure 7)6. Preclinical investigation of scaffolded porcine coronary artery models at two, three and four years combining OCT and histology indicated that the next phase will involve shrinkage of the connective tissue filling the strut footprints with, ultimately, the histological disappearance of strut footprints. This last integration process will result in late wall thinning. Wall thinning may impact on lumen enlargement and/or adaptive constrictive remodelling.
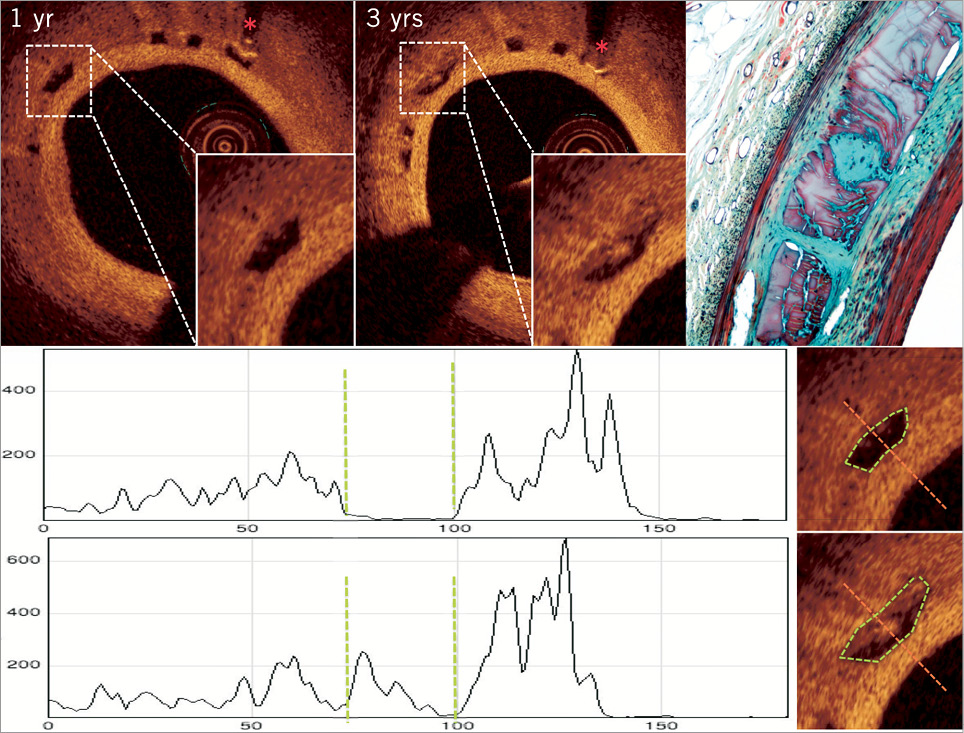
Figure 7. Matched OCT cross-sections according to the presence of distal metallic markers (red asterisks) at one and three years. One of the matched struts next to the marker (asterisk) was analysed by light reflectivity34. At three years, the strut core that was initially black became partially filled by a white nucleus exhibiting high light reflectivity. Tracings at the bottom showed graphically the light reflectivity along the scan line of incident light (red). The vertical green dotted lines correspond to the adluminal and abluminal boundaries of the black core either empty or partially occupied by white nucleus. Histological picture (Movat staining, 20×) of porcine coronary artery 36 months after implantation of Absorb scaffold showed provisional matrix (glycoconjugates) in purple, filling the void previously occupied by the polymeric strut. A cellularised (black dots) area with connective tissue (green staining) is located at the centre of the strut void and is connected by a peduncle to the subintima. Multi-layers of smooth muscle cells are overlying the strut voids. OCT images of the histological structures in a porcine model are very similar to those observed in human. The light intensity was analysed using an open source software (image J software).
Noteworthy is that the persistence of black core on OCT at three years allows for the tracking of the outward displacement of individual struts and for documentation of the increase in scaffold area that clearly occurs between one and three years. At four years, this OCT information will no longer be available since the OCT signal will no longer be visible.
SCAFFOLD ENLARGEMENT: A NEW CONVINCING OBSERVATION
Between one and three years, the OCT assessment documented an enlargement of the scaffold area (0.88 mm2) in parallel with an increase in neointima between and on top of the struts (0.93 mm2). The net result is on average an unchanged mean lumen area (58% showed an increase between one and three years while 42% showed a decrease). It seems that, at three years, a kind of equilibrium between the outward displacement of the scaffold and inward growth of neointimal tissue has been reached. The absence of late luminal loss between one and three years appears to be the net result of this equilibrium (Figure 3, Figure 4).
Preclinical studies demonstrated the full disappearance of the polylactide (gel permeation chromatography) at two years with the first generation of the Absorb BVS (BVS 1.0) and at three years with the second generation (BVS 1.1). During that phase, giant cell granuloma can be observed in the vicinity of the struts and may explain the increase in plaque media in humans between the post-procedure, the six-month and the two-year follow-up. During that phase, the void previously occupied by the polymer is replaced by provisional matrix of proteoglycan that is ultimately going to be cellularised by connective tissues. At three years, granuloma and giant cells have completely disappeared in the histology of the porcine coronary artery implanted with the second-generation Absorb BVS (1.1) and may explain the (pseudo-) regression of the plaque behind the struts on IVUS in humans between two and three years. A similar process of pseudo-regression in cohort A has been previously described by our group34.
The IVUS confirms this outward displacement of the struts between one and two years, evolving in parallel with a plaque increase and outward expansive remodelling. During the third year, the plaque and EEM regress without further changes of the mean lumen and scaffold area. This observation exemplifies the dynamics of vessel wall changes following the implantation of a bioresorbable scaffold that has induced a transient inflammatory process.
DISCREPANCY BETWEEN CHANGES IN IVUS AREA AND OCT AREA BETWEEN 1 AND 3 YEARS
Between one and three years a significant increase in mean lumen area on IVUS with no changes in minimum lumen area was detected, whereas on OCT an unchanged minimal and mean lumen area was seen. Lumen areas of native coronary arteries as measured by IVUS have been shown to be larger than the same areas measured by OCT, a difference that could be attributed to differences in resolution and the physics of backscattering of ultrasound and light from in vivo tissue35. When compared (n=19), the analysis of luminal areas over time is made more complex by the differences between the two techniques (Figure 8). This basic difference in detection of “luminal contour” is dynamically affected at follow-up as illustrated in Figure 8 and explains the absence of changes in mean lumen area (between one and three years) as assessed by OCT, in contrast to the increase in mean lumen area on IVUS.
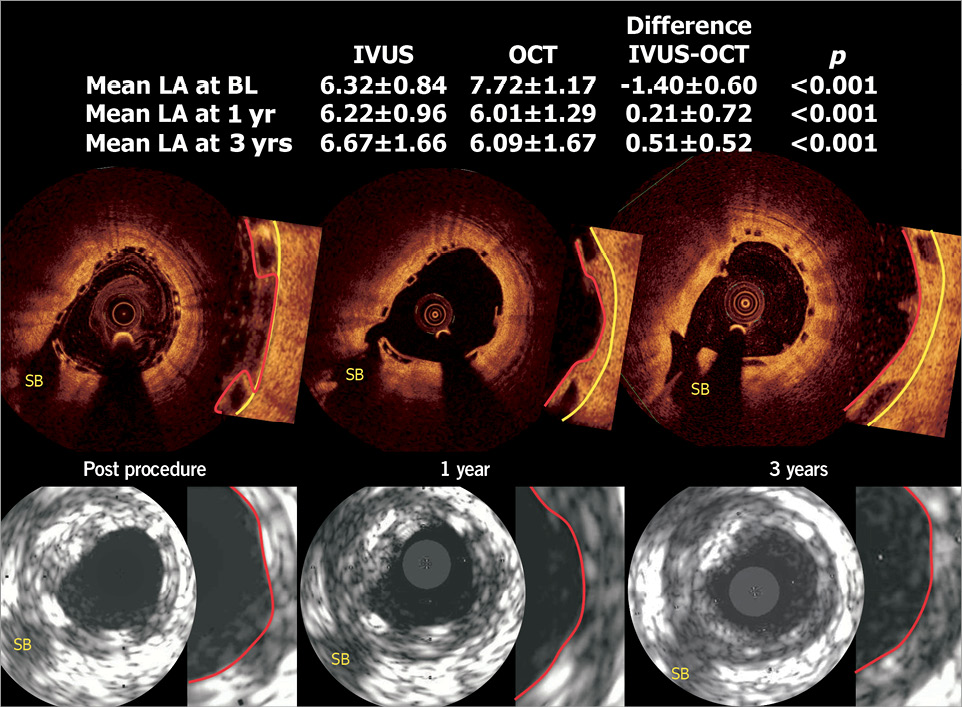
Figure 8. In 19 patients who had undergone both IVUS and OCT investigation, corresponding OCT and IVUS cross-sections (see side branch, SB) images are shown. The IVUS (20 MHz) primarily detected the highly reflective endoluminal surface of the polymeric struts, and is unable to detect with precision the endoluminal contour of the vessel wall between polymeric struts apposed but not embedded in the vessel wall. In other words, the delineation of the luminal contour on IVUS after scaffold implantation relies mainly on the bright interface created by the presence of polymeric struts. In contrast, the luminal dimension as measured by OCT truly reflects and delineates the endoluminal interface of the vessel wall behind the polymeric struts3,30: the polymeric struts do not create abluminal shadows allowing the detection of luminal contours behind and between the struts. At follow-up, neointimal tissue grows between polymeric struts and covers the top of the polymeric struts. This neointimal tissue (in between and on top of struts) is exquisitely detectable by OCT, showing the struts encapsulated by the neointima, whereas the lumen boundaries detected by IVUS were mainly determined by the blooming brightness of the polymeric struts that have not been resorbed. This basic difference in the detection of the “luminal contour” is dynamically affected at follow-up by tissue growth as illustrated in the figure and potentially explains the absence of changes in minimal lumen area (between one and three years) as assessed by OCT, vs. the increase in mean lumen area seen in IVUS. (See table included in the figure, p-value is for difference between IVUS and OCT, calculated by Wilcoxon signed-rank test).
VASOMOTION AND STABLE LATE LOSS AT THREE YEARS
The QCA values described in Table 2 were obtained post-intracoronary administration of nitrate with the exception of one patient who did not receive nitrate. The absolute and relative changes in mean lumen diameter of the scaffold are somewhat smaller than the changes observed in the proximal or distal segments (Figure 5). In this phase of the trial, the investigators were requested to record the blood pressure pre- and post-nitrate, and to wait for the normalisation of the blood pressure. Eventually, they had to reverse the decrease in blood pressure by volume expander if required. Notwithstanding, about 30% of the proximal segments and scaffold segments vasoconstricted, a phenomenon which may be attributed to the baroreceptor activation with a reflex increase in sympathetic tone and release of norepinephrine with secondary stimulation of alpha-1 receptors of the coronary vasculature36,37.
The restoration of the vasodilatory capacity seems to be an ongoing process over time. At six months, no significant vasomotion could be documented in a sequential test combining ergonovine and nitrates3. At one year, significant changes in vasoconstriction and vasodilatation were observed during the same test29. At two years, only intracoronary administration of nitrate was performed and a significant (p=0.035) but modest (0.034±0.09 mm) vasodilatation was observed. At three years, the vasodilatation was accentuated (0.054±0.12 mm) and the overall effect was highly significant (p=0.005).
In cases with (6 mo: 0.19, 1 yr: 0.27, 2 yrs: 0.27, 3 yrs: 0.29, p=0.138) or without TLR (6 mo: 0.16, 1 yr: 0.22, 2 yrs: 0.27, 3 yrs: 0.20 mm, p=0.86), there was no change in the late loss between one and three years. Cumulative frequency distribution curves of late loss at one and three years showed almost perfect superimposition of the two curves in their mid portion (Figure 4). Out of 10 patients showing a negative loss at one year, seven actually increased their negative late loss (or showed positive late gain) at three years. In all these cases, the positive late gain was not associated with malapposition of the struts on OCT.
BINARY RESTENOSIS AND TLR
In the entire population (n=101), the binary in-segment restenosis rate was 6%. ID-TLR was 7%: one patient received a metallic stent without binary in-segment restenosis, but rather for a new lesion located 10 mm distal to the scaffold. The re-PCI was adjudicated as ID-TLR, since the implanted metallic stent overlapped the previously implanted Absorb scaffold.
In cohort B1, there were two cases of in-segment restenosis which have been described previously3,9. In cohort B2, there were four in-segment restenoses (binary in-segment restenosis of 7.8%); one patient had a combination of in-scaffold and edge restenosis (Table 2). Of note, there were two very late (after one year, at 833 and 576 days) binary in-scaffold restenoses with ischaemic evidence and subsequent TLR treated with a metallic drug-eluting stent for which there is no aetiological explanation. In both cases, intravascular imaging confirmed the growth of neointimal tissue inside the scaffold, which was by no means crushed or encroached on by a growing plaque located outside the scaffold. These very late restenoses are not a new entity specific to a bioresorbable scaffold: very late restenoses have also been documented after one year in metallic everolimus-eluting stents. In the SPIRIT II trial, 97 patients had serial angiographic QCA at six and 24 months; seven lesions exhibited an increase in LL of at least 0.8 mm between these two serial follow-up examinations (from –0.34, 0.37, –0.35, 0.37, –0.18, 0.08 mm to 1.15, 1.66, 0.66, 1.28, 0.63, 0.88 mm, respectively). In the SPIRIT II trial, only two patients had ischaemia-driven TLR: one experienced very late stent thrombosis resulting in a non-Q-wave myocardial infarction between day 700 and day 721, and one underwent an ID-TLR at day 701.
In the ABSORB cohort B2, two patients with a myocardial bridge have been included. One with an ID-TLR at three months has been previously reported in great detail30. The second patient had aggravation of late loss from one year (0.96 mm) to three years (1.22 mm). However, this asymptomatic patient did not undergo a repeat procedure since the diameter stenosis, conventionally measured on the end-diastolic angiographic frame, was 48%. Of note, in this patient at one year the intracoronary administration of acetylcholine triggered a transient total occlusion which was immediately relieved by intracoronary nitrate. Currently, it is assumed that the systolic stress of a myocardial bridge on the scaffold (±110,000 cycles per day) is not compatible with an effective prevention of restenosis. It would be prudent to consider myocardial bridging as a contraindication for treatment with a bioresorbable scaffold.
IVUS GREYSCALE INTERPRETATION OF THE ANGIOGRAPHIC STABLE LATE LUMINAL LOSS
The main long-term hypothesis is that late lumen enlargement will occur together with wall thinning and adaptive remodelling. Some signs heralding these changes were detectable on IVUS: at three-year follow-up, when compared to post-procedure, there is a significant increase in both mean scaffold area and mean lumen area with unchanged values of minimal scaffold area and minimal lumen area. In addition, there is a decrease in plaque behind the scaffold area between two and three years, which is accompanied by adaptive constrictive remodelling of the vessel area between two and three years (Table 4, Figure 3).
This would suggest that the expansive remodelling process observed in the first two years has been halted and followed by a plaque (pseudo-) regression between the second and third years with constriction of the EEM, suggesting an adaptive remodelling not seen in vessels caged with metallic stents38.
CLINICAL OUTCOMES – PRELIMINARY COMPARISON WITH XIENCE V
The preliminary non-randomised comparison of clinical outcomes for the Absorb BVS scaffold and the XIENCE V metallic stent shows that these two devices have possibly similar event rates up to three years (Figure 9). For this comparison, 227 patients were selected from the SPIRIT I, II and III trials on the basis of a single implanted device with identical length and diameter (3.0×18 mm). This comparison should be viewed as a preamble to the ongoing randomised ABSORB II trial, enrolment to which has recently been completed39. More sophisticated adjusted comparisons using Cox regression analysis or propensity matching were precluded by the limited number of patients and events available, and this analysis should be viewed as hypothesis-generating.
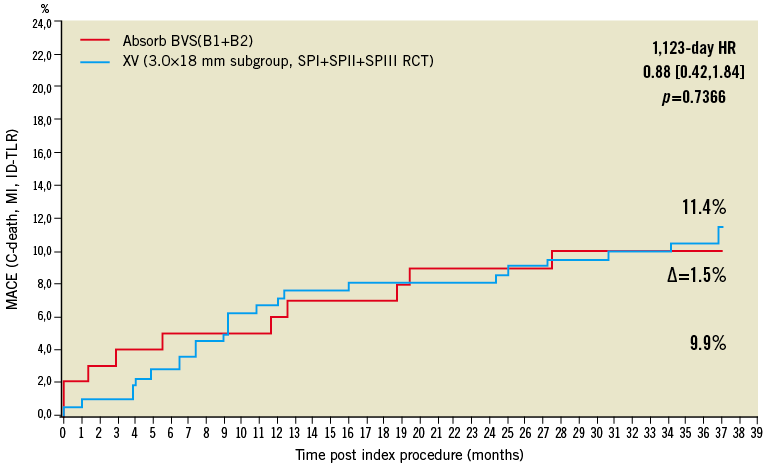
Figure 9. Kaplan-Meier estimates of cumulative major adverse cardiac events (cardiac mortality, any myocardial infarction or ischaemia-driven target lesion revascularisation) of the ABSORB cohort B (red, n=101) and the 226 patients who received a single 3.0×18 mm metallic everolimus-eluting stent in the SPIRIT I, II and III trials (blue).
Limitations
The current analysis is limited by the fact that invasive imaging follow-up was sometimes not performed at one and three years. Six patients did not undergo angiography at three years: these patients had no events. In the angiographic analysis, however, pre-TLR minimal lumen diameter (therefore the worst MLD) was measured in all event cases, and those values are used as the MLD at three years. The MLD data derived from the current analysis are therefore still representative of the overall temporal changes in lumen dimensions. Conversely, in the patients who underwent TLR, pre-TLR IVUS or OCT are missing in three and two patients, respectively. The IVUS and OCT analysis might therefore under-represent the changes in lumen dimensions.
Conclusion
The current investigation demonstrated the dynamics of vessel wall changes after implantation of an Absorb bioresorbable scaffold, resulting at three years in stable luminal dimensions, a low restenosis rate and a low clinical major adverse cardiac events rate.
Guest Editor
This paper was Guest Edited by William Wijns, MD, PhD, Onze-Lieve-Vrouwziekenhuis Aalst, OLV Hospital, Aalst, Belgium.
Conflict of interest statement
C. Dorange, S. Veldhof, K.M. Hebert and R. Rapoza are employees of Abbott Vascular. The other authors have no conflicts of interest to declare. The Guest Editor has received institutional research grants from several pharmaceutical and device companies, including Abbott Vascular and Biotronik and honoraria and fees on behalf of W. Wijns go to the Cardiovascular Research Center Aalst, Belgium.
Online data supplement
Online Figure 1. Flow chart of IVUS imaging follow-up.
Online Figure 2. Flow chart of OCT follow-up.
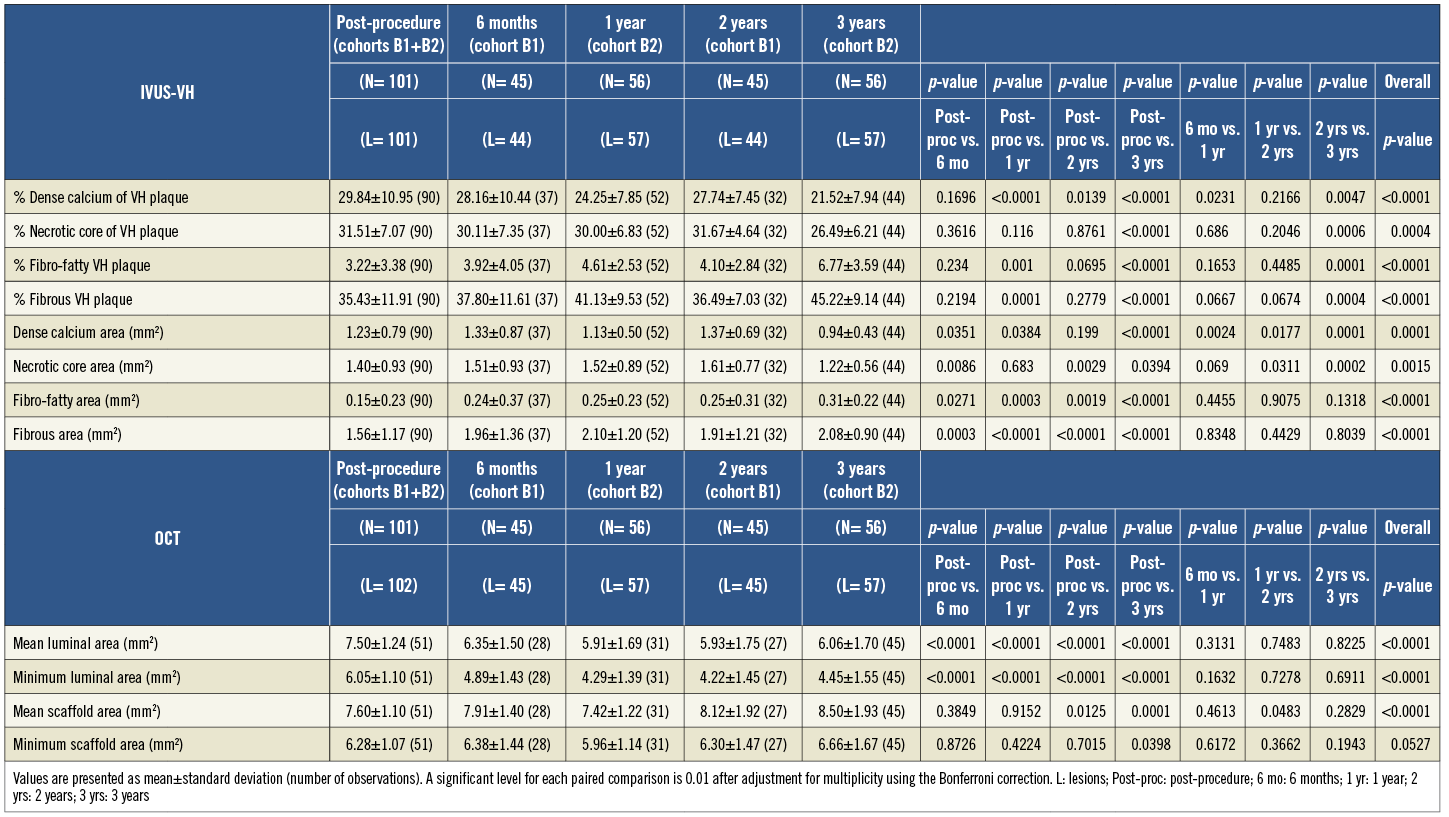
Online Table 1. The results of longitudinal repeated measurement analysis using a mixed effect model with five follow-up visits (at post-procedure, 6 months, 1 year, 2 years and 3 years).
Online Table 2. The results of quantitative angiographic analysis in a truly serial population.
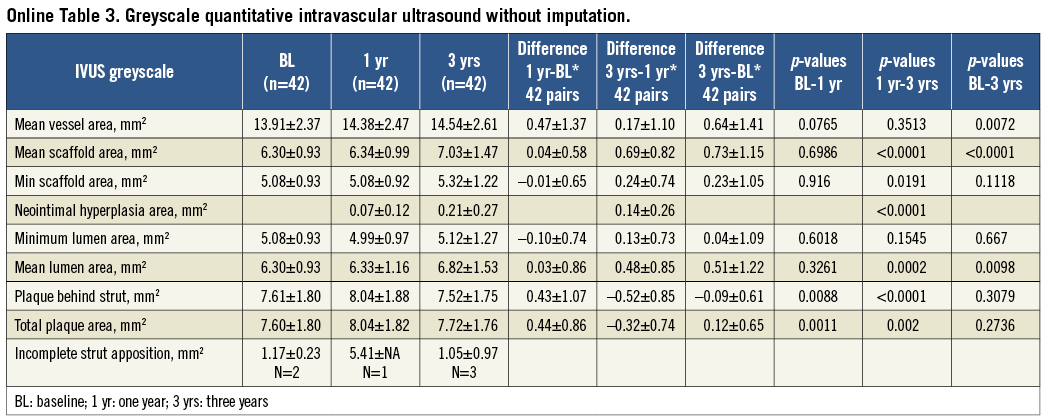
Online Table 3. Greyscale quantitative intravascular ultrasound without imputation.
Online Table 4. Intravascular ultrasound radiofrequency virtual histology backscattering (virtual histology) in a truly serial population.
Online Table 5. Optical coherence tomography results in a truly serial population.
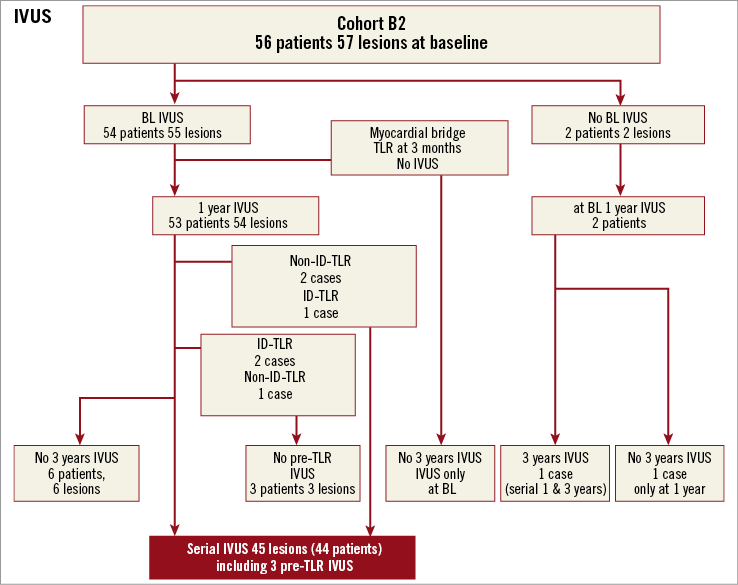
Online Figure 1. Flow chart of IVUS imaging follow-up.
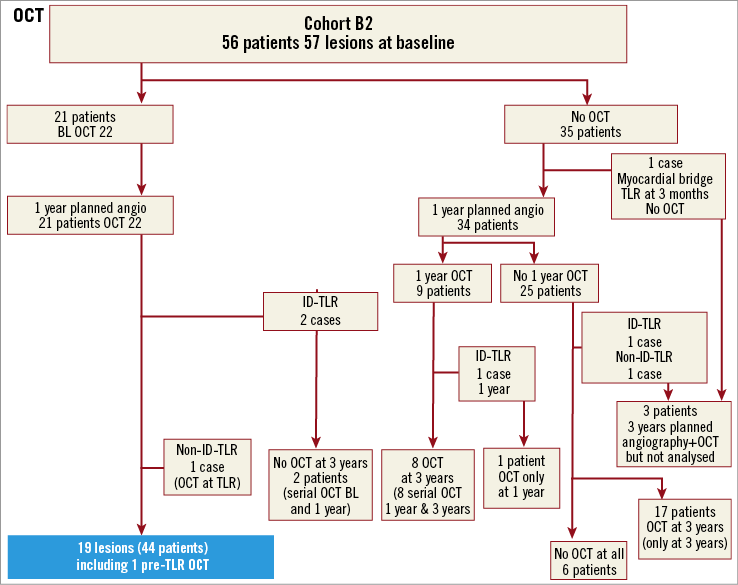
Online Figure 2. Flow chart of OCT follow-up.