Article Text

Abstract
Objective: To study how income and educational level influence mortality after acute myocardial infarction (AMI).
Design and setting: Prospective analysis using individual level linkage of registries in Denmark.
Participants: All patients 30–74 years old hospitalised for the first time with AMI in Denmark in 1995–2002.
Main outcome measures: Relative risk (RR) of 30 day mortality and long term mortality (31 days until 31 December 2003) associated with income (adjusted for education) or educational level (adjusted for income) and further adjusted for sex, age, civil status, and comorbidity.
Results: The study identified 21 391 patients 30–64 years old and 16 169 patients 65–74 years old. The 30 day mortality was 7.0% among patients 30–64 years old and 15.9% among those 65–74 years old. Among patients surviving the first 30 days, the long term mortality was 9.9% and 28.3%, respectively. The adjusted RR of 30 day mortality and long term mortality among younger patients with low compared with high income was 1.54 (95% confidence interval 1.36 to 1.79) and 1.65 (1.45 to 1.85), respectively. The RR of 30 day and long term mortality among younger patients with low compared with high education was 1.24 (1.03 to 1.50) and 1.33 (1.11 to 1.59), respectively. The RR of 30 day and long term mortality among older patients with low compared with high income was 1.27 (1.15 to 1.41) and 1.38 (1.27 to 1.50), respectively. Older high and low education patients did not differ in mortality.
Conclusion: This study shows that both educational level and income substantially and independently affect mortality after AMI, indicating that each indicator has specific effects on mortality and that these indicators are not interchangeable.
- AMI, acute myocardial infarction
- SES, socioeconomic status
- education
- income
- acute myocardial infarction
- mortality
Statistics from Altmetric.com
Inequalities in mortality between socioeconomic groups have widened during the last decades of the 20th century in Europe, and socioeconomic inequalities in health have been marked as one of the most important issues to be tackled by public health policy.1,2 In northern Europe the largest contributor to these inequalities are found to be cardiovascular diseases, and reducing socioeconomic inequalities in mortality critically depends on reducing mortality from cardiovascular diseases in lower socioeconomic groups.1,3,4
Numerous studies have shown that low socioeconomic status (SES) based on education, occupation, or income is consistently associated with cardiovascular risk factors and disease.4–7 However, fewer studies have examined socioeconomic differences in mortality after an acute myocardial infarction (AMI), and nearly all these studies have relied on single indicators of SES such as the patient’s residential area, education, occupation or income and thus provided little information on the interrelations between these indicators.8,9,10,11,12,13,14,15 Each indicator of SES is likely to reflect both common effects of a general hierarchical ranking in society and the effects specific to the indicator. Instead of being interchangeable, socioeconomic indicators are found to be partly independent determinants of health.16 The importance of educational and economic factors needs to be studied comprehensively to improve understanding of the mechanisms leading to social differences in mortality after AMI.
We therefore investigated social inequality in mortality after AMI on a large scale (nationwide data) using individual level information on both education and income and studied the interrelations between these two indicators. This study is the first of this type to our knowledge.
METHODS
Study population
The National Patient Registry contains administrative data for each hospitalisation in Denmark since 1978 and includes all diagnoses and procedures.17 We identified all patients 30–74 years old with AMI as the primary diagnosis (International Classification of Diseases(ICD) version 10, codes I21–I22) admitted between 1 January 1995 and 31 December 2002. To study first AMI, we solely included patients with no previous AMI diagnosis for 17 years before the index AMI (using ICD-8 code 410 for 1978–1994). Information on patients’ vital status (dead or alive) was obtained from the Civil Registration System.
Income
From the statistics on tax related income provided by Statistics Denmark,18 we obtained gross income, comprising all income subject to income taxation (wages and salaries, all types of benefits and pensions) for each patient and cohabiting partner. Income was corrected for inflation since 1990 using the components from Statistics Denmark’s price index. To account for yearly variation in income, we calculated the average income in the five years before admission for the patient and cohabiting partner. Patients with cohabiting partners were categorised according to their average income. Patients were divided into tertiles of increasing income, a method used in prior studies.13 Because income varied by age, income was categorised for five-year age intervals.
Education
Information on the highest completed educational level was retrieved from the Integrated Student Registry of Statistics Denmark, which assembles individual based educational information on all residents of Denmark from the administrative registries of the educational institutions.18 Patients were divided into three groups according to length of education; (1) >12 years (short, medium, and long term higher education), (2) 10–12 years (vocational education and upper secondary school), and (3) <10 years (primary and lower secondary school).
Comorbidity
Primary and secondary diagnoses, both at the index admission and from admissions until one year before the index admission, were used to define comorbidity.19 The diagnoses of congestive heart failure, cardiogenic shock, arrhythmia, and pulmonary oedema indicated the severity of heart disease; malignancy, diabetes mellitus, cerebrovascular disease, acute and chronic renal failure indicated comorbidity. This method is an extension of the Ontario AMI mortality prediction rule.20
Statistical analysis
Cox proportional hazards models, with time to death as the outcome variable, were used to estimate the relative risk of both 30 day mortality after admission (all patients) and long term mortality (from 31 days after admission until the observation period ended on 31 December 2003, including solely those surviving 30 days). Besides education and income adjustment was made for sex, age, period, each risk factor in the Ontario AMI mortality prediction rule, cohabitation status, and clustering at the hospital level. Because the proportional hazard assumptions were violated, we stratified the time to the event into the two periods. Because the effects of age and income on mortality interacted, analyses were stratified into two age groups: 30–64 and 65–74 years.
Ethics
The Danish Data Protection Agency approved the study. The project did not require approval by the regional committee on biomedical research ethics.
RESULTS
Baseline characteristics
A total of 37 560 patients 30–74 years old had their first hospitalisation with AMI as primary diagnosis in Denmark in 1995–2002. Information on income and education was available for 97% of the patients 30–64 years old (n = 21 391) and 96% of the patients 65–74 years old (n = 16 169). Table 1 presents the clinical and demographic characteristics stratified by age group, income, and educational level.
Baseline characteristics of patients hospitalised for the first time with AMI in the period 1995–2002, stratified by age, income, and education
Mortality
The 30 day mortality was 7.0% among patients 30–64 years old and 15.9% among those 65–74 years old. Among patients surviving the first 30 days, the long term mortality was 9.9% and 28.3%, respectively. Patients with low income or education had significantly higher 30 day and long term mortality rates in all strata (table 1).
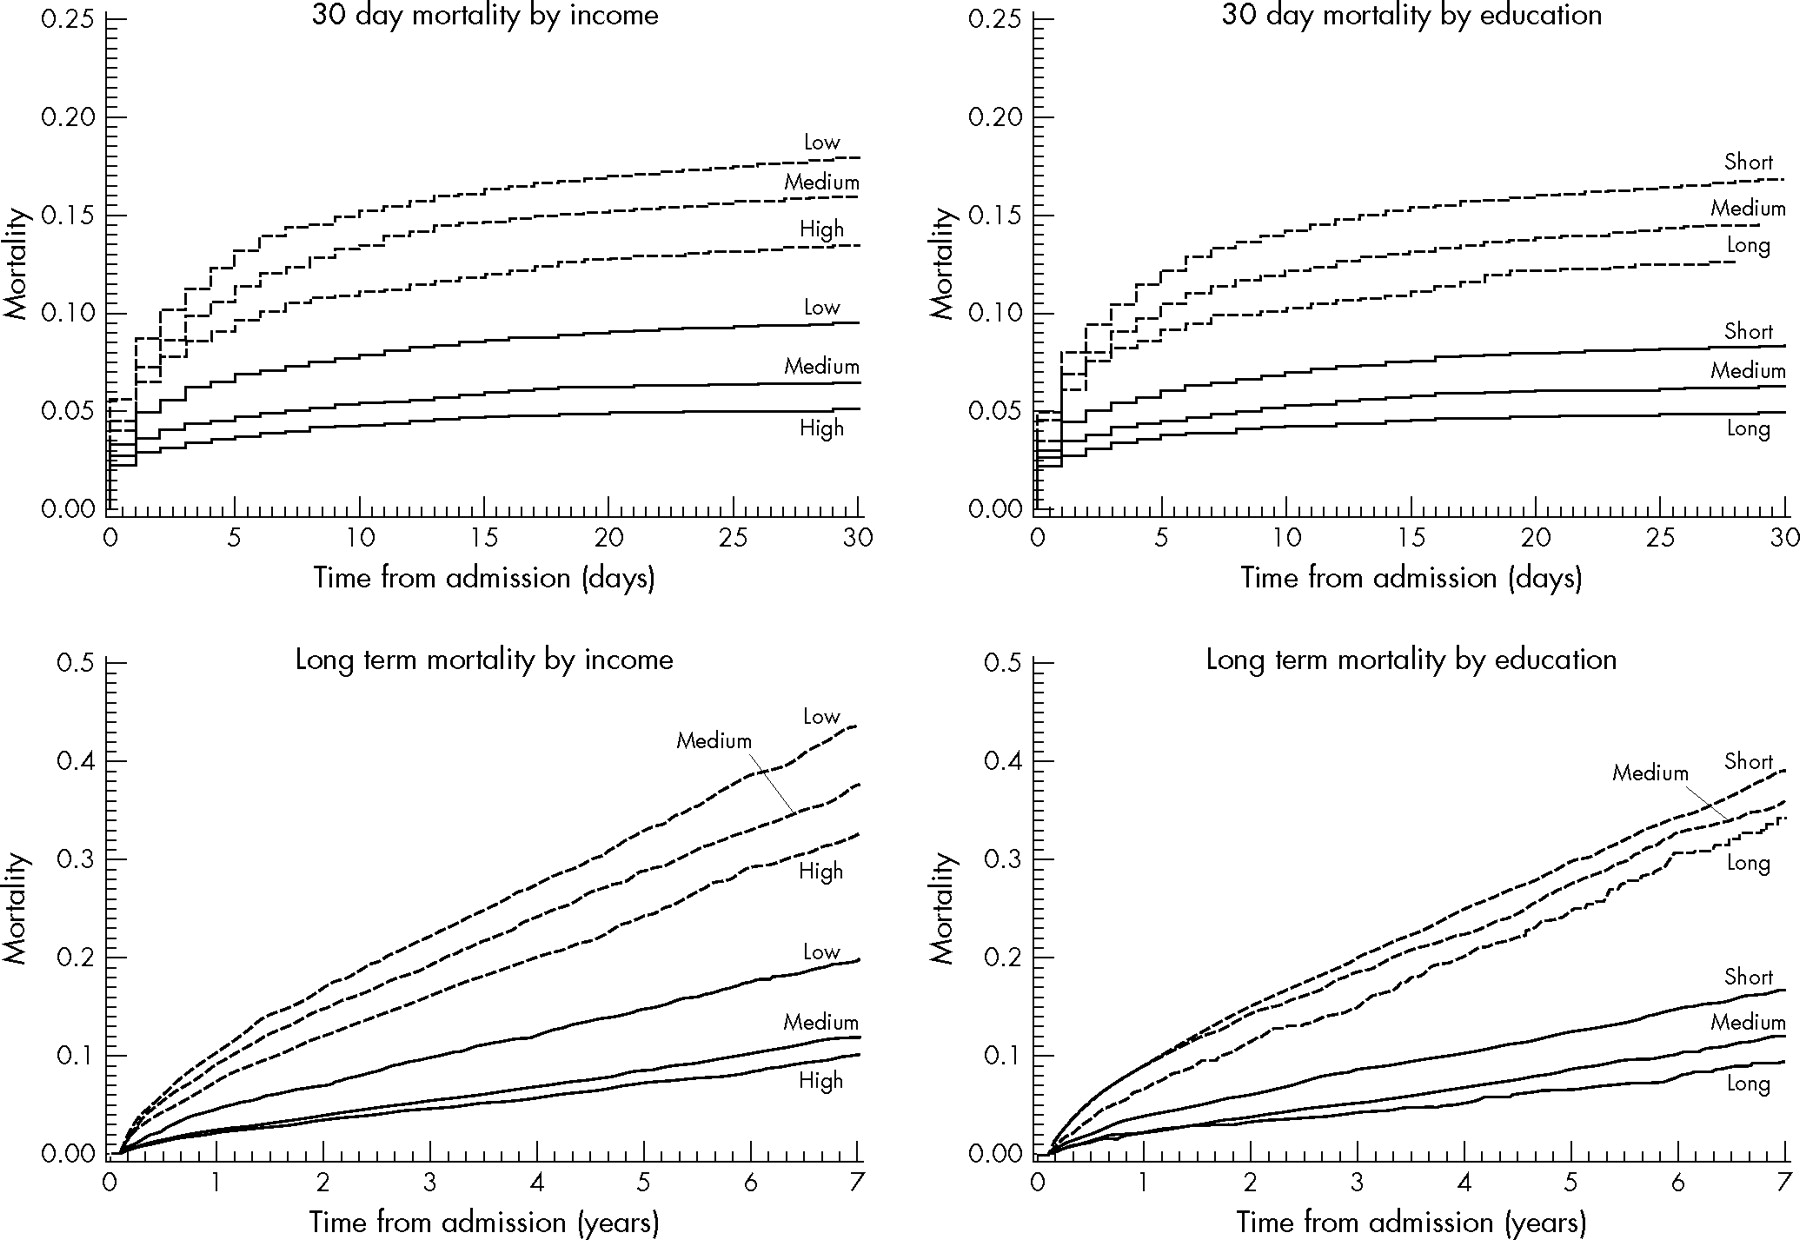
Unadjusted Kaplan-Meier cumulative mortality curves show significantly higher mortality among all low income and low education groups (fig 1). The ranked categories of income and education were weakly related for both young (weighted κ = 0.24) and elderly patients (weighted κ = 0.21) (table 2). Adjusting first for baseline characteristics and then for either income or education successively attenuated the effect of income and education (table 3). Both education and income more strongly affected mortality among younger patients than among elderly patients. Income had the largest effect in all strata. In the younger age group, education significantly affected mortality after adjusting for income; education thus confounds some of the income effect, and income mediates some of the education effect. Among elderly patients, income mediated all the effect.
Relation between income and educational level stratified by age groups 30–64 (A) and 65–74 (B) among patients hospitalised for the first time with AMI in 1995–2002
Relation between income level and educational level and 30 day mortality and long term mortality after first time AMI*
Unadjusted Kaplan-Meier curves showing cumulative 30 day mortality and long term mortality rates by income and educational level for patients aged 30–64 (solid line) and 65–74 (dashed line) years. Log rank test yielded p<0.001 for both young and elderly patients in all four strata. High, medium, and low income refer to tertiles of income adjusted for age. Short education is <10 years, medium 10–12 years, and long >12 years.
Income and education did not interact in affecting mortality in the final model (table 3) for both 30 day and long term mortality. In the young age group the p value for the interaction term for 30 day and long term mortality was 0.91 and 0.99 respectively, and in the elderly age group it was 0.10 and 0.42 respectively. Income and education therefore independently predict mortality after AMI among young patients. When both education and income were adjusted for, sex had no effect in any stratum except long term mortality among elderly patients, with women having lower mortality than men (RR = 0.80, 95% CI 0.74 to 0.86). Period did not interact with income or education, meaning that the social gradient seen did not change during the period.
DISCUSSION
This nationwide study found that income and educational level both profoundly influenced mortality after a first AMI. Income and educational level affected mortality independently for patients 30–64 years old, whereas all effect for patients 65–74 years old was mediated through income.
Strengths and weaknesses of the study
The strength of this study is that it uses income and education as two indicators of SES on all patients with a first AMI in Denmark in an eight year period, thereby including people outside the labour market and hence avoiding selection bias.21 Individual based measures of SES are also less sensitive to misclassification than proxy measures based on aggregated information on neighbourhood SES.22 Administrative registries further ensure comparatively uniform data collection, avoiding most potential bias. Adjusting for clustering at the hospital level reduced this bias further, but we might also adjust for some potential mediating factors such as treatment started at the hospital level. However, including the hospital effect did not affect the regression estimates.
What is already known on this subject
Numerous studies have found that low socioeconomic status is consistently associated with cardiovascular risk factors and cardiovascular disease. Few studies have examined the association between socioeconomic status and prognosis after acute myocardial infarction, and no study has addressed the combined effects of education and income on mortality after an acute myocardial infarction.
The main weakness is the lack of comprehensive clinical data because we used administrative data. We did not have information on smoking status, a risk factor that has strong association between lower SES and higher prevalence of smoking, and smoking has been found to be one of the main causes of the widening of the existing social difference in total cardiovascular risk.7,23 Smoking contributes to the occurrence of AMI at a younger age, but smoking at the time of the AMI has been shown not to affect short nor long term mortality after AMI, because of more favourable baseline characteristics such as fewer other known cardiac risk factors among smokers compared with non-smokers.24–26 Smoking cessation after AMI however, has been found to be associated with risk reduction in mortality.27 In general, people with lower SES has been found to be less likely to quit smoking than people with high SES, but the presence of cardiovascular disease seems to improve quit rate among people with lower SES.28,29 Overall, the smoking quitting rate in patients with cardiovascular disease is low, the European action on secondary prevention by intervention II survey found that only one third of patients had stopped smoking 1.4 years after admittance with cardiovascular disease.30 Based on these findings we find it unlikely that the effects of income and education (and whether they are independent) would be different after adjustment for smoking differences.
Important predictors of mortality in patients with AMI identified at presentation are age, congestive heart failure, diabetes mellitus, location of the infarction, prior infarction, and hypertension.31 Hospital admissions one year before the index admission provided data on comorbidity on all patients, a method that has previously been validated.20 Although the model does not include such factors as blood pressure at presentation, ejection fraction, and type of infarction, other variables in the model (such as shock and congestive heart failure) may be correlated with these factors and contribute to the model’s overall predictive performance. We realise that the National Patient Registry underreports some of the comorbidity conditions, especially congestive heart failure, but the discrimination of the model is acceptable (the c-index for one year mortality is 0.72).
The AMI diagnosis in the National Patient Registry has been validated against the Danish MONICA (monitoring trends and determinants of cardiovascular disease) Registry; among 4536 admissions with AMI as the primary diagnosis in the National Patient Registry, 93% were verified as definite or possible AMI.32 The income and education data from Statistics Denmark are generally of high quality, with good comparability over time.18
What this study adds
This study shows substantial and independent effects of both educational level and income on mortality after acute myocardial infarction.
Comparison with other studies
The relation between SES and mortality after AMI has been studied using various socioeconomic indicators such as education,13,33 occupation,11,34 income,12,13,15 car ownership,35 and social deprivation.8,9,10,14 But no other study has investigated the simultaneous impact of two indicators of SES on mortality after AMI. Lahelma et al16 recently investigated the importance of using more than one indicator of SES, finding that other SES indicators either confound or mediated parts of the effects of each of several SES indicators on limiting longstanding illness and self rated health. Alter et al36 found that both education and income affected the atherogenic risk factor profiles among AMI patients in Canada.
In this study, using more than one SES indicator was important among younger patients. Among the elderly patients, income mediates the difference in mortality, and the effect of education disappears when income is simultaneously adjusted for. This could partly be explained by the fact that most elderly patients are classified as having low education (62%), thereby attenuating any true inverse relation.
We found that social inequality in mortality after AMI was of the same magnitude for short and long term observation. Salomaa et al13 studied the association of income and education with 28 day and one year mortality after an AMI; for 28 day mortality, the rate ratio for high and low income was 3.18 for men and 2.17 for women. The associations were the same for both 28 day and one year mortality. They did not analyse these two SES indicators simultaneously, but found, as we did, that education was less associated with mortality than was income.
Interpretation of the study
Health care in Denmark is a tax financed public service in which all residents have access to all public health services at low or zero cost. Reimbursement for medicine increases proportionally with each person’s expenses for medicine and can reach a reimbursement rate of 85%. A fundamental principle in Denmark’s health care is equity in access to health care, meaning free and equal access irrespective of SES or geographical residence and ideally basing treatment decisions on need as defined by health care professionals.37 Despite efforts to promote equality in health care, this article shows noticeable social inequality in mortality after AMI. The difference in survival after AMI between patients with high and low income was pronounced although we divided patients into three rather large income groups instead of further groups, which would then have resulted in larger income differences between the extremes.
Several cohort studies have shown that more than half of the excess risk of cardiovascular events in lower socio-economic status groups could be explained by biological and behavioural risk factors such as serum cholesterol, blood pressure, body mass index, smoking, and physical activity.5,7 Fewer studies have investigated reasons for difference in mortality after an AMI, hereunder differences in treatment after an AMI according to SES. Alter et al15 found that increase in neighbourhood income from the lowest to the highest quintile in Canada was associated with a 23% increase in rates of coronary angiography use and a 45% decrease in waiting times. Rathore et al38 found that poor Medicare beneficiaries in the USA ⩾65 years old treated for AMI were less likely to receive aspirin or reperfusion on admission and aspirin or β blockers on discharge. In Europe, educational level has been found to be an important determinant of whether patients are treated with statins and β blockers among patients surviving more than six months after AMI.39 Whether Denmark has these types of social inequality remains to be established. Further studies are needed to provide insight into the mechanisms related to patients as well as physicians that generate this difference.
CONCLUSIONS
Both income and education have pronounced and independent effects on mortality after AMI, with significantly higher mortality among low education and low income AMI patients. Education confounds some of the income effect and income mediates some of the education effect, and income seems to be more strongly associated with mortality after AMI than is education. Future studies on socioeconomic inequality in mortality after AMI should not rely on one socioeconomic indicator. Further studies are needed to explain this large social gradient to learn more about where future interventions will provide the most benefit.
REFERENCES
Footnotes
-
Contributors
JNR was responsible for designing the study, analysing and interpreting data, drafting the manuscript, and acts as guarantor. SR was responsible for collecting data, analysing and interpreting data, and critically revising the manuscript. SZA was responsible for collecting data, interpreting data, and critically revising the manuscript. GG, Pernille Buch, Lars Køber, and Christian Torp-Pedersen were responsible for interpreting data and critically revising the manuscript. FD, MO, and MM were responsible for conceiving of and designing the study, interpreting data, critically revising the manuscript, and supervising.
-
Funding: the study was supported by the Danish Heart Foundation, grant no: 04-4-9-B19-A14-22132 and by Denmark’s Ministry of Interior and Health. The funding sources had no involvement in the manuscript.
-
Competing interests: none declared.
-
Ethical approval: the project did not require approval by the regional committee on biomedical research ethics
Linked Articles
- In this issue