Article Text

Abstract
Background: Coronary heart disease (CHD) risk estimation tools are a simple means of identifying those at high risk in a community and hence a potentially cost-effective strategy for CHD prevention in resource-poor countries. Since India has few local data upon which to develop such a tool de novo, in this study a Framingham risk equation has been recalibrated to estimate CHD risks in a population from rural India and the sensitivity of the method to information resources examined. Recent surveys of this population have found high levels of cardiovascular risk factors, particularly metabolic risk factors and a high proportion of mortality due to cardiovascular diseases.
Methods: The proportion of a rural Indian population at high risk of CHD using three risk estimation equations was estimated. The first a published version of the Framingham risk equation, the second a recalibrated equation using local mortality surveillance data and local risk factor data, and the third a recalibrated equation using national mortality data and local risk factor data.
Results: The mean 10-year probability of CHD for adults >30 years was 10.4% (9.6% to 11.1%) for men and 5.3% (4.9% to 5.7%) for women using the Framingham equation; 10.7% (9.9% to 11.5%) for men and 4.2% (3.9% to 4.5%) for women using the local recalibration; and 18.9% (17.7% to 20.1%) for men and 8.2% (7.6% to 8.8%) for women using the national recalibration.
Conclusion: These findings indicate that in India, equations recalibrated to summary national data are unlikely to be relevant to all regions of India and demonstrate the importance of local data collection to enable development of relevant CHD risk tools.
Statistics from Altmetric.com
Cardiovascular risk tools are widely used to guide clinical management and Framingham risk equations are the basis of many tools.1–3 The Framingham equations were developed from a US population with a high background risk of cardiovascular disease. The equations have been found to systematically overestimate risk in other populations from the USA and in populations from South East Asia and Europe.4–9 New equations based on information from local cohort studies can be used to address this problem, although such data are only rarely available.10 An alternative method is to recalibrate the Framingham equation using local data on risk factor distributions and the incidence of cardiovascular events. This second approach is attractive because the local data required are more readily available and the method has been shown to provide better risk prediction than simply applying the original Framingham equation.4 11 Recalibration assumes the nature and strengths of the associations between risk factors and cardiovascular disease are constant across populations and simply adjusts the equation for different risk factor distributions and different background incidence of cardiovascular disease.
We report here the results of recalibrating the Framingham risk equation for a rural population in Andhra Pradesh, India. Recalibration was done using two sets of data such that the sensitivity of the method to the information sources could be quantified and some inference about the likely generalisablity of the results to other parts of India could be made.
METHODS
We estimated the proportion of a rural Indian population (figure 1) that was at high risk of coronary heart disease (>20% risk of a coronary heart disease (CHD) event in 10 years) using three CHD risk prediction models based on the Framingham risk equation with recalibration using local data. All statistical analyses were carried out using STATA 8.0.

The study area in Andhra Pradesh, India.
Risk prediction models
Model 1
The first model used a published Framingham risk equation derived from the Framingham cohort study.12
Model 2
The second model used a recalibration of the published Framingham risk equation with local data from the rural Indian population. The method used to derive this equation was described by Wilson and colleagues.12 Specific data on risk factor levels and CHD rates measured in the rural Indian population (Andhra Pradesh Rural Health Initiative (APRHI) study; details are provided below) were substituted into the Framingham equation (appendix A).
Model 3
The third model used was also a recalibration of the Framingham risk equation. It used local risk factor level data from the specified rural Indian population as described above but CHD rates from published national India data (details provided below).
Data sources
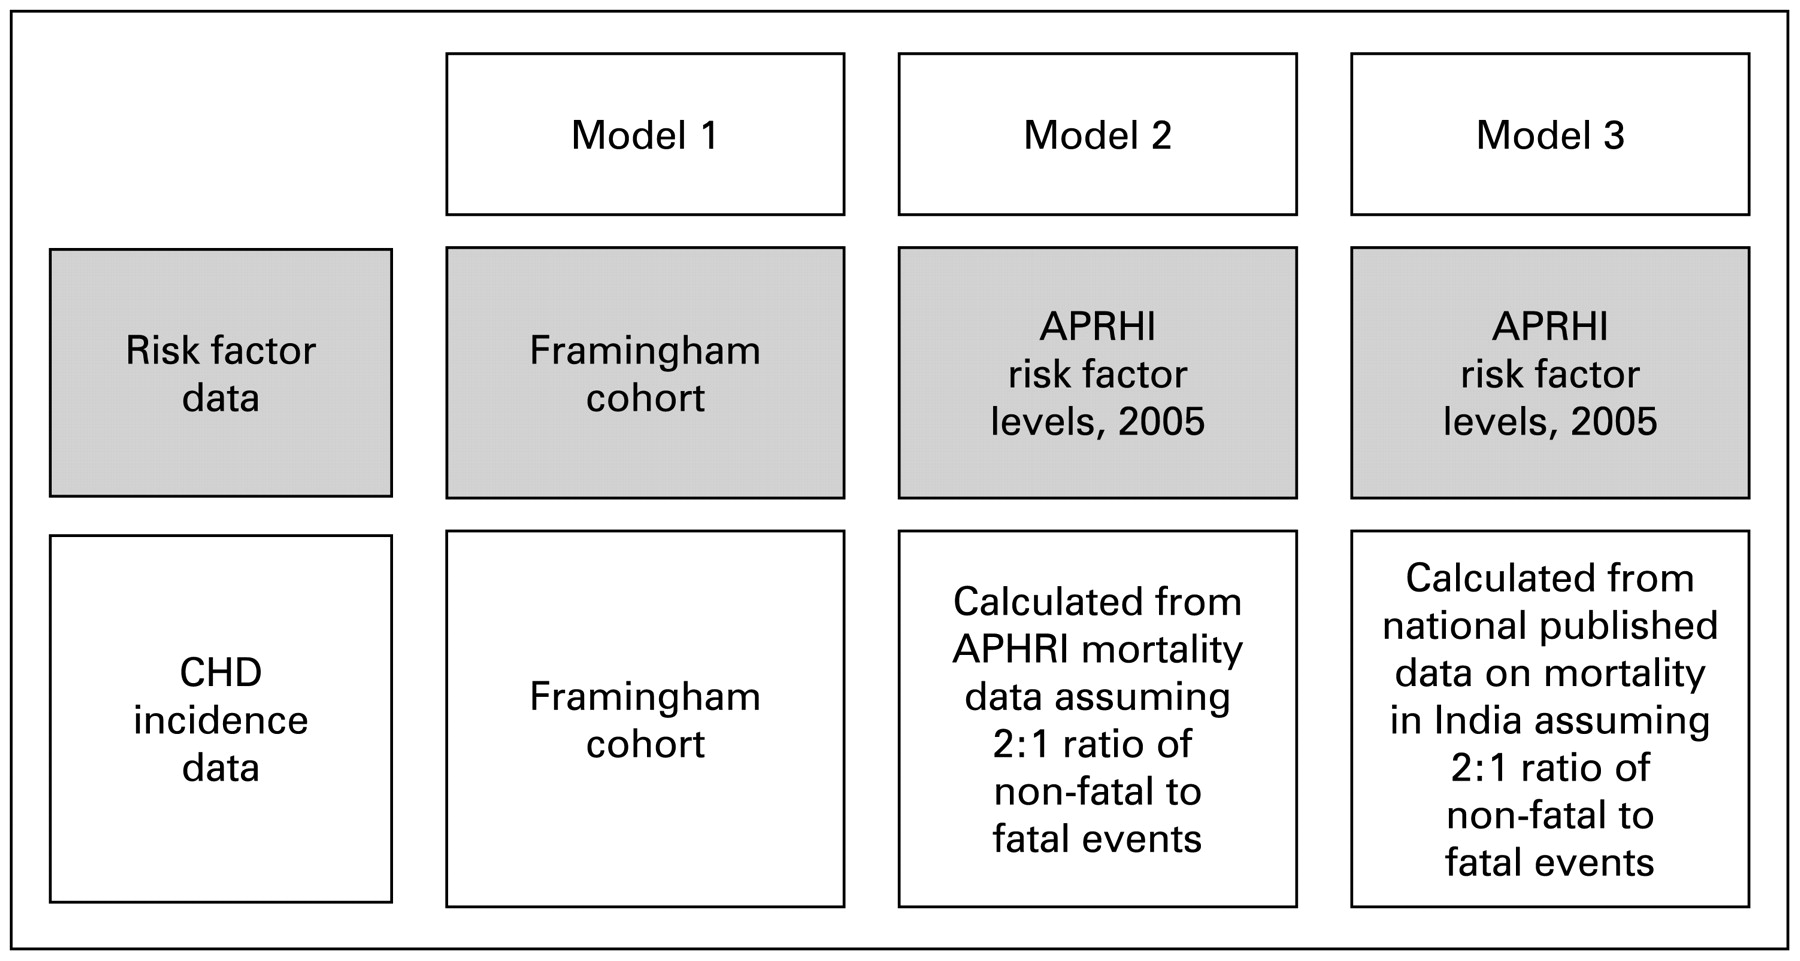
The data sources are shown in fig 2.

Data used in models used to calculate coronary heart disease (CHD) risk. APRHI, Andhra Pradesh Rural Health Initiative.
Framingham study
The data used to derive the Framingham equation were from participants in the eleventh cycle examination of the Framingham cohort study. This community cohort from a single area in the USA comprised 2489 men and 2856 women from the original Framingham cohort (recruited in 1948) and their offspring (recruited in 1971) who were 30–74 years old at the time of the eleventh cycle risk factor examination conducted between 1971 and 1974. The risk factor levels of this cohort are compared with the APRHI cohort in table 1. The 10-year CHD-free survival rates of this cohort based on 12 years of follow-up were 0.90 for men and 0.96 for women.12
Andhra Pradesh Rural Health Initiative
The local risk factor level data for the rural Indian population was obtained from the APRHI study conducted in 2005 (table 2).13–17 This rural Indian community cohort comprised a stratified random sample of 4535 adults (81% of those invited) 30 years and over drawn from 20 villages (total population of 20 villages = 79 918). The villages were selected to be broadly representative of the Godavari region (total population Godavari = 8 704 937).18 All 4535 individuals were administered a structured questionnaire, brief physical examination and a fasting finger-prick capillary blood sugar only. A random subsample of 1079 participants had lipid assays.
To obtain accurate estimates of the risk factor levels of the adult >30 years rural Indian population, survey weights were applied to the data from the 1079 participants with complete data (age, sex, total cholesterol, high-density lipoprotein (HDL) cholesterol, blood pressure, smoking status and blood sugar). Weights used in analyses were the population to sample size ratios for each combination of age, sex and village. These weights adjust results for the unequal probabilities of selection consequent upon the stratified sampling technique and took into account non-response.13 The APRHI population was on average younger, had lower total/HDL cholesterol ratios, smoked less (among women) and had lower blood pressure levels than the Framingham participants (table 1). The prevalence of diabetes was, however, higher.
The local estimates of the 10-year CHD-free survival rates (used in model 2) were 0.93 for men and 0.97 for women and were calculated from the APHRI study mortality data.15 16 The mortality data used were from the 2003–4 surveillance system covering 45 villages in the Godavari region (total population 180 162) and recorded 1354 deaths for which verbal autopsies were completed in 98%.15 The crude death rate was 7.5/1000 population and diseases of the circulatory system were the leading cause of mortality (32%). The data on mortality from APRHI have been validated by comparing a subset of 115 of the verbal autopsy diagnoses with that of a reference gold standard diagnosis made using hospital medical records. The sensitivity of the verbal autopsy diagnosis for vascular disease was 80%, the specificity 88% and the positive predictive value 86%.17 Separate estimates of mortality were available for men and women and combined fatal and non-fatal CHD incidence was estimated assuming a ratio of fatal to non-fatal CHD events of 1:219 and these used to estimate the 10-year CHD-free survival rates above.
World Health Organization/Centres for Disease Control world atlas
Published national data from the 2004 World Health Organization/Centres for Disease Control (WHO/CDC) Atlas of Heart Disease and Stroke20 for India was used to estimate the 10 year CHD-free survival rates used in model 3. The 10-year CHD-free survival rates estimated from these data were 0.93 for men and 0.97 for women. The combined fatal and non-fatal CHD incidence used to calculated the survival rates was estimated from the WHO/CDC mortality data assuming the same ratio of fatal to non-fatal CHD events of 1:2 as above.19 Since separate estimates were not available for each sex a 2:1 ratio of male to female CHD was also assumed.
Sensitivity analysis
Subsidiary analyses were done to test the robustness of the conclusions drawn by varying the assumptions used in the models. These included retaining the Framingham risk factor levels in models 2 and 3, varying the assumed ratio of fatal to non-fatal CHD events used to calculate CHD-free survival in models 2 and 3, and inclusion of sudden unexplained death to total fatal CHD events in the APRHI mortality data used to derive CHD-free survival for model 2.
RESULTS
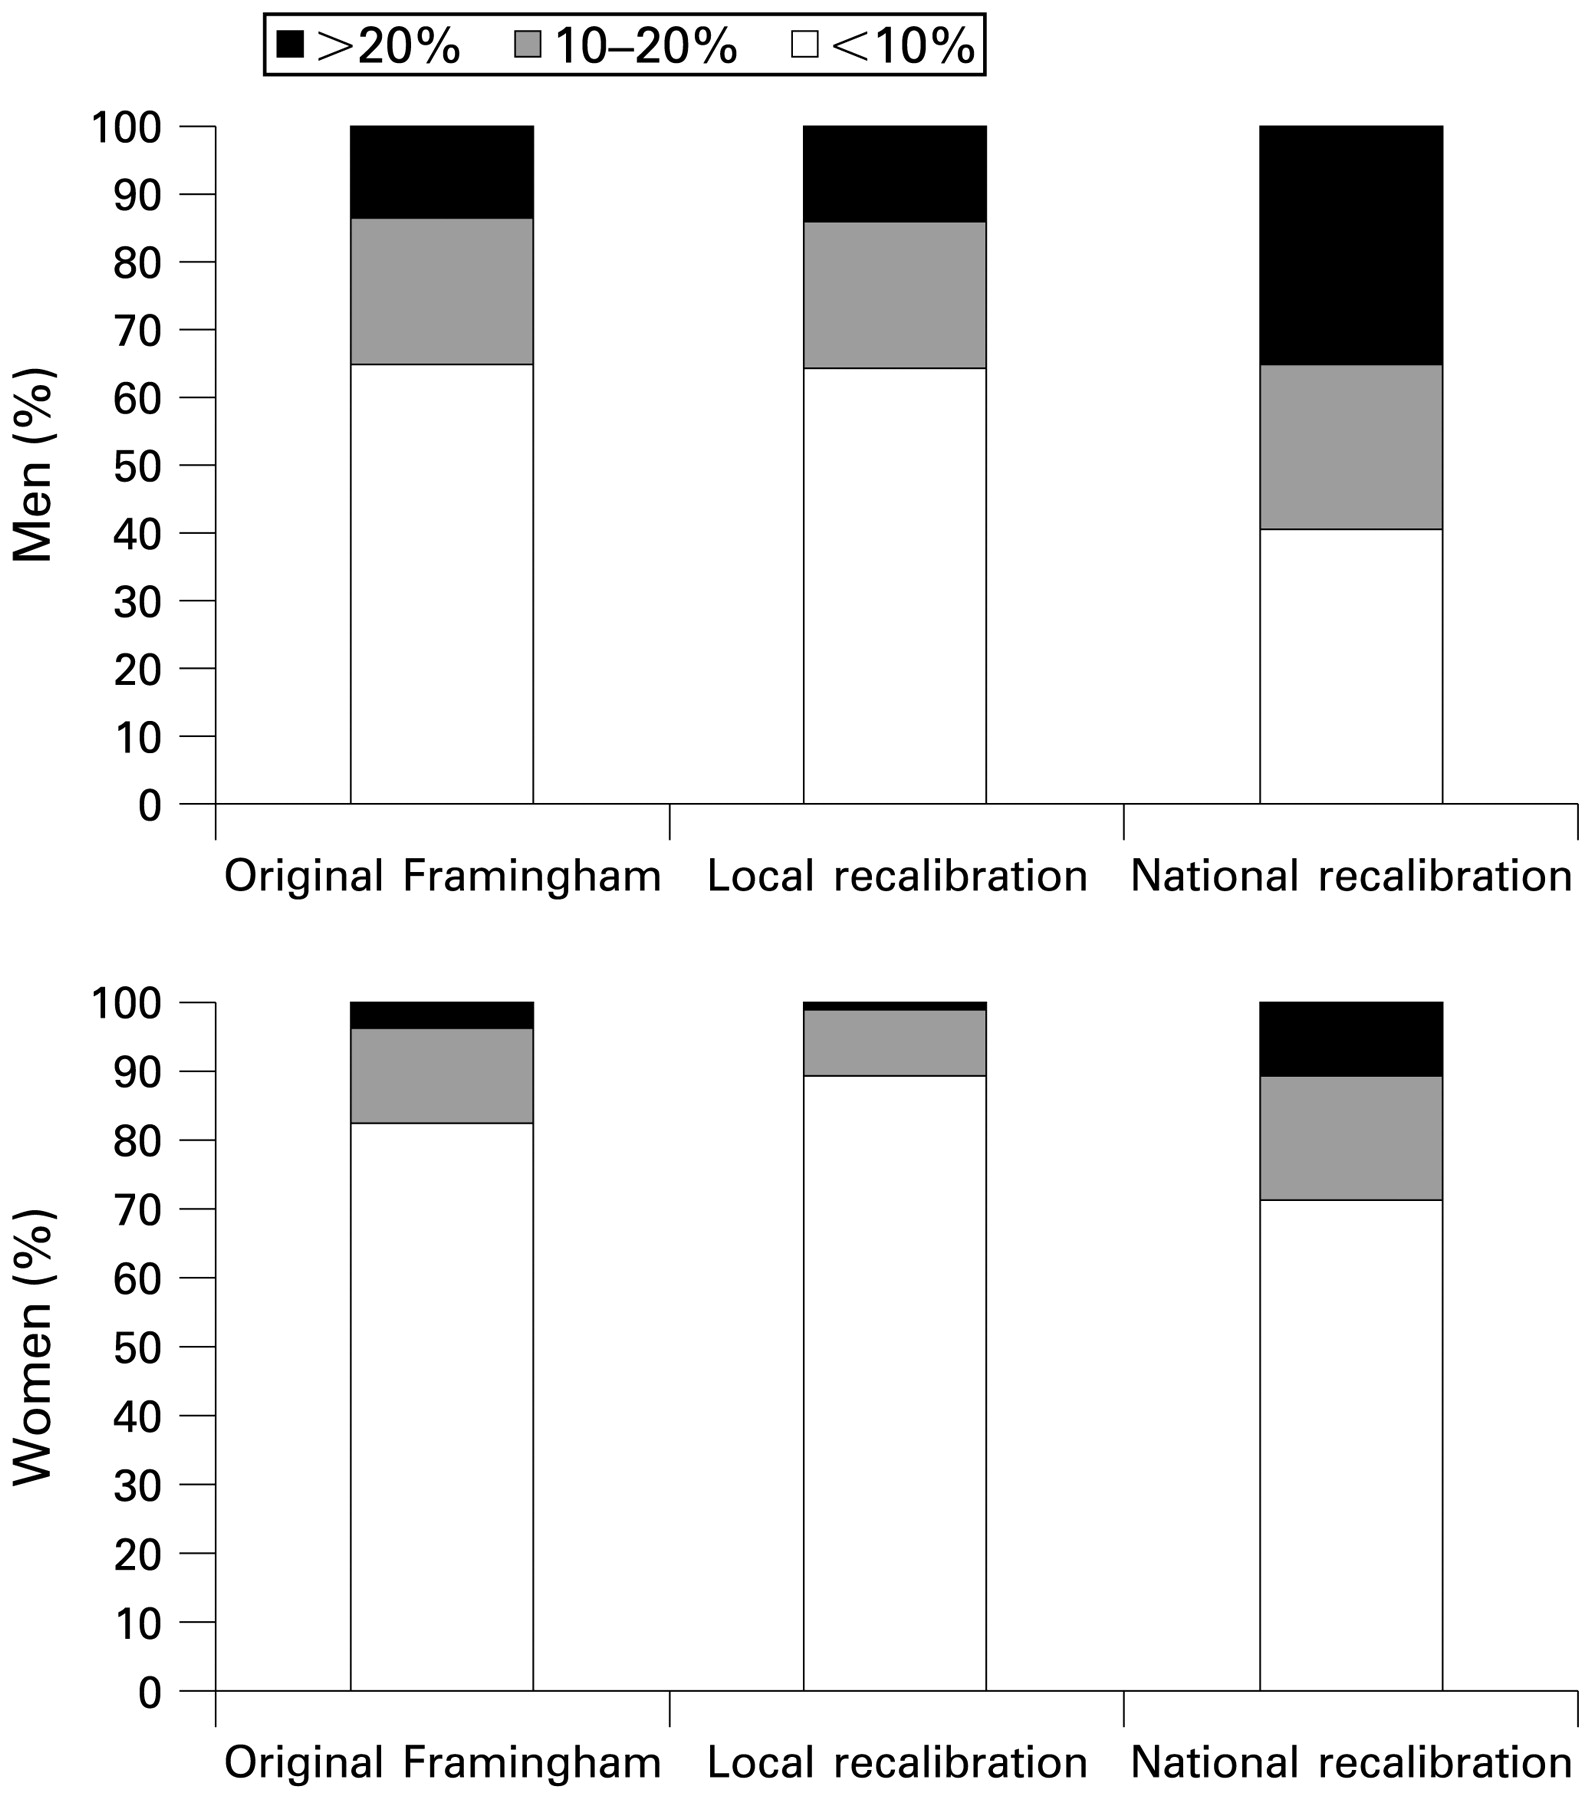
The baseline mean 10-year probability of CHD for adults aged 30 years or over in the rural Indian population residing in 20 villages of the Godavari region was 10.4% (9.6% to 11.1%) for men and 5.3% (4.9% to 5.7%) for women using model 1 (the original Framingham equation) (table 3). The corresponding estimates obtained with model 2 (local data recalibration) were directly comparable at 10.7% (9.9% to 11.5%) for men and 4.2% (3.9% to 4.5%) for women. The estimates obtained from model 3 (the national India data recalibration) were, however, much higher at 18.9% (17.7% to 20.1%) for men and 8.2% (7.6% to 8.8%) for women (table 3). The proportions of the population at estimated high (>20%), intermediate (10–20%) and low (<10%) 10-year CHD risk derived using the three models showed a similar pattern (table 4, figure 3). In sensitivity analyses, decreasing the assumed ratio of fatal to non-fatal events produced only small reductions in the estimated mean population risk. Substituting the 10-year disease-free survival estimates but leaving the risk factor levels in the original Framingham equation unchanged resulted in marked reductions in estimated mean risk for men but slight increases for women (figure 4).

Proportion of men and women in rural Andhra Pradesh at estimated high, intermediate and low coronary heart disease risk derived using the three equations.

Comparison of mean estimated 10-year risk of coronary heart disease (CHD) for men and women derived from original Framingham, local recalibration and national recalibration using a range of different estimates of CHD event-free survival.
DISCUSSION
In this study the mean 10-year CHD risks calculated using the original Framingham equation (model 1) and the local data calibration (model 2) of that equation were directly comparable while the national recalibration (model 3) produced risk estimates that were substantially higher. This finding is different from that observed in other parts of Asia where mean 10-year CHD risks calculated using the original Framingham equation typically overestimate risk levels compared with those obtained using locally recalibrated equations.4 21 These results are, however, consistent with the systematically higher rates of CHD observed in studies of South Asian Indian populations done elsewhere.22 23 It is also of note that the ETHRISK tool24, which recently estimated the 10-year risks of CHD for seven black and minority ethnic groups in Britain, provides estimates of 10-year CHD risk that are higher in South Asian men than in any other group. The consistently higher estimated and observed levels of risk in South Asians seen in other studies have prompted some national guidelines, such as the New Zealand guidelines, to recommend screening a decade earlier in South Asians than other asymptomatic members of the population.25
The almost twofold greater estimate of risk obtained with the “national recalibration” was a direct consequence of the higher national20 than local15 estimate of CHD incidence. This discrepancy serves to illustrate the sensitivity of the recalibration process to the 10-year CHD-free survival rates used and therefore the importance of having data that are both reliable and applicable to the local situation. In a country with socioeconomic circumstances as diverse as India, the 10-year CHD-free survival rates derived from the local mortality surveillance system are almost certainly more relevant to this population than the national estimates. Furthermore, the reliability of the national estimates derived for India may have been importantly limited by the completeness and representativeness of the data sources available.26–28
Recalibration of Framingham risk tools assumes that the nature and strength of the association between each risk factor and the risk of a cardiovascular event is constant across the Framingham population and the population to which the recalibration is being applied. Some data have suggested that South Asians may be more susceptible than other ethnic groups to particular risk factors29 30 and this might limit the validity of the recalibration process. Other studies suggest, however, that the risk differences between South Asian and other populations are largely attributable to differences in the levels of risk factors.31 Fortunately, the nature of the recalibration process means that the overall impact of any differences in disease–risk factor associations would not be substantial unless the differences in associations were extreme which appears unlikely.
There are some limitations to the risk equation developed here and clearly the ideal would have been to derive an equation using a local cohort with precise and reliable measures of risk factors and subsequent disease incidence. There are, however, only three cohort studies in India that might be used to develop risk equations and each of these has drawbacks in terms of developing a tool for the population studied here32–34—two of the studies were done entirely in urban settings, all were done in Northern India and none had comprehensive risk factor assessments. Development of an equation from these studies would have required significant additional assumptions and the generalisablity of their findings to this and other parts of India would be limited. A number of other considerations also argue for the use of recalibration methods in the development of risk prediction tools for countries such as India. First, the cost and time span required for the conduct of adequately powered cohort studies will make them implausible or at best a long-term solution. Second, risk factor levels and CHD rates are changing rapidly in many developing countries and risk equations developed from a particular cohort might become rapidly outdated. Third, the socioeconomic circumstances vary greatly between regions in a developing country such as India and multiple cohorts would be required for the development of risk prediction tools applicable to all regions of the country. By contrast, sufficiently reliable local estimates of risk factor levels and disease incidence could be obtained fairly rapidly at low cost for many parts of India and the development of a series of locally applicable risk prediction tools would be quite plausible.
Absolute risk-based programmes for prevention of cardiovascular disease are a more efficient strategy than traditional single risk factor initiatives such as hypertension or diabetes programmes.35–38 Simple risk prediction tools that enable the calculation of absolute risk may therefore be of great utility in settings with scarce resources. The further refinement of risk prediction models to deliver a “low-information” tool that removes the need for laboratory-based assay of lipid levels would further increase their utility.21 39
In summary, recalibration of the Framingham risk tool is a practical approach to estimation of cardiovascular risk in countries such as India but the reliability and applicability of the data used for recalibration is key. The more widespread use of such tools to identify those at high risk of CHD and facilitate appropriate preventative therapy should produce enormous health gains in developing countries where the burden of cardiovascular disease is large and increasing. Complimentary evidence about the mechanisms by which risk prediction tools can be incorporated into the primary care setting in developing countries will be a prerequisite for their widespread use.
What is already known on this subject
CHD is rapidly increasing in developing countries such as India.
Risk assessment tools are likely to be useful in these countries to identify those at risk for preventative therapies.
Recalibration of the Framingham risk equation, versus development of new tools de novo, enables the development of population-specific risk assessment tools.
What this study adds
This study uses local data to recalibrate a Framingham risk equation for a rural Indian population.
It finds that mean levels of CHD risk were high in this developing rural Indian population. It also shows the sensitivity of recalibration methods to CHD incidence rates and hence the importance of reliable local data to make risk tool recalibration a feasible option for developing populations.
Acknowledgments
The data used for the recalibration were collected by APRHI (Andhra Pradesh Rural Health Initiative). APRHI is a collaboration between four partners, the Byrraju Foundation (BF) in Hyderabad, India, the Center for Chronic Disease Control (CCDC) in Delhi, India, the Care Foundation (CF) in Hyderabad, India and the George Institute for International Health in Sydney, Australia. APRHI funding for the India-based component of this project was provided by the Byrraju Foundation and the Initiative for Cardiovascular Health Research in Developing Countries. Programme Grants from the NHMRC–—National Health and Medical Research Council of Australia (S M no. 358395), and a contribution from the George Foundation made possible the Australian component of the work. The authors wish to acknowledge Dr Rama Raju (BF), Dr Krishnam Raju (CF), Dr Srinath Reddy (CCDC), Dr Ravi Raju (BF), Mr A. Sukumar (BF). We also would like to thank the communities of the participating villages in East and West Godavari districts for their tremendous support of the project.
Appendix A
The equations used to calculate the Framingham functions are the published equations from Wilson et al.3 The β-coefficients and baseline survival used in these functions are in table A. The risk factor levels used in the recalibration are in table B, the derivation of the baseline survival estimates are described in the main text.
Step 1
In the recalibrated equation the original β-coefficients from the Wilson equation were used (table AI) and risk factor levels from the Andhra Pradesh survey were substituted into the original Framingham equation in a function termed ‘G’ for general population. This function has been calibrated to the designated general population, in this case the population of rural Andhra Pradesh. Risk factor levels have to be in categorical format and expressed using the same cut-offs as used by Wilson as tabulated in table AII. These are substituted into the equation ‘G’ where ‘P’ equals the proportion with each category (or mean value, for age) in the general population. G is calculated for both men and women.
Gmen = (0.04826×mean age)−(0.65945×P(TC<160))+(0.0×P(TC 160–199))+(0.17692×P(TC200–239))+(0.50539×P(TC 240–279))+(0.65713×P(TC⩾280)+(0.49744×P(HDL<35))+(0.24310×P(HDL 35–44))+(0.0×P(HDL 45–49))−(0.05107×P(HDL 50–59))−(0.48660×P(HDL ⩾60))−(0.00226×P(BP optimal))+(0.0×P(BP normal))+(0.28320×P(BP high normal))+(0.52168×P(BP stage I hypertension))+(0.61859×P(BP stage II hypertension))+(0.42839×P(diabetes present))+(0.0×P(diabetes not present))+(0.52337 P(smoker))+(0.0×P(not smoker))
Gwomen is calculated in the same way using the equation for women with the appropriate β-coefficients.
Using the Andhra Pradesh survey data, GAP men = 2.693 and GAP women = 10.005
In comparison, the published Framingham data reports a GFramingham men = 3.0975 and GFramingham women = 9.9255 are published.3
Step 2
For each individual, a function we will term ‘I’ is computed. ‘I’ is calculated for each individual whose risk is to be calculated. In this function, the number ‘1’ is inserted if the risk factor criteria is met by the individual and otherwise replaced with zero. The calculation of ‘I’ for a male and ‘I’ for a female is shown here. In the calculation for ‘I’, ‘TC’ refers to total cholesterol, ‘HDL’ to HDL cholesterol and ‘BP’ to blood pressure.
Imale = (0.04826× age)−0.65945 [if TC<160]+0.0 [if TC 160–199]+0.17692 [if TC200–239]+0.50539 [if TC240–279]+0.65713 [if TC ⩾280]+0.49744 [if HDL<35] +0.24310 [if HDL 35–44]+0.0 [if HDL 45–49]−0.05107 [if HDL 50–59]−0.48660 [if HDL ⩾60]−0.00226 [if BP optimal]+0.0 [if BP normal]+0.28320 [if BP high normal]+0.52168 [if BP stage I hypertension]+0.61859 [if BP stage II hypertension]+0.42839 [if diabetes present]+[if diabetes not present]+0.52337 [if smoker]
Ifemale = (0.33766×age)−(0.00268×age2)−0.26138[if TC<160]+0[if TC 160–199]+0.20771[if TC200–239]+0.24385[if TC240–279]+0.53513[if TC⩾280]+0.84312[if HDL<35]+0.37796[if HDL 35–44]+0.19785 [if HDL 45–49])+0[if HDL 50–59]−0.42951[if HDL ⩾60]−0.53363[if BP optimal]+0[if BP normal]−(0.06773[if BP high normal]+0.26288[if BP stage I hypertension]+0.46573[if BP stage II hypertension]+0.59626[if diabetes present]+0.29246[if smoker]
Step 3
For each individual, the results obtained from the two steps above were then combined.
That is, for each individual, the function ‘A’ was calculated, where A = I−G.
Then for each individual, the function ‘B’ is calculated, where B = eA
Step 4
Finally, for each individual, ‘P10’ the 10-year probability of fatal or non-fatal CHD) was calculated where P10 = 1−[S(t)B].
In this final calculation ‘S(t)’ is the CHD-free survival rate. For the Framingham ‘calibrated’ probability, the Framingham baseline CHD-free survival rate at 10 years are published for men (0.90015) and for women (0.96246).3 For the recalibrated probability, the corresponding values for India have been derived from external sources as detailed above: ‘S(t) Andhra Pradesh’ equal 0.930002 (men), 0.967893 (women) and ‘S(t) India’ equals 0.865185 (men), 0.934854 (women).
REFERENCES
Footnotes
Funding: CC is supported by an Australian NHMRC/NHFA Public Health postdoctoral fellowship, RJ by an IPRS scholarship and BN and AP by Fellowships from the National Heart Foundation of Australia while doing this work.
Competing interests: None.
Ethics approval: Ethics approval was obtained for all data collection in APHRI from both local Indian and Australian ethics committees.