Article Text

Abstract
Study Objective: Many studies have shown that ambient particulate air pollution (PM) is associated with increased risk of hospital admissions and deaths for cardiovascular or respiratory causes around the world. In general these have been analysed in association with PM10 and ozone, whereas PM2.5 is now the particle measure of greatest health and regulatory concern. And little has been published on associations of hospital admissions and PM components.
Design: This study analysed hospital admissions for myocardial infarction (15 578 patients), and pneumonia (24 857 patients) in associations with fine particulate air pollution, black carbon (BC), ozone, nitrogen dioxide (NO2), PM not from traffic, and carbon monoxide (CO) in the greater Boston area for the years 1995–1999 using a case-crossover analysis, with control days matched on temperature.
Main results: A significant association was found between NO2 (12.7% change (95% CI: 5.8, 18)), PM2.5 (8.6% increase (95% CI: 1.2, 15.4)), and BC (8.3% increase (95% CI: 0.2, 15.8)) and the risk of emergency myocardial infarction hospitalisation; and between BC (11.7% increase (95% CI: 4.8, 17.4)), PM2.5 (6.5% increase (95% CI: 1.1, 11.4)), and CO (5.5% increase (95% CI: 1.1, 9.5)) and the risk of pneumonia hospitalisation.
Conclusions: The pattern of associations seen for myocardial infarction and pneumonia (strongest associations with NO2, CO, and BC) suggests that traffic exposure is primarily responsible for the association with heart attacks.
- NO2, nitrogen dioxide
- BC, black carbon, PM, particulate matter
- CO, carbon monoxide
- MI, myocardial infarction
- air pollution
- myocardial infarction
- case-crossover
- fine particulate air pollution
- pneumonia
Statistics from Altmetric.com
- NO2, nitrogen dioxide
- BC, black carbon, PM, particulate matter
- CO, carbon monoxide
- MI, myocardial infarction
Many studies have shown that ambient particulate air pollution (PM), generally measured as particles with aerodynamic diameter less then 10 μm (PM10), is associated with increased risk of hospital admissions and deaths for broadly defined cardiovascular or respiratory causes.1–6
Similar relations have been reported in locations reflecting a wide range of particulate matter (PM), and of gaseous copollutant concentrations 7,8,9,10,11,12; multicity and recent studies have shown that the mortality associations13,14 and the hospital admissions studies15,16 are independent of gaseous pollutants.
Less work has investigated more specific outcomes, which may be relevant to understanding mechanisms. And comparatively little has been published on characteristics of PM pollution, or on associations with fine particles (PM2.5), because the Environmental Protection Agency (EPA) did not begin PM2.5 monitoring until 1999, and speciation monitors (which examine particle components) did not begin until 2000.
Several studies have recently examined whether PM is a specific trigger of myocardial infarction (MI) both in Europe3,17 and in America.18–21 In general these are associations with PM10, whereas PM2.5 is now the particle measure of greatest health and regulatory concern.
Recent interest has also focused on whether traffic particles are a particularly toxic component,22,23 although again, there are few studies of hospital admissions24 directly addressing this question.
An exception was a study by Peters and colleagues20 who conducted a case-crossover study of 772 patients presenting to Boston area hospitals with strictly defined MI, and reported that increased concentrations of ambient particulates (PM2.5 and PM10) were strongly associated with higher risks of MI.
Hospital admissions for specific types of respiratory disease such as pneumonia have been analysed in several US cities4,16 and around the world1,24,25 and have been found to be associated with particulate pollution; again without examining PM2.5.
Boston, MA, is a medium size city near the ocean in the north eastern USA; the greater Boston area comprises three counties: Middlesex, Norfolk, and Suffolk, with an area of 2063 km2 and a population of 2.8 million inhabitants. Between 1995 and 1999 we operated a PM2.5 monitor at the Harvard School of Public Health. We also measured black carbon (BC), a good surrogate for traffic particles, at the same site.
We analysed hospital admissions for MI, and pneumonia in associations with PM2.5, BC, ozone, nitrogen dioxide (NO2), PM not from traffic, and carbon monoxide (CO) in the greater Boston area for the years 1995–1999 using a case-crossover analysis.
METHODS
Health data
The US Medicare programme covers hospital admissions for all citizens and permanent residents aged 65 and over. We extracted data on all hospital admissions for residents of the Boston Metropolitan area who were admitted to the hospital (in the Boston area) with a primary diagnosis of MI (ICD-9: 410), and pneumonia (ICD-9: 480–487), from Medicare billing records for the years 1995–1999. Only admissions through the emergency room were considered, as we wanted to eliminate elective admissions and focus on acute events. The accuracy of the Medicare claims based diagnosis of MI has been recently validated.26 No similar centralised data repository was available for admissions of patients in other age ranges.
Environmental data
We obtained data for ozone and NO2 from the US EPA’s aerometric information retrieval system.27 The values for these pollutants were computed as the average of four and five monitors respectively.
BC, CO, and PM with aerodynamic diameter less than 2.5 μg (PM2.5) were measured at a site established by the Harvard School of Public Health (HSPH). Continuous PM2.5 mass concentrations were measured using a tapered element oscillating microbalance (TEOM) (TEOMs model 1400A, Rupprecht and Patashnick). TEOM measurements were corrected using a collocated gravimetric sampler to compensate for semi-volatile mass loss during sampling.28 BC concentrations were measured using an aethalometer (Magee Scientific).
BC is emitted primarily from traffic related sources, weighted toward diesel,29 but can reflect both local and aged, transported traffic particles.
In Boston BC is associated only with traffic with daily patterns peaking at 6 am, and a lower peak in the afternoon rush hour. There are no other major local or regional sources that might contribute to the BC fraction. However, there appear to be some transported BC from the New York metropolitan area, as BC concentrations were modestly higher when the back trajectory originated in New York.
The hourly measurements for BC and PM2.5 were not complete. We replaced occasional missing values with the predicted values from a regression where each pollutant was regressed against season and long term trend, day of the week, and weather variables such as mean temperature, relative humidity, barometric pressure, and the extinction coefficient. We also controlled for previous day and following day measurements of the pollutant. PM2.5 was completely missing during 1998, while BC was missing from March 1997 to March 1999; for those years it was not plausible to replace missing values.
We also estimated the levels of particulates not from traffic, as the residuals of a model where PM2.5 was regressed against BC. These residuals would represent the levels of transported particles not from traffic (PM non traffic).
Units for PM2.5, PM non-traffic, and BC are reported in μg/m3, while NO2, and ozone are in parts per billion (ppb) and CO is in parts per million (ppm).
We obtained meteorological data from the United States Surface Airways and Airways Solar Radiation hourly data.30
Methods
We investigated the association between daily concentrations of air pollutants and hospital admissions using a case-crossover design with the time stratified approach proposed by Lumley.31
This design samples only cases, in our analysis hospitalisations for MI and pneumonia, and compares each subject’s exposure experience proximate to admission with that subject’s exposure at other times when they were not hospitalised. In other words the case-crossover design matches each subject to control days drawn from the same month of the same year, when they did not have an event. Because each person is their own control, all time invariant or slowly varying risk factors are controlled by design. Simulation analysis has shown this approach to give unbiased estimates in the presence of strong seasonal confounding, and unbiased coverage probabilities32 Following recent papers by Schwartz33,34 we controlled for temperature on the day of admission by matching. This has the advantage of controlling for temperature no matter how non-linear the relation, and of allowing the temperature effect to vary by month and year, as matching on two factors controls for their interaction.
We defined the hazard period as the day of their hospitalisation; we chose control days as days in the same month and year as the event day, matched on apparent temperature (same rounded °C). Apparent temperature (AT) is defined as an person’s perceived air temperature given the humidity, as was calculated from the formula.35,36
AT = −2.653+(0.994×Ta)+(0.0153×Td2)
where Ta is air temperature and Td is dew point temperature.
To control for lagged (and possibly non-linear) effects of temperature, we used a regression spline (with three degrees of freedom) for apparent temperature on the previous day. We controlled for day of the week using indicator variables. We examined the effect of pollution for the same day (lag 0) and the mean of exposure the day of and day before the admission, and these were modelled linearly. We have used the mean of lags 0 and 1 as our exposure because distributed lag studies have found contributions for heart disease on both of these days,16,19 and for comparability, as this averaging time is the most common in the literature.21,24,37 A detailed multicity study examined lags out to five days in relating PM to MI deaths, and found no association beyond lag 1.19
Ozone is negatively correlated with primary pollutants in the winter, and ozone levels are usually higher in summer. Therefore protective associations are sometimes seen with ozone. Lately three meta-analyses38–40 of studies of associations between ozone and mortality have reported associations in the summer as has a recent large multicity study.34 Hence, we also repeated our analyses by warm (April–September) and cold season, by including an interaction term in the model.
The data were analysed using a conditional logistic regression (proc phreg in SAS (SAS Software Release 8.2. Cary NC: SAS Institute; 2001).
RESULTS
Table 1 shows the counts of the hospitalisations by cause of admission and by age and sex. We had 15 578 patients admitted for MI and 24 857 admitted for pneumonia. When matching by temperature we lost 0.07% of events for pneumonia and 0.05% for MI.
Counts of hospital admissions for myocardial infarction and pneumonia, in total and by age and sex
Table 2 shows the distribution of apparent temperature, and of the pollutants for both MI and pneumonia hospitalisations. The pollution levels are low. The distribution of PM non-traffic does reflect the fact that these are residuals with mean 0.
Distribution of the environmental variables: 5, 25, 50, 75, and 95 centiles and difference between the 90th and 10th centile in the myocardial infarction and the pneumonia cohorts
BC explained 45% of the variability in PM2.5, with the remaining variability coming from non-traffic particles.
The last column is the difference between the 90 and 10 centile for each pollutant. These values are used to compute the percentage increase in risk of hospitalisation for each pollutant presented in table 4. This shows the estimated effect across a robust estimate of the range of each pollutant, and facilitates comparisons across pollutants.
Table 3 shows the correlation among pollutants in the two cohorts. The correlations are similar in the two cohorts. We have high correlations between BC and PM2.5, NO2 and CO; and between CO and BC, that is among pollutants reflecting traffic exposure. Consistent with our interpretation of it as representing particles from non-traffic sources, our “PM non-traffic” is highly correlated only with PM2.5 but not with the other traffic pollutants (NO2, CO), and is moderately correlated with ozone (0.47). Ozone is negatively correlated with BC, NO2, and CO.
Correlation among the pollutants PM2.5, BC, NO2, CO, ozone, and PM non-traffic in the myocardial infarction cohort (non-shaded) and the pneumonia cohort (shaded)
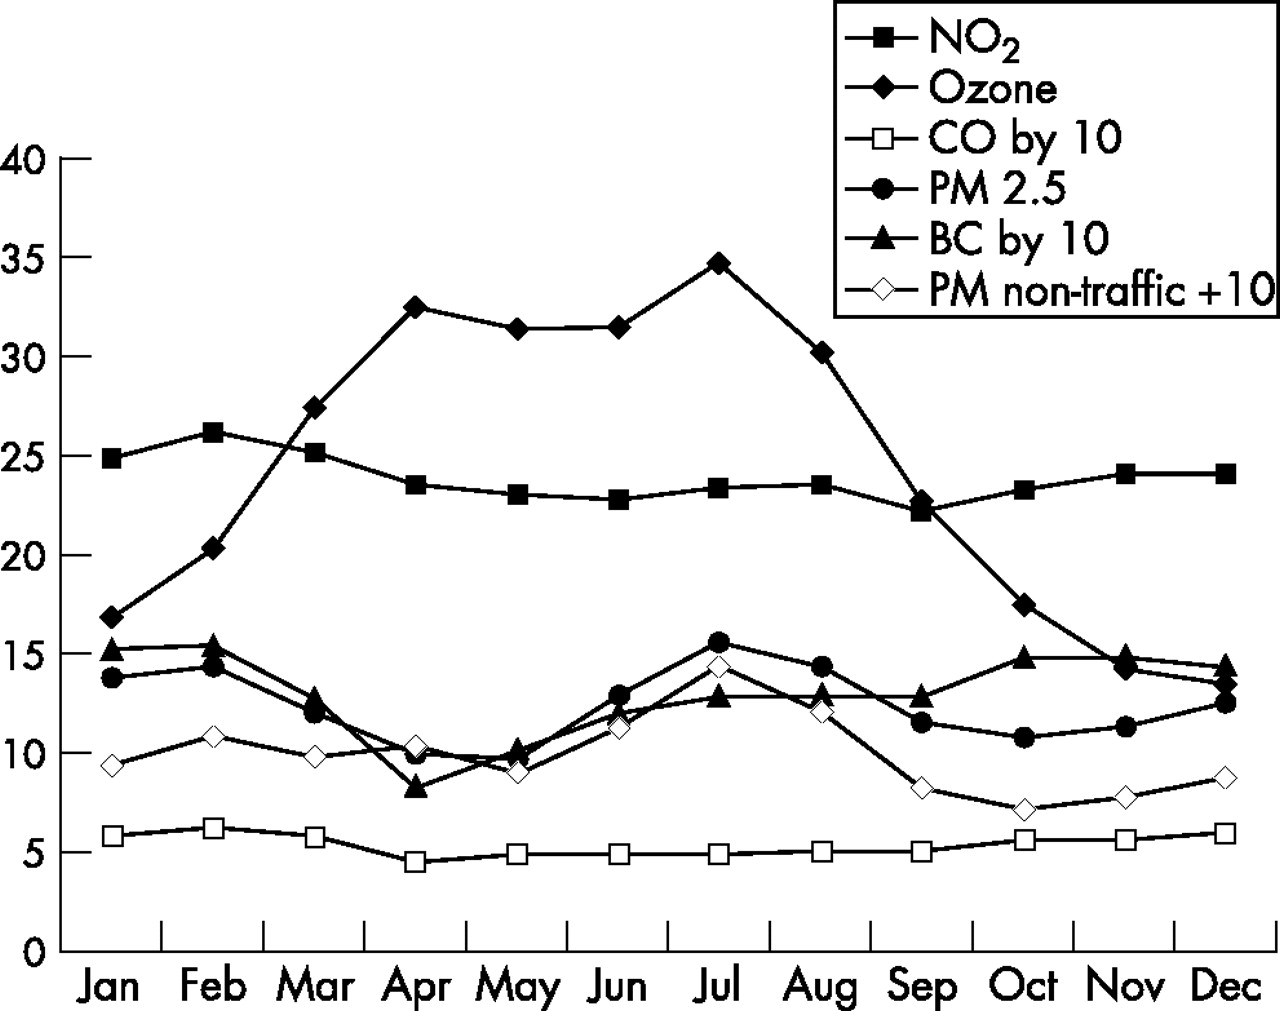
Figure 1 shows the monthly distribution of the pollution, with ozone presenting higher concentration during summer, and BC during the winter.

Boston: monthly distribution of the pollutants. Because of a different scale among pollutants CO and BC have been multiplied by 10.
Table 4 shows the associations with air pollution. Overall, for MI, we found the largest effect estimate for the mean of lags 0 and 1 for NO2 with a 12.7% increase (95% CI: 5.8, 18.04) for an increase of 16.8 ppb in NO2, followed by PM2.5 with a 8.65% increase (95% CI: 1.2, 15.38) for a 16.32 μg/m3 increase in PM2.5, BC (8.34% increase (95% CI: 0.2, 15.8) for 1.7 μg/m3), and non-traffic particles, which were marginally insignificant. Ozone was not significant as a predictor.
Boston: percentage change in myocardial infarction, and pneumonia admissions for an increase in the difference between the 90th and 10th centile of PM2.5, BC, NO2, ozone, CO, and PM non-traffic for the same day and the mean of the same and previous day. Significant results are in bold type
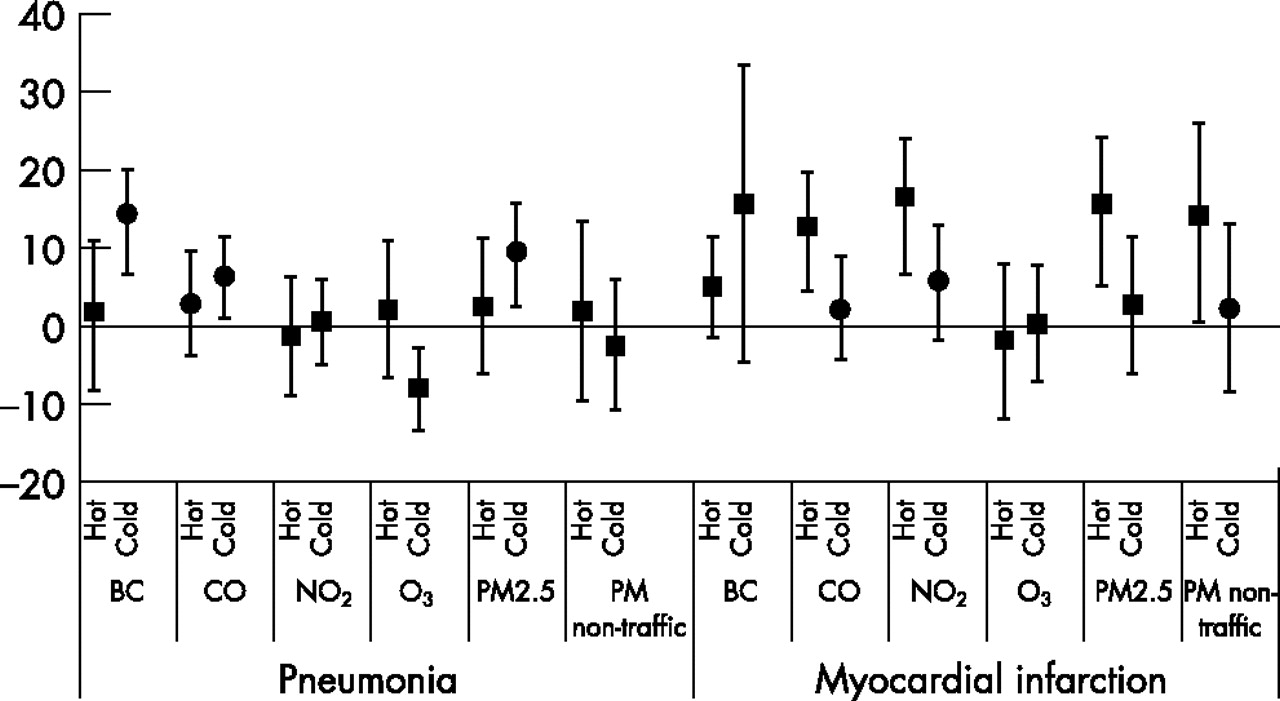
When the analysis was repeated including an interaction term by season (fig 2), we found stronger associations with most pollutants in the warm season. In that case, the association with CO (12.8% increase (95% CI: 4.4, 19.6) for 0.33 ppm) and NO2 (16.5% increase (95% CI :6.7, 23.9) for 20.2 ppb) became considerably stronger than in the full year analysis, and with non-traffic particles also showed a significant association. Ozone was not associated with MI admissions in the warm season. In the cold season, by contrast, the largest effect was for BC, however that had a wide confidence interval. No pollutant had a significant association with MI in the cold season.

Boston: percentage change in myocardial infarction and pneumonia admissions for an increase in the difference between the 90th and 10th centile of PM2.5, BC, NO2, ozone, CO, PM non-traffic, and BC for the same day. Analysis by season defined as hot and cold weather.
For pneumonia, the largest effect estimate (table 4) was for BC with a 11.7% increase (95% CI: 4.8, 17.4) for a 1.7 μg/m3 increase in BC, followed by PM2.5 at lag 0 (6.5% increase (95% CI: 1.1, 11.4) for a 17.1 μg/m3 increase) and CO (5.45% increase (95% CI: 1.1, 9.5) for 0.475 ppm), with a protective effect for ozone, that was barely significant with a two day average exposure. When analyses by season (fig 2) were performed, we found no associations with pneumonia admissions in the warm season. In the cold season, the largest effect was again for BC (14.3% increase (95% CI: 6.7, 20.1) for a 1.7 μg/m3 increase), and ozone showed a protective association.
DISCUSSION
We found significant associations between air pollution and hospital admissions for MI and pneumonia. Similar associations have been reported before. These results differ in that there was a clear difference by season, with the MI associations only in the summer, and the pneumonia associations only in the winter. In addition, the use of PM2.5, PM non-traffic, and BC allowed us to better focus on sources of pollution. For pneumonia admissions, we found the largest estimates for BC, a surrogate for traffic particles. PM2.5 showed a weaker effect, and CO, also a traffic pollutant, a significant, but weaker association. This suggests a more specific association with traffic particles than with fine particles or other markers of traffic pollution.
In contrast, for MI admissions in the warm season, the CO association showed the largest estimated effect, but the NO2 and PM2.5 associations were essentially similar in magnitude. The association with BC was noticeably weaker, and there was a significant association with non-traffic particles. Taken together this presents a more complex picture, with both traffic pollutants and non-traffic pollutants triggering MI. The lack of association with ozone combined with the significant association with non-traffic particles, which in Boston in the warm season are dominated by regional secondary particles, primarily sulphate particles, suggests sulphates and other secondary particles are the principal non-traffic pollutant of concern.
This is partially consistent with the results of Peters and coworkers, who found stronger associations with NO2 and BC than with PM2.5.
We previously found an association between pneumonia and PM10 in a multicity time series analysis.16 In Boston we similarly found an association with pneumonia admissions. The BC and CO effects were the largest. Fusco and coauthors,24 found a strong effect of CO and NO2 on respiratory admission in Rome, where pollution (including particles) is dominated by traffic. They did not have BC or PM2.5 measurements in that study. Given the lack of plausible mechanism for CO to influence pneumonia, we believe the CO findings should be interpreted as probably reflecting some other traffic related pollutant.
Atkinson for the APHEA 2 group1 found an association with asthma and all respiratory admissions, but not chronic obstructive pulmonary disease admissions and PM10, and a smaller estimate for black smoke.
There are several recent studies of intermediate markers of health in Boston showing associations between PM2.5 and/or components of fine particles.
De Meo and coworkers41 found a significant effect of ambient particulate air pollution on decreased oxygen saturation at rest in a cohort of older people studied during the summer of 1999 in Boston. This suggests that pollution may results in low levels of hypoxaemia, which may in turn affect the cardiovascular system in ways that influence cardiopulmonary events.
Another study in Boston42 suggests that changes in PM2.5 lead to within-person increases in resting and exercise blood pressure among vulnerable patients with cardiovascular disease. In a Los Angeles panel study of patients with chronic obstructive pulmonary disease43 and in a large cross sectional German study of older adults,44 higher levels of air pollution were also associated with higher blood pressure.
In Boston45 exposure to summertime air pollution and heart rate variability was examined in a panel study of 28 elderly subjects and we found stronger associations with BC, an indicator of traffic particles, than with PM2.5; CO had similar patterns of association to black carbon.
Another study in Boston46 used implanted cardioverter defibrillator records of ventricular tachyarrhythmias to assess the role of air pollution as a trigger of these potentially life threatening events. The authors found that associations of ventricular tachyarrhythmias with fine particle mass, CO, NO2, and BC suggest a link with motor vehicle pollutants.
Policy implications
Reducing levels of pollution from diesel engines and coal burning power plants, even in cities with comparatively low concentrations, will prevent serious health consequences.
What is already known on this topic
Significant associations between PM10 and hospital admissions for MI and respiratory causes have been reported before.
Hypotheses to explain the potential mechanisms for these particle effects might entail systemic inflammation, changes in autonomic function, or oxidative stress capable of influencing both cardiovascular and pulmonary physiology.
Zelikoff has reported that animals infected with strep pneumonia, and subsequently exposed to concentrated air particles, had double the bacterial burden in the lungs 48 hours later, compared with animals exposed to filtered air.47
Other human and animal studies48 support the role of particles in increasing systemic inflammation, with pollution related increases in plasma viscosity,49 C reactive protein,50–52 plasma fibrinogen,53 white blood cell counts,54,55 and blood pressure.43,44 Our findings in this Boston study provide support for another link in the ongoing research into the biological mechanism of air pollution and health.
The paper of Laden and colleagues analysed the elemental composition of PM2.5 to identify source related fractions of fine particles. The data used were for the years 1979–1988 and in that study mobile sources in Boston accounted for 29% of PM2.5, while power plant based sulphate particles accounted for 50% of fine mass. In our analysis traffic accounted for a somewhat larger fraction of the PM2.5 than in the earlier study, but this is consistent with the increased traffic over the period and the modest reduction of particles from coal burning power plants (included in our “PM2.5 non-traffic”) because of the acid rain control provisions of the 1990 clean air act. Laden and coworkers report power plant particles were more associated with respiratory deaths and traffic particles with cardiovascular deaths.
One limitation of the study is that we could not analyse other components of the particles such as organic carbon, metals, and sulphates, because these data were not available for the time period when we had hospitalisation data.
Another limitation of this study is the use of a central site for monitoring air pollution. Recent studies comparing personal with ambient exposure have reported good correlations between day to day changes in central station PM2.5 and personal exposure.56,57 The correlation for BC is weaker, and this added exposure error may have weakened the relative effects of BC. Of particular interest, Sarnat and coworkers have shown this to be the case in Boston,58 and that day to day variations in ambient CO and NO2 are better predictors of personal exposure to BC than of personal exposure to themselves. Hence the use of ambient monitors for particle exposure seems justifiable, while the associations with gases from traffic sources may be more general surrogates for traffic exposure, or specifically traffic particles.
What the paper adds
This manuscript is one of the first to examine PM2.5 and its components, as well as gaseous air pollutants in their association with specific causes of hospital admissions (heart attacks and pneumonia) in an elderly popluation.
In future studies the use of GIS based exposure measures in large population studies could be useful to focus on the health effects of more individualised measures of exposure to air pollution.
This manuscript is important to the field of public health as it is one of the first to examine PM2.5 and its components, as well as gaseous air pollutants in their association with specific causes of hospital admissions (heart attacks and pneumonia) in an elderly population. We report the pattern of associations varied by season, and that both traffic pollutants and non-traffic particles were associated with heart attacks.
REFERENCES
Footnotes
-
Funding: this study was funded by the EPA/Harvard Center on Ambient Particle Health Effects EPA PM Center: US EPA Grant R827353.
-
Competing interests: none.
Linked Articles
- In this issue