Article Text

Abstract
Objectives To determine the mean body mass index (BMI, kg/m2) and prevalence of low weight (BMI<20) and obesity (BMI≥30) in 3 population-based surveys, and to describe the longitudinal changes during 1994–2008 in mean BMI, and the prevalence of low weight and obesity.
Setting A population study in Tromsø, Norway.
Participants A total of 29 688 different participants in 1 or more of 3 surveys (1994–1995, 2001–2002 and 2007–2008). Longitudinal analyses comprised 9845 participants aged 25–69 in 1994 who participated in the 1994–1995 and 2007–2008 surveys and 4202 men and women who participated in all 3 surveys.
Outcome measures Mean age-specific and sex-specific BMI, prevalence of low weight and obesity, and changes in BMI and prevalence of low weight and obesity during 1994–2008, according to sex and birth cohort.
Results The age-adjusted (ages 30–84) prevalence of obesity increased from 9.8% and 11.8% in men and women, respectively, in 1994–1995 to 20.9% and 18.5%, respectively, in 2007–2008. The increase in mean age-adjusted BMI was stronger from 1994–1995 to 2001–2002 than from 2001–2002 to 2007–2008. Longitudinal results confirmed that the change in BMI from 1994–1995 to 2001–2002 was larger (0.9 kg/m2 (95% CI 0.8 to 1.0) in men and 1.3 kg/m2 (95% CI 1.2 to 1.4) in women) than from 2001–2002 to 2007–2008 (0.2 kg/m2 (95% CI 0.1 to 0.3) in men and women). The most recently born had the largest increase (p<0.001).
Conclusions The mean BMI and the prevalence of obesity are still increasing in Tromsø, and the increase is strongest in the youngest age groups. However, the increase in BMI was less marked in the last period (from 2001–2002 to 2007–2008) than in the first period (1994–1995 to 2001–2002).
- EPIDEMIOLOGY
- PUBLIC HEALTH
- DIABETES & ENDOCRINOLOGY
- NUTRITION & DIETETICS
This is an Open Access article distributed in accordance with the Creative Commons Attribution Non Commercial (CC BY-NC 4.0) license, which permits others to distribute, remix, adapt, build upon this work non-commercially, and license their derivative works on different terms, provided the original work is properly cited and the use is non-commercial. See: http://creativecommons.org/licenses/by-nc/4.0/
Statistics from Altmetric.com
Strengths and limitations of this study
This is a longitudinal study of a large group of individuals; 9845 participants who participated in two screenings in 1994–1995 and 2007–2008, and 4202 participants who also participated in a third screening in 2001.
Height and weight were measured, not self-reported.
Relatively high response rate (66–79% in the three cross-sectional surveys) and no indications that the body mass index (BMI) differed in participants who were, and were not, included in the prospective analyses of changes from 1994 to 2008.
Selective attrition may have taken place, particularly in the older participants.
BMI is not a perfect measure of the proportion of body fat. This is of particular importance for the longitudinal analyses. With advancing age, maintenance of weight implies an increase in the proportion of body fat. Furthermore, because of age-related loss of height, the BMI will increase.
Introduction
Obesity and overweight are well-known risk factors for numerous health problems such as cardiovascular disease, cancer and diabetes.1 The prevalence continues to increase worldwide,2 ,3 Norway being no exception.4–6 A recent study from Norway found more than 20% of the adult population was obese.5 However, some studies from the Western world suggest that the body mass index (BMI, kg/m2) does not increase as rapidly as previously.7–9
Several cross-sectional studies suggest that in men, mean BMI and the prevalence of obesity increases with age in young and middle-aged men, then levels off and is reduced in the elderly.5 ,10–12 This relationship seems not to hold in longitudinal analyses of men. The highest increase takes place in the younger age groups.10 ,11 ,13–18 Thus, cross-sectional studies may give a misleading picture about the relationships between age and BMI.
Repeated cross-sectional studies in the same population give information about the changes in age-adjusted mean BMI and the prevalence of obesity. They also give gender-specific and age-specific figures. However, longitudinal studies may provide better opportunities for exploring in which groups of the population the changes in BMI have taken place and why the obesity epidemic may have come to a halt in some populations.
We have previously reported an increase in BMI in all included 5-year birth cohorts in the Tromsø municipality during 1974–1994.10 We now present cross-sectional results based on data from the screenings in 2001–2002 and 2007–2008 as well as the longitudinal changes in BMI and prevalence of low weight (BMI<20 kg/m2) and obesity (BMI≥30 kg/m2) from 1994 to 2008, including 9845 men and women aged 25–69 in 1994.
Methods
The Tromsø Study consists of six surveys conducted in Tromsø in Northern Norway from 1974 to 2008.19 The present analyses are based on the fourth, fifth and sixth Tromsø surveys. Tromsø 4 was conducted in 1994–1995, Tromsø 5 in 2001–2002 and Tromsø 6 in 2007–2008. Details concerning the three different surveys are given elsewhere.19 ,20
The fourth Tromsø Survey (Tromsø 4) took place in 1994–1995, and the entire population of Tromsø born before 1970, that is, aged 25 and above, 37 558 men and women, was invited and 27 158 (72%) participated. A subsample of this population including all participants aged 55–74, and smaller samples aged 25–54 and 75–84 were invited to a more comprehensive examination called the second visit.19 The fifth Tromsø Survey (Tromsø 5) was conducted in 2001–2002. All participants from the second visit in Tromsø 4 in addition to all those in the age groups of 30, 40, 45, 60 and 75 years in Tromsø were invited. Out of the 10 353 invited men and women, 8130 (79%) participated in Tromsø 5. The sixth Tromsø Survey (Tromsø 6) was conducted in 2007–2008. The 12 984 participants (of 19 762 invited, 66%) were invited from four different groups: participants from the second visit in Tromsø 4, a 10% random sample of the age group 30–39, everyone in the age groups 40–42 and 60–87 and a 40% random sample of people aged 43–49 years.20
The clinical examination in the surveys all included measurement of height and weight with light clothing and no footwear. Height was measured in a standing position, to the nearest 1 cm in Tromsø 4 and nearest 0.1 cm in Tromsø 5 and 6. In Tromsø 4, weight was measured to the nearest 500 g; in Tromsø 5 and 6, to the nearest 100 g. BMI was calculated as weight divided by the square of height (kg/m2).
Information concerning current pregnancy was obtained by questionnaires and interview. The present cross-sectional analyses included men and non-pregnant women with measurements of height and weight without remark concerning the height and weight measurement (eg, scoliosis, measured with shoes, etc). A total of 26 083 men and women were included in the cross-sectional analyses of BMI based on the Tromsø 4 survey conducted in 1994–1995. The corresponding figures for Tromsø 5 (2001–2002) and Tromsø 6 (2007–2008) were 7885 and 12 868, respectively. A total of 29 688 different participants in three surveys were included in the analyses.
The longitudinal analyses of the changes in BMI included participants aged 25–69 (born 1925–1969) in Tromsø 4 with valid measurements in Tromsø 4 (1994–1995) and Tromsø 6 (2007–2008) surveys. Older participants (aged 70 and above in 1994) were not included because only 200 of 1210 older participants (all 70–74 years old) who participated in Tromsø 4 also participated in the survey 13 years later. A total of 9 845 participants (4 616 men and 5 229 women) were followed for 13 years with regard to changes in BMI. Some analyses were restricted to the subgroup of 4202 men and women who also had participated in Tromsø 5 (2001–2002).
Four of 10 participants aged 25–69 in Tromsø 4 who had their weight and height measured in Tromsø 4 also took part in the survey 13 years later (Tromsø 6). This percentage reflects both the proportion that was invited who participated and whether they were invited or not (eg, because they had died or moved out of Tromsø). The mean BMI in Tromsø 4 of the 9 845 participants who had a valid (eg, non-pregnant) BMI measurement in Tromsø 4 and were followed from Tromsø 4 to 6 were compared with the BMI in the rest of the study participants in Tromsø 4 with a valid measurement of BMI in Tromsø 4. When adjusted for age, no significant difference in BMI was found (p≥0.5 for men and women). When stratified for 5-year groups, few differences in BMI were revealed between participants who also participated in Tromsø 6 and those who did not. In men aged 40–44 and 45–49 in Tromsø 4, a 0.34 kg/m2 higher BMI was found in those who participated in both surveys (p=0.05), and in women aged 55–59, a 0.64 kg/m2 lower BMI was found in those who participated in both surveys (p=0.05). Thus, our findings indicate that the longitudinal cohort is representative with regard to BMI at baseline of the participants who participated in Tromsø 4.
In the cross-sectional analyses, BMI is presented according to three customised categories, which were defined as low weight (BMI<20 kg/m2), normal (BMI 20–29.9 kg/m2) or obesity (BMI≥30 kg/m2). WHO suggests more specific categories,21 but as the prevalence of underweight (BMI<18.5 kg/m2) was very low (see table 1), BMI<20 kg/m2 was considered to indicate low weight. Obesity is classified by WHO as obesity class 1 (BMI 30.0–34.9 kg/m2), obesity class 2 (BMI 35.0–39.9 kg/m2) or obesity class 3 (BMI≥40.0 kg/m2). The prevalence of obesity classes 2 and 3 were relatively low, however, and the three obesity classes were merged and obesity was considered present if BMI≥30.0 kg/m2. A more detailed distribution of BMI is nonetheless provided in table 1. The results from the longitudinal analyses are presented according to birth cohorts, while the results from the cross-sectional analyses are presented according to age groups in each survey. Age is given as age in years as on 31 Dec 1994 for Tromsø 4, as on 31 Dec 2001 in Tromsø 5, and as on 31 Dec 2007 in Tromsø 6, respectively.
Distribution of body mass index (BMI, kg/m2) and age-adjusted BMI and prevalence (%) of obesity (BMI ≥30 kg/m2) in Tromsø 4 (1994–1995), Tromsø 5 (2001) and Tromsø 6 (2007–2008)—cross-sectional analyses
All statistical analyses were performed using SAS V.9.4.22 They included simple descriptive analyses, χ2 tests, independent sample t test and linear regression. Age adjustment of mean BMI in the three surveys was carried out by the direct method, with the population of Tromsø 4 serving as the reference population. A p value of <0.05 was considered statistically significant. The Tromsø Study was approved by the Regional Committee for Research Ethics.
Results
Tables 2⇓–4 give the results from the cross-sectional studies in Tromsø 4, 5 and 6, respectively. We found increased mean BMI and prevalence of obesity and reduced prevalence of low weight during the time period from Tromsø 4 to 6, with a more consistent and larger increase in mean BMI and prevalence of obesity from Tromsø 4 (1994–1995) to Tromsø 5 (2001–2002) than from Tromsø 5 to 6 (2007–2008). Low weight was found more often in women than in men, but particularly in young women and old men. In men, the mean BMI and the prevalence of obesity increases with age to the mid-50s (in Tromsø 6 to the age group 60–64), and thereafter is reduced. In women, a reduction in BMI and the prevalence of obesity with age was seen only in women aged 80 and above, if at all.
Mean body mass index (BMI, kg/m2) (SD) and prevalence (%) of low weight (BMI<20 kg/m2) and obesity (BMI≥30 kg/m2) in Tromsø 4 (1994–1995) according to age groups and gender
Mean body mass index (BMI, kg/m2) (SD) and prevalence (%) of low weight (BMI<20 kg/m2) and obesity (BMI≥30 kg/m2) and in Tromsø 5 (2001) according to age groups and gender
Mean body mass index (BMI, kg/m2) (SD) and prevalence (%) of low weight (BMI<20 kg/m2) and obesity (BMI≥30 kg/m2) and in Tromsø 6 (2007–2008) according to age groups and gender
A detailed BMI distribution and age-adjusted BMI and prevalence of obesity in the three surveys is given in table 1.
The prevalence of underweight (BMI<18.5 kg/m2) was reduced by 50%, whereas the prevalence of obesity (BMI≥30 kg/m2) and of obesity classes 2 and 3 (BMI≥35 kg/m2) doubled from Tromsø 4 to 6. The age-adjusted (ages 30–84) prevalence of obesity increased in men from 9.8% (Tromsø 4) to 16.7% (Tromsø 5) and 20.9% (Tromsø 6). The corresponding figures for women were 11.8%, 15.2% and 18.5%, respectively.
A total of 9845 men and women aged 25–69 in 1994 had valid measurements of BMI in 1994–1995 and 2007–2008. Tables 5 and 6 give the longitudinal results with regard to the proportion that were underweight, obese and the mean BMI according to birth cohort (5-year groups). For both men and women, the proportion with low weight fell during the 13-year period, and the proportion that was obese approximately doubled to above 20%. Mean BMI increased in all birth cohorts, and the most recently born had a larger increase in BMI. There was a statistically highly significant relationship between birth cohort and change in BMI (p<0.001).
Mean body mass index (BMI kg/m2) and prevalence (%) of low weight (BMI<20 kg/m2) and obesity (BMI≥30 kg/m2) as well as mean change in BMI (95% CI) according to 5-year birth cohorts in 4 616 men who participated in Tromsø 4 (1994–1995) and Tromsø 6 (2007–2008)
Mean body mass index (BMI kg/m2), prevalence (%) of low weight (BMI<20 kg/m2) and obesity (BMI≥30 kg/m2) as well as mean change in BMI (95% CI) according to 5-year birth cohorts in 5 229 women who participated in Tromsø 4 (1994–1995) and Tromsø 6 (2007–2008)
These changes in BMI were reflected in change in body weight. Mean increase in body weight in men and women included in the analyses was 4.0 and 4.2 kg, respectively. Men and women born during 1965–1969 put on 7.6 kg (95% CI 7.0 to 8.2) during the 1994–2008 period, whereas men born during 1925–1929 had a modest 0.5 kg (95% CI −0.3 to 1.4) increase in body weight. Women born during 1925–1929 had a 0.2 kg reduction in body weight (95% CI −0.5 to 0.9).
A total of 1729 men and 2473 women had also participated in Tromsø 5 (2001–2002) in addition to Tromsø 4 and 6. In men and women, the change in BMI from Tromsø 4 to 5 was much larger (0.9 kg/m2 (95% CI 0.8 to 1.0) in men and 1.3 kg/m2 (95% CI 1.2 to 1.4) in women) compared to that from Tromsø 5 to 6 (0.2 kg/m2 (95% CI 0.1 to 0.3) in both men and women) (results not shown in the tables). The prevalence of obesity in men increased from 10.2% in Tromsø 4 to 17.9% in Tromsø 5 and to 19.6% in Tromsø 6. The corresponding figures for women were 12.4% in Tromsø 4, 20% in Tromsø 5 and 21.7% in Tromsø 6.
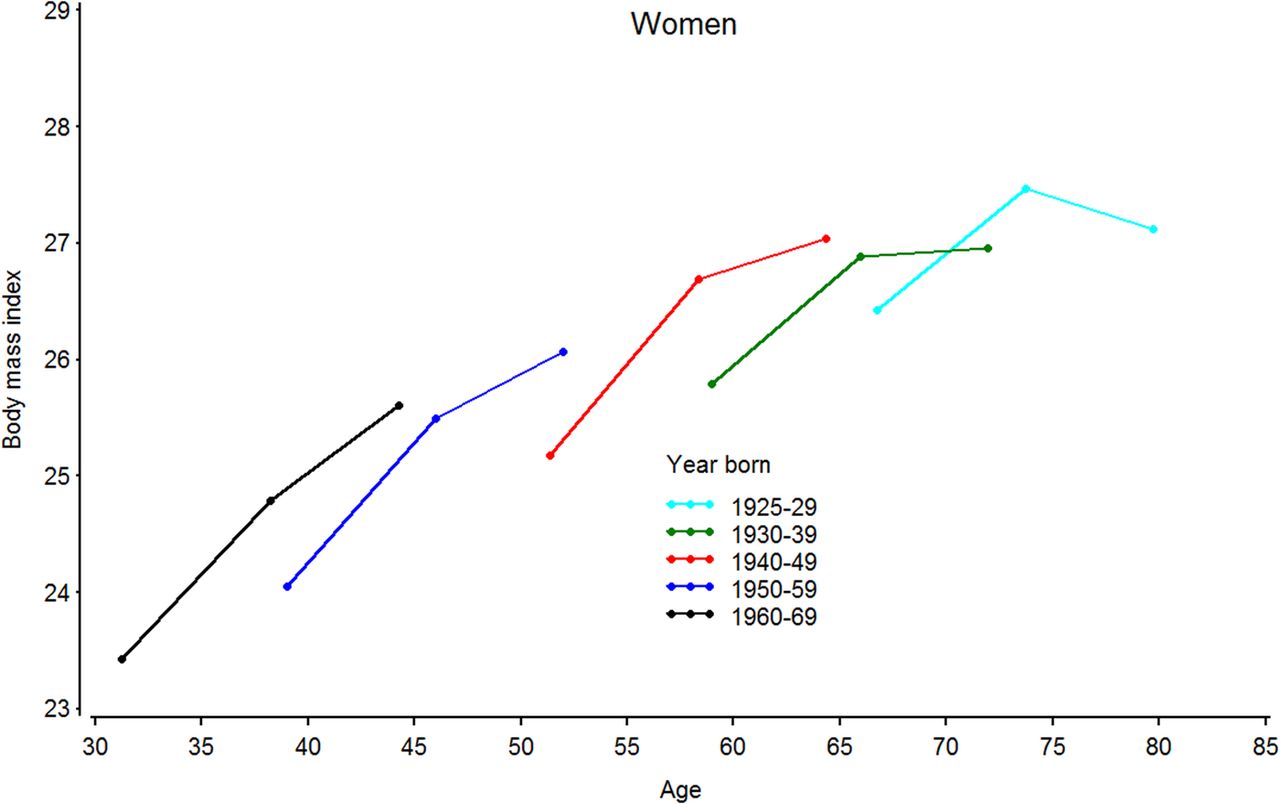
Figures 1 and 2 display the mean BMI according to age and birth cohort in participants who had participated in all three surveys. Figure 1 gives the results for men, and figure 2 the results for women. Men born during 1925–1929, 1930–1939 and 1940–1949 had no significant change (0.1 kg/m2 increase (95% CI:−0.2 to 0.3, 0 to 0.2 and 0 to 0.3, respectively) in BMI between Tromsø 5 and 6 (figure 1). Similarly, women born during 1930–1939 had no significant change (0.1 kg/m2 increase (95% CI −0.1 to 0.2)) and women born during 1925–1929 showed a statistically significant decrease (0.3 kg/m2 (95% CI 0.1 to 0.6)) in BMI between the two last surveys (figure 2). With these exceptions, the mean BMI increased statistically significantly in all 10-year birth cohort groups both between Tromsø 4 and 5 and between Tromsø 5 and 6. This was the situation for both men and women (figures 1 and 2). Furthermore, for both men and women, there were a highly significant statistical relationship between birth cohort and change in BMI (p<0.001), both for the changes between Tromsø 4 and 5 and between Tromsø 5 and 6. Thus, the larger change in BMI in the most recently born was a consistent finding.

Mean body mass index (kg/m2) according to age and birth cohort in 1729 men who participated in Tromsø 4 (1994–1995), Tromsø 5 (2001–2002) and Tromsø 6 (2007–2008).

Mean body mass index (kg/m2) according to age and birth cohort in 2473 women who participated in Tromsø 4 (1994–1995), Tromsø 5 (2001–2002) and Tromsø 6 (2007–2008).
Discussion
In this population-based longitudinal study, we found in gender-specific analyses that BMI increased from 1994–1995 to 2007–2008 in all included birth cohorts (participants born 1925–1969). The increase was largest in the younger birth cohorts, and the prevalence of obesity (BMI≥30 kg/m2) doubled from the Tromsø 4 survey in 1994–1995 to Tromsø 6 in 2007–2008. Furthermore, the largest increase in BMI took place in the first part of this 13-year period.
BMI has increased across all age groups in both genders in the population under study, suggesting a continuation of the development in BMI in the Tromsø Study population.10 As is evident from tables 1⇑⇑–4, an increase in BMI took place from the Tromsø 4 survey in 1994–1995 to the Tromsø 6 survey 13 years later in all age groups and both genders. The prevalence of obesity (BMI≥30 kg/m2) and obesity classes 2 and 3 (BMI≥35 kg/m2) in Tromsø 6 seems, however, to be somewhat lower than in the HUNT 3 study which was conducted in the same period (2006–2008). 5
Both the cross-sectional (table 1) and longitudinal findings (figures 1 and 2) present evidence that the major increase in BMI and the prevalence of obesity took place in the first period, from Tromsø 4 to 5. These results are in accordance with some international trends.7–9 In the large HUNT Study, also in Norway, the prevalence of obesity increased as much between HUNT 1 (1984–1986) and HUNT 2 (1995–1997) as between HUNT 2 and HUNT 3 (2006–2008). 5
The results from the present cross-sectional analyses indicate that BMI peaks in men at around 55–60 years of age before declining. The pattern is consistent in all three surveys. The longitudinal analyses (tables 5 and 6) show that the reason for this is a cohort effect; the mean BMI and prevalence of obesity increases from Tromsø 4 to 6 in all 5-year birth cohorts, but the increase is larger in men in the younger birth cohorts. In men and women, and for the changes between Tromsø 4 and 5 and Tromsø 5 and 6, we noted a statistically highly significant relationship between birth cohort and change in BMI (p<0.001). Thus, our findings extend the results from the longitudinal analyses of changes in BMI in the Tromsø Study participants during 1974 (1979 in women) to 1994–1995.10 They also confirm results from other studies in Norway5 ,13 ,14 and other countries,11 ,15–18 that the largest weight gain takes place in the younger age groups.
The present study has several strengths. Height and weight were measured using standardised procedures, not self-reported. Self-reported weight and height are likely to be underestimated and overestimated, respectively.23 ,24 Furthermore, although the rate of participation has decreased somewhat (from 72% in the 1994–1995 survey to 66% in the survey conducted in 2007–2008), the survey still enjoys a high response rate compared to similar studies in Norway conducted in the same period.25 ,26
We also acknowledge some limitations. A significant proportion of the invited population did not participate in the surveys. In all three surveys (Tromsø 4, 5 and 6), those who did not participate tended to be men and (except for women in Tromsø 6) to have lower mean age than participants. A study of selection bias among participants in the Tromsø 2 survey found that those who did not participate were over-represented among young, unmarried men 27 and participants who did not participate in the Tromsø Study surveys tend to have increased mortality.19 Results from very similar surveys conducted in Norway indicate that those who did not participate had higher level of some chronic health problems, higher mortality and prevalence of disability pension and lower socioeconomic status than participants did.26 ,28
Selective attrition may introduce bias in the longitudinal analysis. There were, however, few indications of different mean BMI in participants who were followed for 13 years from Tromsø 4 to 6 than in participants who were not included in the Tromsø 6 survey (because they, although living in Tromsø, were not eligible for invitation, chose not to participate if invited, had moved out of Tromsø or died). Analysis of BMI among the elderly is particularly prone to survival bias, 29 as participants with high BMI may have died or were too ill to participate. Several studies, including the Tromsø Study,30 have shown that the relationship between BMI and mortality is not strong in elderly people. However, selective survival according to BMI cannot be excluded, and we particularly assume that the reduction of BMI from Tromsø 5 to 6 in women born 1925–1929 (ie, aged 78–82 in Tromsø 6) partly can be attributed to selection.
BMI has some inherent weaknesses as a measure of body composition and obesity. Athletes with relatively high muscle mass may have high BMI. The inclusion of elderly people in our analyses introduces another two sources of error. A slight decline in BMI is not synonymous with a reduction in adipose tissue as there are age-related changes in body composition. With advancing age, the percentage of fat increases relative to that of lean mass, that is, maintenance of weight and BMI would imply an increase of fat mass.29 ,31 On the other hand, particularly women experience a height reduction with advancing age, 32 and an increase in BMI in the longitudinal analyses may be caused by reduced height. The average height for women in the longitudinal cohort aged 65–69 in Tromsø 4 fell from 161.0 cm in 1994–1995 to 158.7 cm 13 years later, resulting in a not negligible 0.8 kg/m2 increase in BMI given the mean body weight of this age group in 1994–1995 (68.4 kg). Thus, the lower increase in BMI with age in the longitudinal analyses cannot be explained by the age-related decrease in height.
Some of the cross-sectional results have been published previously. Data from Tromsø 4 (table 2) were included in an analyses of longitudinal changes from 1974 (Tromsø 1) to 1994 (Tromsø 4). 10 They are included here to form a background for the longitudinal analyses. Table 2 differs slightly from that in the previous publication because of an update of the Tromsø Study database. Cross-sectional information concerning the mean BMI in some selected age groups in Tromsø 5 (2001–2002) has been included in some previous papers,4 ,33 and concerning Tromsø 6 in the description of the sixth Tromsø survey.20 However, detailed cross-sectional results from Tromsø 5 and 6, including the mean BMI and prevalence of low weight and obesity, have not been presented previously. The same is true for the age-adjusted comparisons of the three surveys (table 1) and all the longitudinal results (tables 5 and 6 and both the figures).
In conclusion, we have found that BMI increased statistically significantly in all considered birth cohorts (born between 1925 and 1969) between 1994–1995 (Tromsø 4) and 2007–2008 (Tromsø 6); the prevalence of obesity has doubled. The increase in the youngest age cohorts for both genders is a cause for great concern. However, the increase in mean BMI was markedly less striking during the 6 years between Tromsø 5 and 6 than during the 7 years between Tromsø 4 and 5. Thus, the BMI and prevalence of obesity may not increase as rapidly now as in the previous two decades.7–9
Acknowledgments
The authors thank the National Screening Services (SHUS) who were responsible for the measurement of height and weight in the fourth and fifth Tromsø Study. Tromsø 6 was mainly funded by the University of Tromsø and The Northern Norway Regional Health Authority Medical Programme, and supported by grants from The Norwegian Research Council.
References
Footnotes
Contributors BKJ initiated the analyses. BKJ and NAA both took part in the data analyses, interpretation of data and writing of the manuscript. Both authors have read and approved the submitted version of the manuscript.
Funding This research received no specific grant from any funding agency in the public, commercial or not-for-profit sectors.
Competing interests None declared.
Ethics approval All individuals gave written informed consent to participate. The Tromsø Study was approved by the Data Inspectorate of Norway and the Regional Committee of Medical and Health Research Ethics, North Norway (Reference: 2009/2536/REK nord).
Provenance and peer review Not commissioned; externally peer reviewed.
Data sharing statement No additional data are available.