Article Text

Abstract
Objective Sudden cardiac arrest (SCA) is the most devastating outcome in hypertrophic cardiomyopathy (HCM). We evaluated repolarisation features on the surface electrocardiogram (ECG) to identify the potential risk factors for SCA.
Methods Data was collected from 52 patients with HCM who underwent implantable cardioverter defibrillator (ICD) implantation. Leads V2 and V5 from the ECG closest to the time of ICD implant were utilised for measuring the Tpeak-Tend interval (Tpe), QTc, Tpe/QTc, T-wave duration and T-wave amplitude. The presence of the five traditional SCA-associated risk factors was assessed, as well as the HCM risk-SCD score.
Results 16 (30%) patients experienced aborted cardiac arrest over 8.5±4.1 years, with 9 receiving an ICD shock and 7 receiving ATP. On univariate analysis, T-wave amplitude was associated with appropriate ICD therapy (HR per 0.1 mV 0.79, 95% CI 0.56 to 0.96, p=0.02). Aborted SCA was not associated with a greater mean QTc duration, Tpeak-Tend interval, T-wave duration, or Tpe/QT ratio. Multivariate analysis (adjusting for cardinal HCM SCA-risk factors) showed T-wave amplitude in Lead V2 was an independent predictor of risk (adjusted HR per 0.1 mV 0.74, 95% CI 0.57 to 0.97, p=0.03). Addition of T-wave amplitude in Lead V2 to the traditional risk factors resulted in significant improvement in risk stratification (C-statistic from 0.65 to 0.75) but did not improve the performance of the HCM SCD-risk score.
Conclusions T-wave amplitude is a novel marker of SCA in this high risk HCM population and may provide incremental predictive value to established risk factors. Further work is needed to define the role of repolarisation abnormalities in predicting SCA in HCM.
- T wave
This is an Open Access article distributed in accordance with the Creative Commons Attribution Non Commercial (CC BY-NC 4.0) license, which permits others to distribute, remix, adapt, build upon this work non-commercially, and license their derivative works on different terms, provided the original work is properly cited and the use is non-commercial. See: http://creativecommons.org/licenses/by-nc/4.0/
Statistics from Altmetric.com
Key questions
What is already known about this subject?
Prevention of sudden cardiac arrest (SCA) is a critical objective in the management of hypertrophic cardiomyopathy (HCM). While implantable cardioverter defibrillator (ICD) implantation for secondary prevention is well established, its role in primary prevention requires refinement due to current imperfect risk stratification. While we are cognizant that repolarisation abnormalities in HCM exist, their role in risk stratification is undefined.
What does this study add?
Our study highlights the potential role for repolarisation abnormities detected on the surface ECG in risk stratification. In particular, reduced T-wave amplitude was associated with an increased likelihood of aborted SCA. Further, T-wave amplitude may provide incremental prognostic value in predicting SCA when combined with the traditional risk factors.
How might this impact on clinical practice?
This study demonstrates the potential to improve clinical risk stratification through the use of the easily obtainable and cost-effective surface ECG.
Introduction
Hypertrophic cardiomyopathy (HCM) is the most common inherited heart condition and the leading cause of sudden cardiac arrest (SCA) in young adults.1–3 Prevention of the lethal and tragic consequence of SCA is a critical objective in the clinical management of HCM. While implantable cardioverter defibrillator (ICD) for secondary prevention is well established, its role in primary prevention requires refinement due to imperfect risk stratification. In current practice, clinical parameters (family history of SCA in ≥1 relative;≥1 episode of unexplained syncope; non-sustained ventricular tachycardia (NSVT) on 24 hours ECG; blood pressure (BP) drop on exercise;≥30 mm of maximal left ventricular (LV) wall thickness are used to predict risk of SCA. Unfortunately, the validity and accuracy of these algorithms to predict SCA in individuals is limited4 ,5 resulting in inappropriate prophylactic ICD implantation and potentially denying others at risk who may not meet the criteria. Recently published European guidelines significantly improve risk prediction using a composite HCM Risk-SCD calculator but still do not account for a direct characterisation of the electrical substrate.
It is well established that ventricular hypertrophy, the underling substrate of HCM, is associated with cellular repolarisation abnormalities due in part to prominence of M-cell current, which, along with cellular hypertrophy, interstitial fibrosis and myocardial disarray predisposes to electrophysiological instability.6 Despite knowledge of repolarisation abnormalities in HCM7 ,8 their role in SCA risk has not been extensively studied, unlike other conditions such as arrhythmogenic right ventricular cardiomyopathy9 Brugada10 and long QT syndromes.11 Therefore, the aim of our study was to determine whether non-invasive measurement of dynamic repolarisation characteristics derived from the surface ECG in patients with HCM may have incremental prognostic significance beyond the current risk markers.
Methods
Study population
We selected all adult patients (≥18 years) with HCM who were evaluated at Mayo Clinic between 2000 and 2010 and underwent de novo ICD implantation based on current guidelines. Only patients who had ICD follow-up at our institution; baseline 12-lead ECG recorded within 8 weeks of ICD implantation; and no known coronary artery disease were included. Patients with a bundle branch block, paced rhythm or atrial fibrillation on the baseline ECG were excluded due to difficulties with measurement of repolarisation.
Clinical outcomes
Aborted SCA was defined in patients who received an appropriate ICD discharge for ventricular arrhythmia or had a non-fatal episode of ventricular fibrillation (VF) or spontaneous sustained ventricular tachycardia (VT) (>30s in duration). Appropriate ICD therapy was defined as antitachycardia pacing (ATP) or shock due tachyarrhythmia of ventricular origin, similar to previous studies.12–14
T-wave analysis
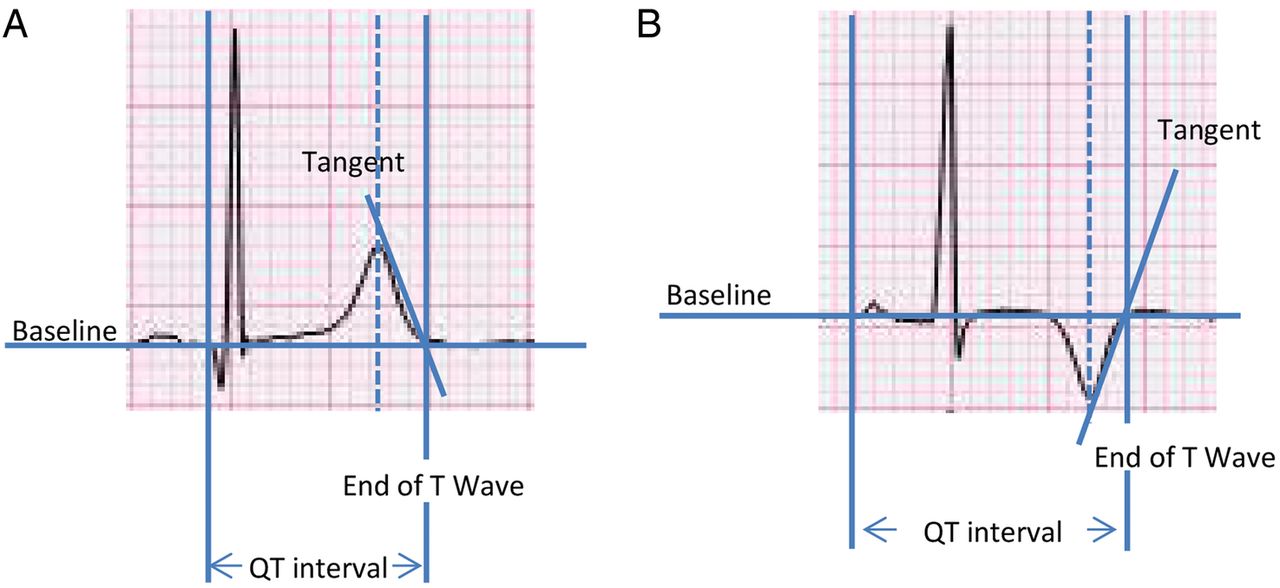
All 12-lead ECGs were obtained within 8 weeks of ICD implantation using standard 10-lead placement recorded at 25 mm/s paper speed and 10 mm/mV amplitude. All measurements were made by a reviewer blinded to the outcome of ICD therapy (AS). ECGs were electronically reviewed in MUSE (General Electric Healthcare, Chicago, Illinois, USA) using digital calipers capable of measuring to within 1 ms. Specific measurements made were: T-wave duration, T-wave amplitude, Tpeak-Tend (Tpe) interval, QT interval and Tpe/QT ratio. Three consecutive beats using leads V2 and V5 were recorded and the average was calculated as described previously.15 ,16 Tpe was defined from peak of the T-wave to the end of the T-wave. The QT interval was measured from the earliest onset of the QRS complex to the end of the T-wave. The end of the T-wave was defined as the intersection of the tangent to the steepest downslope of the T-wave and isoelectric line (often referred to as the Lepeschkin's method).17 ,18 See figure 1. When U waves were present, the QT interval was measured at the nadir of the curve between the T and U waves. The Tpe/QT ratio was then calculated as the ratio of Tpe in that leads to the corresponding QT interval.19 QT was corrected using Bazetts formula. T wave inversion was present in none of the V2 leads and in 13/52 of the V5 leads. If the T wave was negative, the amplitude derived was considered positive.

T wave tangent method for ECG analysis.
Echocardiographic data
Echocardiographic data was obtained from the echocardiogram most proximate to ICD implantation. Some of the recorded variables had missing values; Pulmonary artery systolic pressure n=16 (30.7%), E velocity n=1 (1.9%), A velocity n=5 (9.6%), Medial e’ and lateral e’ n=35 (67.3%).
Risk stratification
All patients met established criteria for ICD implantation in HCM.2 ,20 ,21 These included (1) A history of HCM-related sudden death in ≥1 first-degree or other relatives <50 years of age; (2) massive LV hypertrophy ≥30 mm; (3) NSVT (defined as ≥3 consecutive ventricular beats with rate ≥120 bpm) on 24 hours ECG monitoring; and (4) unexplained syncope. We excluded abnormal BP response to exercise, as this was not systematically available on all patients, consistent with several prior large studies.22 Conventional risk factors were collapsed to a score between 0 and 4, depending on the number of risk factors.14 ,22 The HCM risk-SCD score was calculated through access of the online calculator (doc2do.com/hcm/webHCM.html).14 Eight patients had missing values used for this score and we were therefore unable to complete risk scoring.
Statistical analysis
Categorical variables were represented as percentages, and continuous variables summarised using means, SDs, and medians. The overall risk of aborted SCA was estimated using the Kaplan-Meier method. Potential risk factors for that end point were evaluated using Cox proportional hazards models. The number of covariates examined was restricted to maintain ≥10 events per degree of freedom; therefore echocardiographic covariates were not used with the ECG data for risk prediction. A cut-off value for the T wave amplitude in relation to the appropriate therapy end point was selected using the Contal and O'Qugley method.23 All analysis was completed using SAS V.9.3.
Results
Baseline characteristics
A total of 347 patients with HCM and an implanted ICD were included as the initial study cohort. Of these, (295) were excluded due to: ICD placed elsewhere/no follow-up ICD data available after the index visit (n=212), bundle branch block/paced rhythm (n=48), persistent atrial fibrillation (n=12), known coronary artery disease (n=7) and<8 weeks between ECG and ICD implantation (n=16). Therefore, the final study population was 52 patients. Baseline characteris tics are summarised in table 1 and table 2. Of the 52 patients, 63.5% were men, mean age 50.4±15.8 years and had an average of 1.28 (range 1–3) current SCA risk factors. The average LV wall thickness was 20±6.6 mm. Twelve patients had undergone septal reduction therapy preceding study inclusion, with three performed just prior to ICD implantation. The mean HCM risk-SCD, which identifies risk of SCD at 5 years, was 6.5% (ICD should be considered).
Baseline data
Echocardiographic data
Clinical outcomes
During follow-up (8.5±4.1 years), 16 (30%) patients experienced an aborted SCA event, with nine patients receiving ICD shock and seven ATP therapy for a sustained ventricular arrhythmia. The annual rate of aborted SCA was 1.3% per year. For those that received a shock, 5 were for VF and 4 for VT. Two of these patients did not have EGMs available for review at time of shock. Five patients died during the follow-up period. Three occurred outside institutions and subsequently are unable to identify the underlying cause. One death occurred from coronary disease and another from a stroke.
Repolarisation ECG changes
ECG variables (lead V2 and V5) are summarised in table 3. Figure 2 highlights the average T-wave from all the patients with HCM included and separated by aborted SCA event occurrence. T-wave amplitude was reduced in individuals who experienced an aborted SCA event during follow-up (figure 2). Specifically, in lead V2, T-wave amplitude was 0.34±0.18 mV in those that experienced aborted SCA vs 0.55±0.3 mV in those who did not. In lead V5 a similar pattern was observed with reduced T-wave amplitude in those that experienced an abort SCA event, 0.20±0.14 vs 0.29±0.27 mV. In lead V2 the average QTc of those that experienced events was 427±29 vs 418±35 ms and in lead V5 446±34 vs 432±43 ms.
Means of ECG repolarisation features
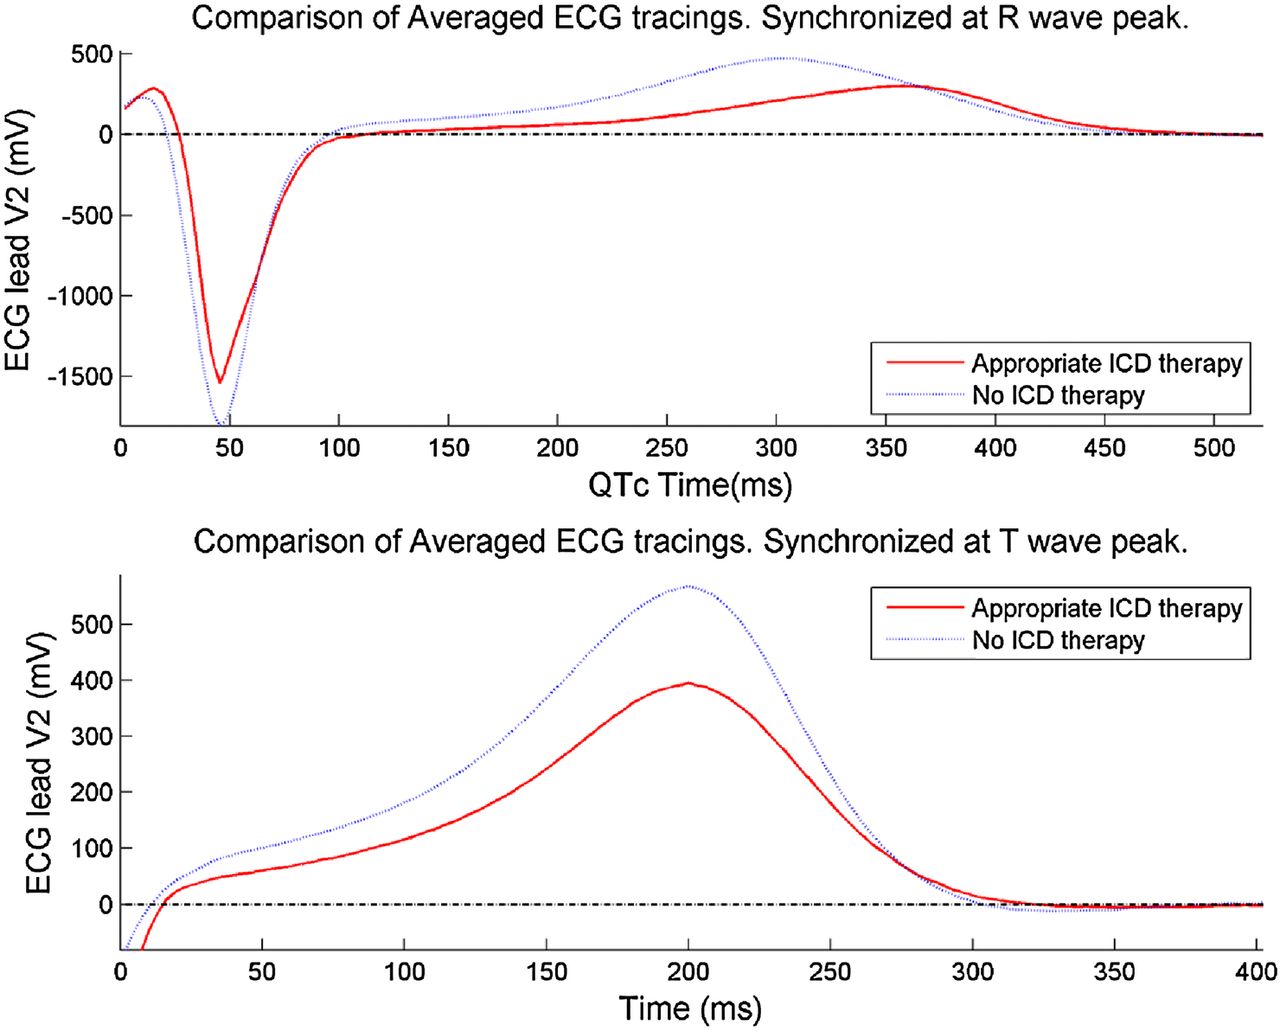
Average ECG tracings of the HCM cohort, separated by appropriate ICD therapy. HCM, hypertrophic cardiomyopathy; ICD, implantable cardioverter defibrillator.
Prediction of SCA
On univariate analysis (table 4), T-wave amplitude in lead V2 was a predictor of aborted SCA (HR per 0.1 mV 0.79, 95% CI 0.56 to 0.96, p=0.02). History of NSVT (HR 3.36, 95% CI 1.00 to 11.35, p=0.05) was also a predictor in our cohort. On multivariate analysis, with a model including the traditional risk score, T-wave amplitude in lead V2 remained an independent predictor of subsequent SCA events (adjusted HR per 0.1 mV 0.74, 95% CI 0.57 to 0.97, p=0.03) (table 5). The T wave amplitude had no impact on the HCM risk-SCD (p=0.26), although data were missing on eight patients. Addition of the T-wave amplitude to the traditional risk factor model improved risk stratification. The C-statistic from the traditional model in our cohort was 0.65, which increased to 0.75 with the addition of the T-wave amplitude. Cumulative event-free survival (figure 3) was worse in patients that had an amplitude<0.36 mV versus >0.36 mV with Kaplan-Meier analysis demonstrating that patients with a lower T-wave amplitude had a worse event-free survival curve (log rank p=0.008).
Univariate analysis
Multivariate analysis

Cumulative event-free survival analysis by T-wave amplitude in lead V2. ICD, implantable cardioverter defibrillator.
Discussion
The major novel finding of this study is that in patients who meet traditional criterion for ICD implantation, T-wave amplitude provides incremental prognostic value in predicting subsequent SCA events. Specifically, in this high-risk population, reduced T-wave amplitude was associated with an increased likelihood of aborted SCA. In addition to current risk stratification tools, T-wave amplitude may add prognostic value in patients with HCM at risk of SCA.
Although the precise mechanism whereby reduced T-wave amplitude translates into increased risk of subsequent SCA events is unclear there is a growing body of evidence that suggests its potential for risk stratification of cardiac arrhythmias in other populations. Shi et al24 assessed a number of conventional and novel-based measures from routine surface ECGs in ICD recipients (mainly ischaemic heart disease, 56%) and reported that reduced T-wave amplitude was associated with device therapy. This is similar to our findings although we are looking at a specific population where T wave changes may be more expected. Moreover, T-wave amplitude has also been shown to differentiate benign versus malignant inferolateral early repolarisation (ER), with reduced T-wave amplitude associated with a more malignant ER.25 There are potential hypotheses behind the reduced T-wave amplitude that require further examination in future studies. In a study by Feldman et al26 T-wave amplitude decreased as the chamber size decreased while another study reported a relationship between reduced T-wave amplitude and LVH.27 Based on this study it was concluded that T amplitude assessment might serve as an early auxiliary marker of repolarisation heterogeneity in hypertension. This may be mechanistically plausible, as it has been shown that those with enlarged LV cavity/mass have a greater preponderance of ventricular arrhythmias—hence, T-wave amplitude could be an indirect marker of this.
Although we do see low mean T-wave amplitude in lead V5 it is unclear exactly why lead V2 was more important in risk prediction. We hypothesise that this is could potentially be related to the fact that this lead faces the septum while lead V5 is more lateral and therefore the septum plays potentially a role in changes to the T-wave amplitude. However, this requires further research and investigation. There have been mixed studies on the associate between QTc and arrhythmic events in HCM and more recently QTc was found not to be an independent predictor of SCD or it surrogates.28 It is unclear why there is so much variation in the data and we hypothesise that it could be related to the fact that myocardial fibrosis and myocyte disarray is not uniform throughout the myocardium and there is regional variation, subsequently the QTc which looks at global repolarisation is unable to detect subtle changes which may vary from lead to lead. This is why examination of T wave repolarisation is important as it may highlight these subtle differences.
While we have identified repolarisation abnormalities in high-risk patients with HCM, we have also shown that addition of T-wave amplitude to the traditional risk factors may improve risk prediction. The C-statistic increased from 0.65 to 0.75 with the addition of T-wave amplitude. The C-statistic for the HCM risk-SCD model has been reported to be 0.7014 with external validation yielding a C-statistic of 0.69.29 Interestingly T-wave amplitude did not augment the HCM risk-SCD model and at baseline this model was not significant in our cohort. We were missing data on eight individuals so this may contributed and this may be reflective regional phenotypic variations in HCM cohorts.30
Clinical implications
In this high-risk population of patients with HCM who meet traditional criterion for ICD implantation, T-wave amplitude provides incremental prognostic value in predicting SCA. Use of repolarisation parameters in addition to traditional risk markers could potentially refine optimal ICD selection and predict the likelihood of appropriate or necessary therapy among ICD recipients. While further validation of our findings is needed, this initial investigation may serve as an impetus for further assessment of surface ECG changes in order to enhance SCA risk stratification. Modern ECG machines are robust with high-resolution to facilitate analyses with minimal technician training, facilitating clinical translation.
Limitations
Our study has several limitations including retrospective analysis in a highly selected high-risk population since it cannot be applied in patients with a ventricular paced rhythm, bundle branch blocks or atrial arrhythmias (an estimated 20%) since these patients by necessity were excluded from our analyses. Given the limited number of events (which in turn limits the variables that can be assessed via multivariate modelling), traditional risk factors were collapsed into a continuous variable, which is suboptimal as it treats each variable as equal. However, this methodology has been previously used in other studies of risk stratification, in particular the approach used in the HCM risk-SCD model.14 ,22 ,31 It is unclear the impact the selection of our population may have on the calculated repolarisation changes and further studies need to examine the correlation between repolarisation changes and the severity of disease finally, we did not specifically control for multiple testing within this study therefore further studies should evaluate these repolarisation changes.
Conclusion
In selected patients with HCM, repolarisation abnormalities, namely T-wave amplitude, may provide incremental prognostic information, in addition to traditional risk factors. Further studies are needed to understand the mechanism whereby these changes may underlie risk of ventricular arrhythmias as well as the study of these changes in the general HCM population.
References
Footnotes
Funding CVD is supported by an NIH T32 training grant HL 007111. VK is supported by funding from Czech Science Foundation GACR number P103/11/P106. ACC is supported by the Translational Science Award Grant Number UL1TR000135, supporting the Mayo Clinic Center for Clinical and Translational Science (CCaTS), from the National Center for Advancing Translational Sciences (NCATS), a component of NIH and the American Heart Association (Award Number 17POST33400211).
Competing interests None declared.
Ethics approval Mayo Clinic IRB Committee.
Provenance and peer review Not commissioned; internally peer reviewed.
Data sharing statement Any requests for data sharing should be made to the corresponding author.