Article Text

Abstract
Objective: To assess a new multislice computed tomography (CT) technique for three dimensional quantification of aortic valve calcification volume (3D AVCV) and to study the relation between stenosis and calcification of the aortic valve.
Methods: 50 patients with echocardiographic calcification of the aortic valve underwent two separate ECG triggered multislice CT for quantification of 3D AVCV. The agreement between the two 3D AVCV scores was assessed and 3D AVCV was compared with echocardiographic markers of severity of aortic stenosis.
Results: Overall the level of agreement between the two 3D AVCV scores was excellent (median interscan variability 7.9% (interquartile range 10.1); correlation coefficient, r = 0.99; repeatability coefficient 237.8 mm3 (limits of agreement −393 to 559 mm3)). However, the magnitude of the 3D AVCV did influence the interscan variability. The 3D AVCV correlated closely with the maximal predicted transvalvar gradient (r2 = 0.77) and aortic valve area (r2 = 0.73).
Conclusions: Multislice CT provides a technique for quantifying 3D AVCV that has good reproducibility. There is a close non-linear relation between echocardiographic parameters of severity of valve stenosis and 3D AVCV scores.
- aortic valve
- calcium
- computed tomography
- 3D AVCV, three dimensional quantification of aortic valve calcification volume
- AVA, aortic valve area
- AVC, aortic valve calcification
- CT, computed tomography
Statistics from Altmetric.com
- 3D AVCV, three dimensional quantification of aortic valve calcification volume
- AVA, aortic valve area
- AVC, aortic valve calcification
- CT, computed tomography
There is growing interest in the use of computed tomography (CT) for the detection and quantification of aortic valve calcification (AVC). Detection and accurate quantification of AVC may be important for diagnostic, prognostic, and research applications. Certainly a spectrum of degrees of AVC is seen in severe asymptomatic aortic stenosis and those with the most AVC have the worst prognosis.1 In view of the observation that AVC occurs in areas of lipoprotein deposition, electron beam CT has been used to evaluate the effects of lipid lowering treatments in aortic stenosis.2,3 Electron beam CT has also been used to evaluate cusp calcification in prosthetic aortic valves.4 For CT quantification of AVC to be accepted as a useful research and clinical technique it must be available and reproducible, and the relation between AVC and haemodynamic parameters of aortic valve stenosis should be defined. Recently, multislice CT has emerged as a cardiac imaging tool that compares favourably with electron beam CT and has the added advantage of widespread availability.5–11 The objective of this study was to assess multislice CT for the quantification of AVC and to investigate further the relation between stenosis and calcification of the aortic valve.
METHODS
Study population
Fifty patients attending a regional cardiothoracic centre for aortic valve evaluation were investigated (26 men, mean (SD) age 72 (8) years, mean body mass index (kg/m2) 30 (4)). Patients known to have or found to have echocardiographic evidence of calcification of a native tricuspid aortic valve were invited to take part in the study, along with patients listed for aortic valve replacement for degenerative calcific aortic stenosis. Patients were included only if the nature of their aortic stenosis was presumed to be degenerative. Echocardiography was performed in a prospective fashion by experienced cardiac technicians using an Acuson Sequoia C256 echocardiography system (Acuson, Mountain View, California, USA). The maximum transaortic velocity was calculated as the mean of three recordings taken from the apex using continuous wave Doppler. Similarly, the subaortic velocity was recorded three times using pulsed wave Doppler from the apex in a five chamber view. The left ventricular outflow tract diameter was measured from inner edge to inner edge at the level of the base of the aortic valve cusps on a parasternal long axis systolic frame. The maximum predicted gradient across the aortic valve was recorded and the aortic valve area (AVA) was calculated using the continuity equation.12 Consecutive patients were approached until the scanning slots were filled. Inclusion criteria were age > 50 years and willingness to take part in the study. Excluded were patients with permanent pacemaker or prosthetic valve implants and patients with renal insufficiency (serum creatinine > 200 mmol/l). The local research ethics committee gave ethical approval for the study, all patients gave written informed consent, and all procedures followed were in accordance with institutional guidelines.
Multislice CT acquisition
All scans were performed with a multislice CT scanner (Mx-8000, Philips Medical Systems, Cleveland, Ohio, USA). The acquisition protocol was adapted from techniques previously described for quantifying coronary artery calcium with multislice CT using prospective ECG triggering in sequential mode.9 Patients were positioned supine, feet first. For prospective ECG triggering the ECG was recorded continuously throughout the preparation and image acquisition period. The trigger point was set at 60% of the expected next RR interval. This was calculated on the basis of the three preceding RR intervals. Firstly, a coronal scout view was performed for positioning of the image volume, which extended from below the carina to the apex of the heart. The scans were then conducted with held inspiration and no prior hyperventilation in view of the relatively short scan time (universally < 20 seconds). Contiguous non-overlapping slices were acquired in a craniocaudal direction using 120 kV and 250 mAs/slice with a collimation of 4 × 2.5 mm, 500 ms gantry rotation. The field of view was restricted to 180 mm. To assess two multislice CT aortic valve measurements for agreement, a second CT scan was then repeated after five minutes with identical parameters to the first scan. The patients were stood up and repositioned between scans. The total estimated effective radiation dose per CT scan was measured at 3.0 mSv (ImPACT CT Patient Dosimetry Calculator, St Georges Hospital, Tooting, London, UK).
Quantification of AVC
Acquired images were transferred to a workstation with dedicated software for calcium scoring and three dimensional analysis (Mx View, Philips Medical Systems). Images were evaluated by the consensus of two investigators blinded to the echocardiographic findings. A third investigator was available in case of disagreement. The technique used for quantifying AVC was adapted from electron beam CT coronary artery calcium quantification. The method used was based on isotropic interpolation to determine the total calcified volume and as such mimics the technique described by Callister and colleagues.13 A three dimensional application was used to set a lower threshold for tissue isolation of 130 Hounsfield units, occupying a minimum area of 0.5 mm2 (to avoid confusion with image “noise”). The threshold was determined based on the highlighted centre and window according to the formula: lower threshold = highlighted centre − [highlighted window/2]. Any tissue above this threshold was then identified by the application software and highlighted. Depending on the pattern and severity of the AVC, one or more regions of interest were then placed within the highlighted areas chosen to represent AVC. This process was repeated for every reconstructed transaxial section. Calcification was attributed to the aortic valve if it was clearly part of the valve cusps. Calcification of the aorta and coronary arteries including the ostia was not included. The only exception to this was any calcification of the aorta immediately adjacent to and in continuity with the valve cusps. The previously identified region or regions of interest were then isolated, and the volume of tissue that was isolated represented the AVC volume. Three dimensional quantification of the aortic valve calcification volume (3D AVCV) was visualised using a shaded surface display (fig 1). The 3D AVCV (in mm3) was calculated on the workstation software by a process dependent on isotropic interpolation. This process allows modification of the contribution of a single voxel to the total volume dependent on information taken from adjacent image slices, and so reduces partial volume errors.
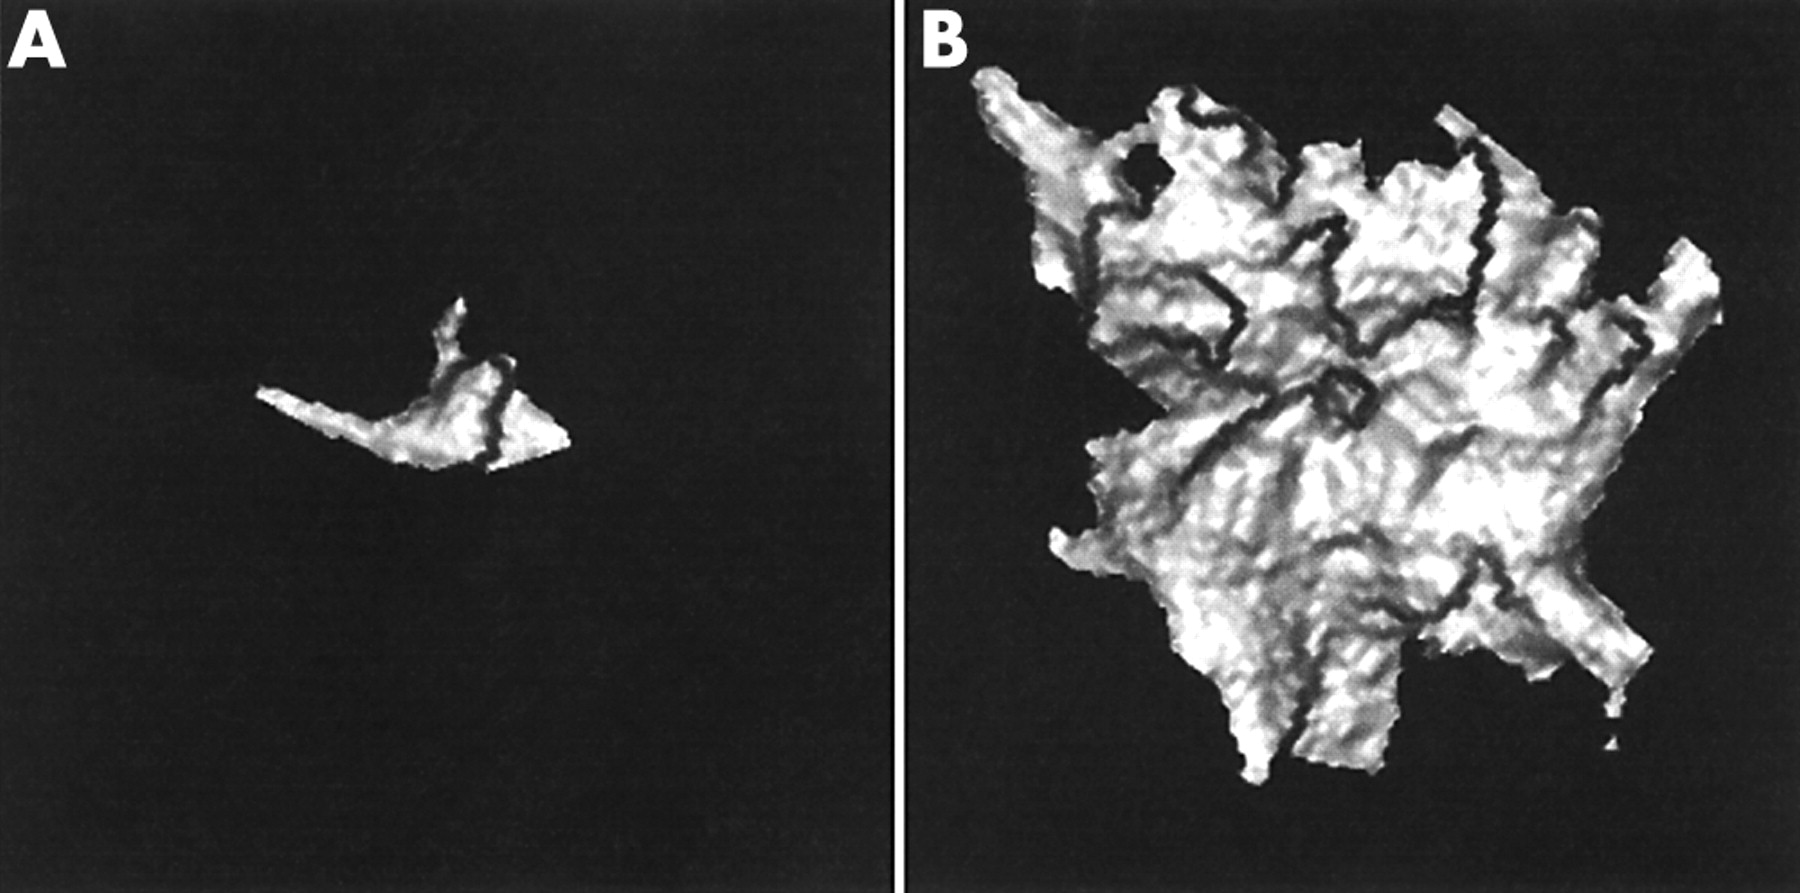
Three dimensional quantification of aortic valve calcification volume (3D AVCV) of aortic valves from two patients viewed in oblique axial orientation. (A) Mild calcification of the left coronary cusp (3D AVCV 74 mm3, aortic valve area 2.4 cm2). (B) Severe calcification (3D AVCV 5044 mm3, aortic valve area 0.4 cm2).
Statistical analysis
Statistical analysis was carried out using a PC based computer program (SPSS, version 10.0, SPSS Inc, Chicago, Illinois, USA). Interscan variability for the two 3D AVCV scores was determined. This was the absolute difference of the two volumes divided by the mean of the two volumes, expressed as a percentage. The reproducibility of the test was assessed after the method of Bland and Altman.14 The distribution of the interscan variability was then evaluated in terms of magnitude of the valvar calcification. The correlation coefficient between 3D AVCV and echocardiographic parameters (gradient and AVA) of severity of valvar stenosis was calculated.
RESULTS
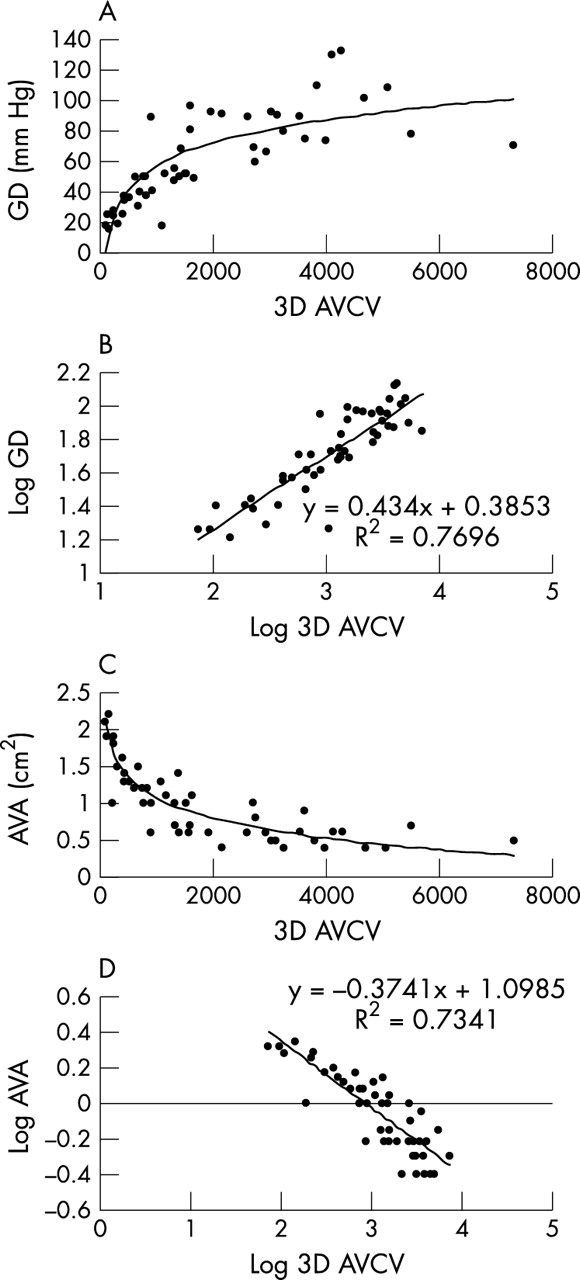
Patients with a spectrum of degrees of severity of aortic stenosis (in 27, AVA was ie, “AVA was ⩾ 1.0 cm2” 1.0 cm2; in 23, AVA was < 1.0 cm2) and heart rates (mean 70 beats/min, range 44–101 beats/min) were included in the study. All patients underwent two prospectively triggered multislice CT scans and there were no complications. The 3D AVCV ranged from 74 mm3 to 7320 mm3. The overall median interscan variability was 7.9% (interquartile range 10.1) for the two 3D AVCV quantifications. Correlation between the two volumes was excellent (r = 0.99). Good reproducibility for the test was shown (repeatability coefficient 237.8 mm3, limits of agreement −393 to 559 mm3; fig 2). However, further analysis showed that the interscan variability was influenced by the actual quantity of the 3D AVCV. Whereas variability was optimal (< 10%) at 3D AVCV greater than 800 mm3, it was suboptimal (10–20%) when there was less aortic valve calcium (< 800 mm3). The 3D AVCV was closely correlated with severity of valvar stenosis in a non-linear relation (fig 3). After log transformation to correct for non-normality, the relations between 3D AVCV and gradient (r2 = 0.77; fig 3B) and between 3D AVCV and AVA (r2 = 0.73; fig 3D) were highly significant (p < 0.0001 for both).

Bland-Altman diagram showing the relation between mean 3D AVCV (in mm3) and the difference between the first 3D AVCV and the second 3D AVCV. The mean difference (dotted line) and limits of agreement, which represent twofold the standard deviation of the mean difference (solid line), are shown.

Relation between 3D AVCV (mm3) and severity of aortic valve stenosis, as determined by (A) echocardiographically derived maximal aortic valve gradient (GD) and (C) continuity equation derived aortic valve area (AVA). The relations are non-linear. 3D AVCV, GD, and valve area datasets were log transformed to correct for non-normality, and the resultant linear correlations with r2 values are shown (B and D) (p < 0.00001 for both correlations).
DISCUSSION
AVC has been quantified with echocardiography but the technique is dependent on subjective assessment.1 In contrast, CT is highly sensitive for the evaluation of intracardiac calcium and AVC has been objectively quantified with electron beam CT with good reproducibility of the technique shown in over 100 patients.2,15,16 These studies, conducted retrospectively on CT scans from patients undergoing quantification of coronary artery calcium, have estimated median interscan variability at between 6–7%.2,16. In the absence of data concerning the reproducibility of multislice CT AVC quantification, the results from our study must be compared with the existing electron beam CT data. We have shown that multislice CT permits 3D AVCV with an overall median interscan reproducibility (7.9%) comparable with that found with electron beam CT. For patients with AVC that was moderate (> 800 mm3) or worse, the median interscan variability was very low, at around 5%. Pohle and colleagues2 suggested that the magnitude of the AVC had a significant influence on the interscan variability, with median interscan variability’s of > 10% in the lowest tercile of AVC scores. Although the group of patients included in our study were more heterogeneous than those studied by Pohle and colleagues,2 a similar trend is seen. Much higher median interscan variabilities were found with less AVC (< 800 mm3). This finding is relevant to the future evaluation of medical treatments for patients with aortic stenosis and mild AVC.
Despite the apparent independence of aortic stenosis progression from actual cholesterol concentrations, several studies have now suggested that lipid lowering treatment may slow the progression of the valvar lesion of aortic stenosis.2,3,17,18 Two of these studies have used electron beam CT quantification of AVC to follow up disease progression, without separate haemodynamic assessment.2,3 While the overall reproducibility of the technique described suggests that multislice CT is eminently suitable for following up AVC, the higher degree of interscan variability when the valvar calcification is mild should be borne in mind. In assessment of the technique of CT AVC quantification, the relation between the stenosis and calcification of the aortic valve is of crucial importance. A linear correlation been suggested.19 However, the overgrowth of calcium seen in aortic stenosis may increasingly progress as the valvar orifice narrows. Comparison of CT quantification of AVC with echocardiographic parameters of severity of valvar stenosis allows study of this relation. Use of these two imaging modalities shows a strong relation between AVC and stenosis of the aortic valve (fig 3). The strength of this relation adds weight to the argument in favour of using CT calcification quantification for the assessment of progression of the valve lesion in the evaluation of medical treatment in aortic stenosis. However, the relation is clearly non-linear. As can be seen from the data illustrated in fig 3, calcification of the valve increases initially at a relatively constant rate in proportion to worsening echocardiographic parameters of valvar function. However, as the gradient increases or AVA decreases, both the severity and the spectrum of AVC increase dramatically, findings that are implied by previous echocardiographic studies.1 Once the AVA is < 1.0 cm2, patients with similar degrees of stenosis of the aortic valve may have very different levels of valvar calcification. This diversity in the AVC volumes found in patients with severe aortic stenosis is important.
Selection of those patients with severe, asymptomatic aortic stenosis who may benefit from early surgery remains a clinical challenge. Accurate quantification of 3D AVCV may aid selection of these patients, as moderate or severe valve calcification has been shown to define a high risk subgroup.1 Furthermore, although we have not included coronary artery calcification as part of our analysis, this information is available from the same multislice CT scan. Multislice CT, for the simultaneous quantification of both 3D AVCV and coronary artery calcification, has undoubted potential as a prognostic tool in severe, asymptomatic aortic stenosis.
Quantification, and not CT detection, of AVC was the focus of this study. Patients with even the mildest AVC, identified by echocardiography, were included. While caution should be exercised in interpreting the 3D AVCV as actual “volumes” of calcium, it is interesting to note that the lowest 3D AVCV, found in a patient with AVC just perceptible on echocardiography, was 74 mm3. Much smaller volumes of AVC than this can be identified with multislice CT and, bearing in mind the adverse prognosis conferred by the finding of aortic “sclerosis”, CT provides the potential for early diagnosis.20 However, although it is likely that multislice CT would provide a sensitive screening tool for identification and subsequent quantification of early AVC, this cannot be assumed from our data.
Study limitations
The interscan variability may have been affected by acquisition, reconstruction, or patient factors. Higher interscan variability in patients with low to moderate calcium scores is a well recognised phenomenon from coronary artery calcium scoring. Partial volume errors are more pronounced for small lesions, and the non-overlapping slice acquisition we used may have contributed to our finding of higher interscan variability when the 3D AVCV score was < 800 mm3. The most appropriate acquisition mode for the quantification of intracardiac calcification with multislice CT remains under evaluation. Experimental data for the assessment of intracardiac calcium suggest that multislice CT, with retrospective gating, may reduce interscan variability in comparison with both prospectively triggered multislice and electron beam CT.21 However, we elected to use a prospectively triggered multislice CT acquisition protocol that has been extensively evaluated for coronary artery calcification and correlates well with electron beam CT.9 In contrast, the method of 3D AVCV quantification with multislice CT has not, to our knowledge, been evaluated previously. Clinical data have suggested that the volumetric scoring method for coronary artery calcium assessment is preferable, offering reduced interscan variability.13 The technique described has the added advantage of allowing visualisation of a three dimensional model of the valve calcification (fig 1), which may be of potential diagnostic assistance. The lack of published data on multislice CT AVC assessment has necessitated comparison with the available electron beam CT data, and the techniques have intrinsic differences. However, this lack of data will surely change, as multislice CT is by far the more available technique, and it is likely that the close correlation between the two CT modalities for coronary artery calcium assessment will be mirrored for AVC assessment.
Conclusion
This study shows that multislice CT provides three dimensional quantification of AVC and the technique has been shown to be reproducible. Comparison with echocardiographic data has permitted insights into the important relation between stenosis and calcification of the aortic valve. It has also allowed a preliminary evaluation of multislice CT 3D AVCV as a clinical and research tool. Further research assessing the clinical utility of this readily available technique is required.
Acknowledgments
We thank the technical staff of the cardiology and radiology departments at Plymouth NHS Trust for their help with this study.