Article Text

Abstract
Context: Short-term fluctuations in air pollution have been associated with changes in both overall and cardiovascular mortality.
Objective: To consider the effects of air pollution on myocardial infarction (MI) risk by systematically reviewing studies looking at this specific outcome.
Data sources: Medline, Embase and TOXNET publication databases, as well as reference lists and the websites of relevant public organisations.
Study selection: Studies presenting original data with MI as a specific outcome and one or more of the following as an exposure of interest were included: particulate matter (PM), black carbon/black smoke, ozone, carbon monoxide, nitrogen oxides, sulphur dioxide and traffic exposure.
Data extraction: The effects of each pollutant on risk of MI, including effect sizes and confidence intervals, were recorded where possible. Methodological details were also extracted including study population, location and setting, ascertainment of MI events, adjustment for potential confounders and consideration of lagged effects.
Results: 26 studies were identified: 19 looked at the short-term effects of pollution on a daily timescale; the remaining 7 at longer-term effects. A proportion of studies reported statistically significant detrimental effects of PM with diameter <2.5 µm (3/5 studies, risk increase estimates ranging from 5 to 17% per 10 µg/m3 increase), PM <10 µm (3/10, 0.7–11% per 10 µg/m3), CO (6/14, 2–4% per ppm), SO2 (6/13, effect estimates on varied scales) and NO2 (6/13, 1–9% per 10 ppb). Increasing ozone levels were associated with a reduction in MI risk in 3/12 studies. A number of differences in location, population and demographics and study methodology between studies were identified that might have affected results.
Conclusion: There is some evidence that short-term fluctuations in air pollution affect the risk of MI. However, further studies are needed to clarify the nature of these effects and identify vulnerable populations and individuals.
Statistics from Altmetric.com
There has been considerable interest in recent years in the health effects of exposure to both short-term fluctuations and long-term levels of air pollution, in particular common environmental pollutants including particulate matter (PM), ozone (O3), carbon monoxide (CO), nitrogen dioxide (NO2) and sulphur dioxide (SO2). Early time-series studies demonstrated an effect of short-term changes in the levels of pollutants, in particular PM, on overall mortality in both the USA1 and Europe.2 Two noteworthy prospective cohort studies also reported that mortality risk was increased by up to 26% for people living in cities with the highest mean pollution levels, after adjusting for individual risk factors such as smoking.3 4
More specific outcomes have also been investigated, and studies of cardiovascular mortality and morbidities, including ischaemic heart disease, have suggested that both day-to-day changes in pollutant levels5 6 and longer-term exposure7 8 may affect risk. A statement from the American Heart Association concluded that short-term increases in PM levels led to corresponding increases in cardiovascular mortality, and in hospital admissions for several cardiovascular diseases.9 A major review of the epidemiological evidence on air pollution and cardiovascular disease conducted for the UK Department of Health went further, stating in particular that “a large number of time-series studies show very clearly that, with few exceptions, all of the commonly measured pollutants (particles, ozone, sulphur dioxide, nitrogen dioxide and carbon monoxide) are positively associated with increased mortality and hospital admissions for cardiovascular disease”.10 While an effect of air pollution on cardiovascular mortality and hospital admissions is to some extent established, the association between exposure to air pollution and risk of myocardial infarction (MI) is less clear.
The aim of this study was to systematically review the evidence concerning air pollution effects on the risk of MI. We hypothesised that increases in PM, O3, CO, NO2 and SO2 levels would be associated with both short- and long-term increases in MI risk. To our knowledge no systematic review to date has focused on this specific outcome. Clarifying the effects of air pollution on MI is of particular interest, not only to aid the assessment of the likely burden to acute care facilities associated with changes in pollution levels but also to clarify whether MI is a major contributor to the increases in broader cardiovascular outcomes that have been associated with pollution, and thus to further our understanding of pathways and pathological mechanisms by which air pollution impacts on health.
Methods
Databases and sources
We searched Medline (1950 to present) and Embase, as well as TOXNET, a bibliographic database specialising in toxicology literature. Reference lists of all relevant studies were scanned to identify any further studies, and if these revealed that search terms had been missed, extra terms were added to the main database searches. The searches were performed by a statistician/epidemiologist (KB), initially in July 2008, with the main database searches updated in May 2009. We also searched the websites of the following organisations for relevant reports and reviews: World Health Organization; European Union; Health Effects Institute (USA); Environmental Protection Agency (USA); National Institutes of Health (USA); Department of Health (UK); Department for Environment, Food and Rural Affairs (UK). Conference abstracts and unpublished studies were not included in this review.
Search keywords and terms
Our search of Medline (via OvidSP) and TOXNET used the following MeSH keywords: (“air pollution” or “air pollutants” or “ozone” or “carbon monoxide” or “sulfur dioxide” or “particulate matter” or “nitrogen oxides” or “environmental exposure”) and “myocardial infarction” and “humans” not (“tobacco smoke pollution”). All subterms were also included and we limited the search to studies of adult humans, published in English. For Embase, which does not use the MeSH classification system, we used the nearest equivalent search terms from the Embase indexing system.
In order to identify studies in which air pollution effects on MI were reported as specific secondary outcomes within a broader study, we performed a secondary Medline search, as above but using the broader MeSH term “cardiovascular diseases” in place of “myocardial infarction”; we then limited the results to reports where “myocardial infarction” or an equivalent term was present in the title, abstract, or keywords (equivalent terms were defined as “myocardial infarct*”, “coronary event”, “heart attack”, “Q wave infarct*”, “Non-Q wave infarct*”, “STEMI”, “coronary infarct*”, “heart infarct*”, “myocardial thrombosis”, or “coronary thrombosis”, where “*” indicates any word ending).
Inclusion and exclusion criteria
To examine the hypothesis that ambient air pollutant exposure would be associated with MI risk, studies of any relevant design were included if they presented original data, and included at least one analysis where MI was the specific outcome, and one or more of the following exposures were investigated: PM or black carbon/black smoke, ozone, carbon monoxide, any oxide of nitrogen, or sulphur dioxide. Studies using exposure to traffic as a proxy were also included. We excluded studies in which the authors did not control for (or stratify by) any potential confounding factors, or did not report measures of precision or p values for the analysis of interest
Procedure
Titles and abstracts were screened for relevance, and full-text versions obtained where appropriate for assessment with reference to the inclusion and exclusion criteria; we were able to obtain full-text papers in all cases where required and it was not necessary to contact specific authors. For each study included, the following information was recorded based on prior beliefs about key aspects of study methodology and in order to summarise study quality: study population, event of interest, number included, age range included, location and setting, time period, exposure variables, ascertainment of MI, spatial resolution, temporal resolution, adjustment for weather variables and other potential confounders, lags considered. The main results of each study were also recorded—in particular, the effects of each pollutant of interest on risk of MI, including effect sizes and confidence intervals where possible. Where authors reported several relevant results (eg, for different lag days, or for different subgroups), we chose results from the main or final model if such a model could be identified, or else from the analysis on which the authors focused or that which best represented the overall conclusions of the study, noting any important differences in the effect estimates between different analyses. Finally, effect estimates and their confidence intervals were standardised, where possible, to aid comparison; effect estimates for PM10 and PM2.5 were converted to “per 10 μg/m3”, estimates for O3, NO2 and SO2 were converted to “per 10 ppb” or “per 10 μg/m3”, and estimates for CO were converted to “per ppm”, or “per mg/m3”
Results
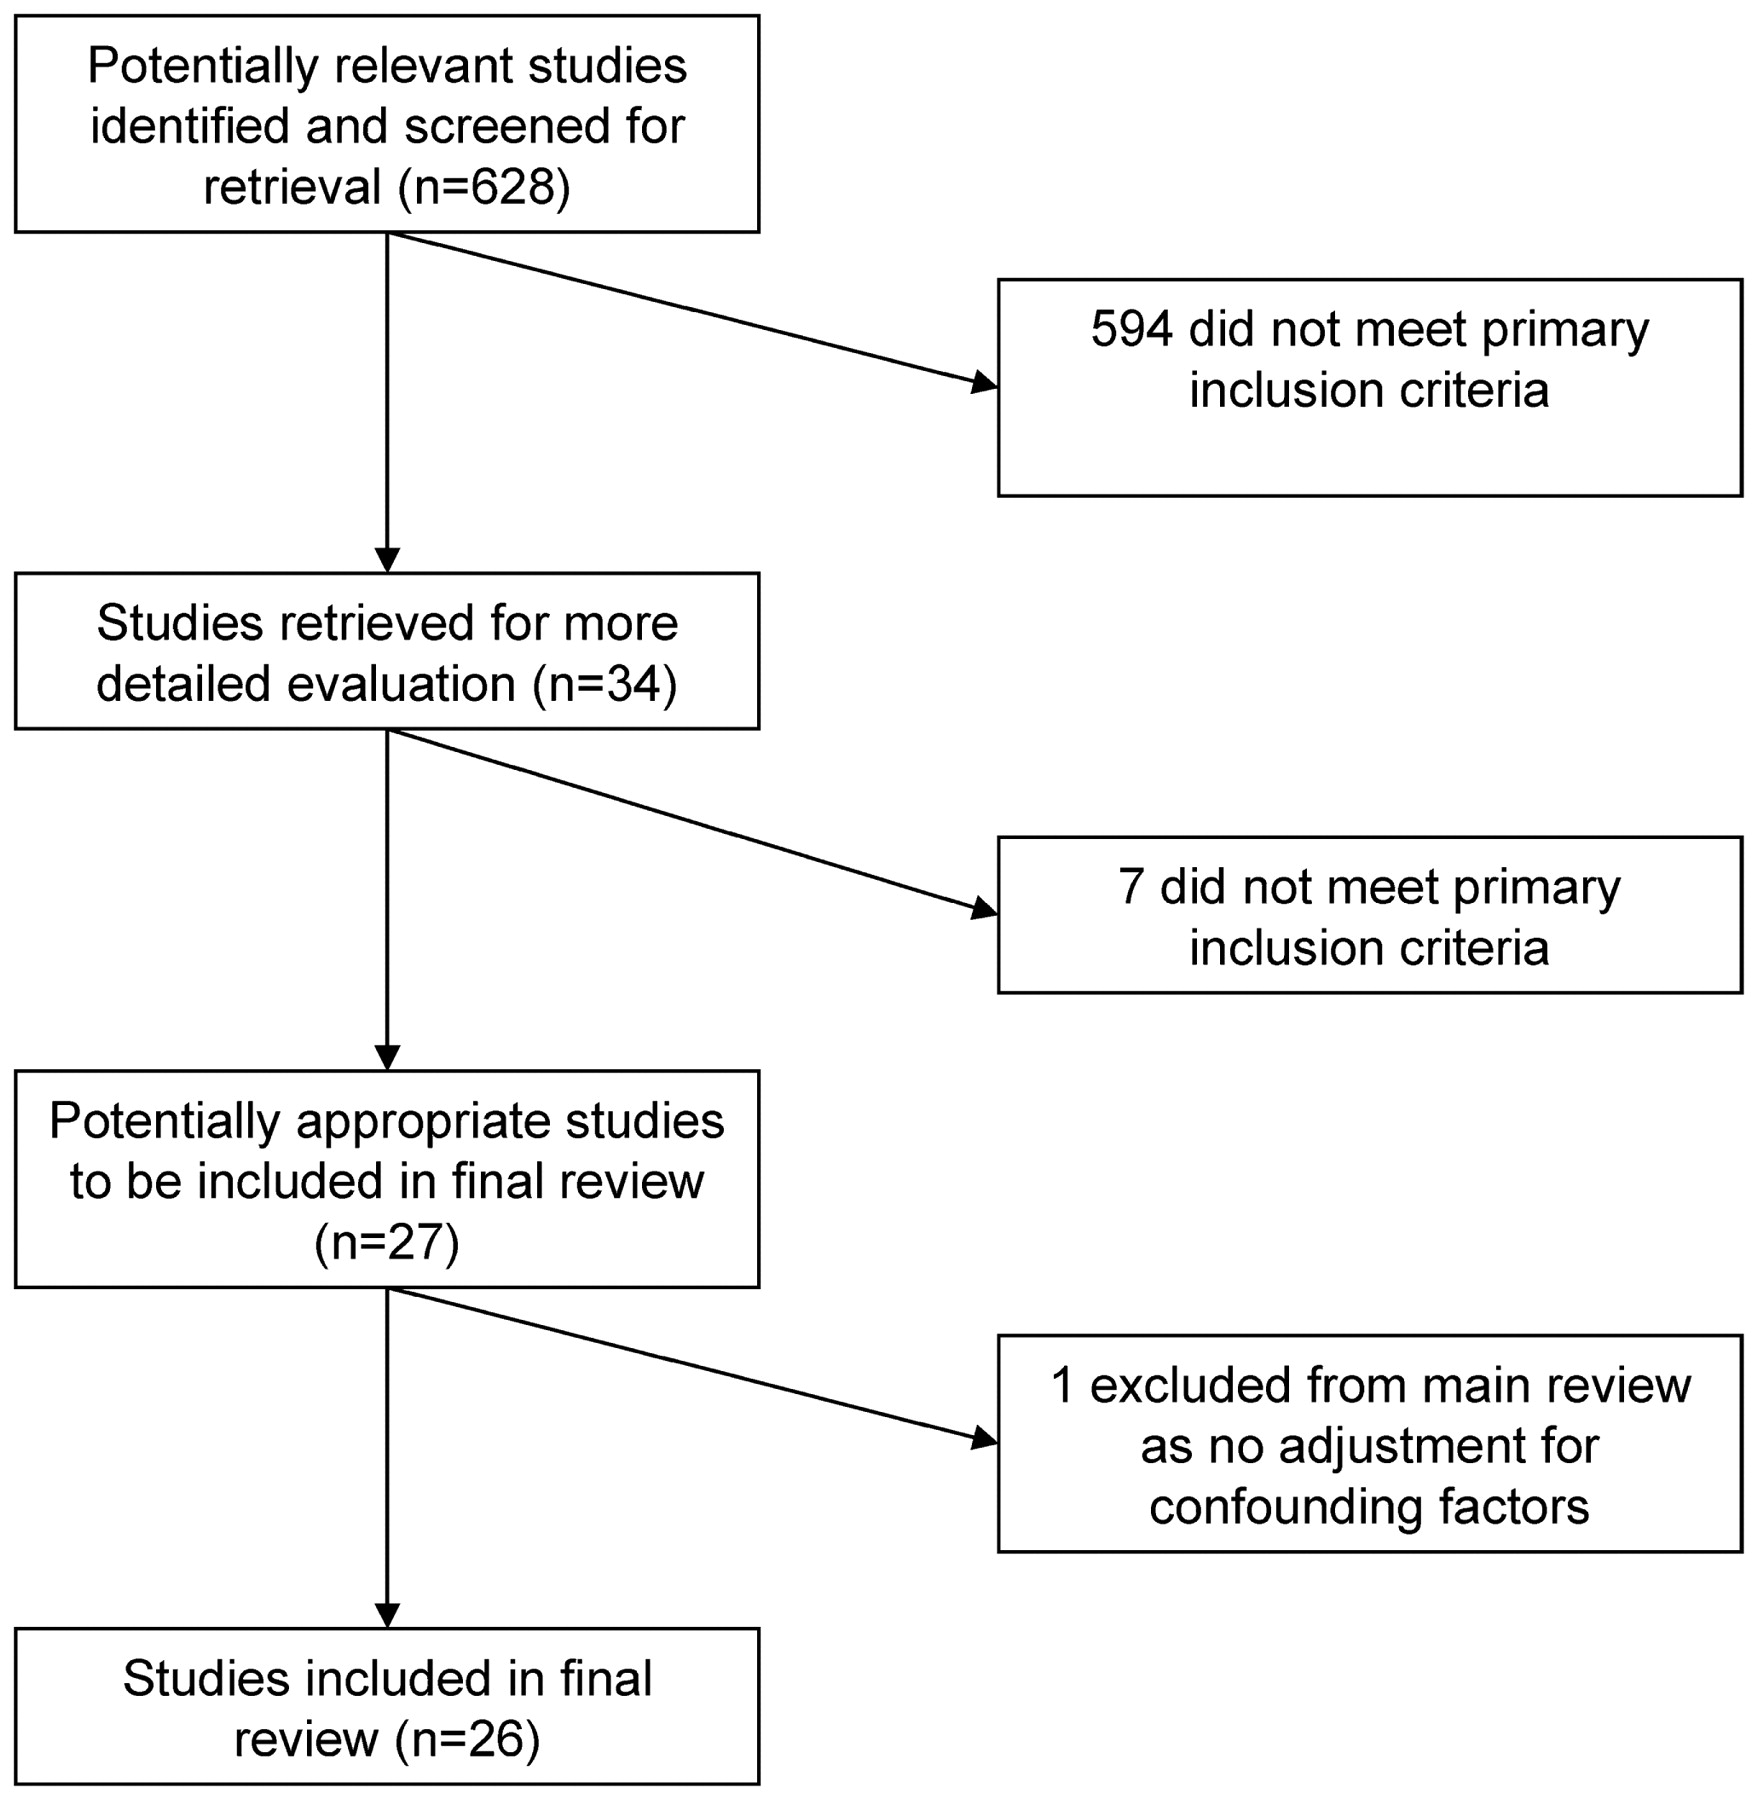
A total of 27 studies met the inclusion criteria; however, one was excluded because only a basic analysis was performed with no consideration of potential confounding factors, leaving 26 in the final review (fig 1).

Flow diagram of search strategy.
The majority of studies (n = 19) were concerned with identifying short-term associations between air pollution exposures and MI risk (tables 1–3).5 11 12 13 14 15 16 17 18 19 20 21 22 23 24 25 26 27 28 A further seven studies looked at the longer-term effects of air pollution on MI risk (table 4).29 30 31 32 33 34 35
Daily time-series studies with air pollution exposures and myocardial infarction (MI) outcomes: description of studies
Daily time-series studies with air pollution exposures and myocardial infarction (MI) outcomes: summary interpretation
Daily time-series studies with air pollution exposures and myocardial (MI) outcomes: study results details
Studies of long-term effects of air pollution on myocardial infarction (MI) outcomes
Short-term effects of air pollution
Among the 19 studies that we identified which looked at the short-term effects of air pollution on MI risk, a number of specific pollutants were investigated, the most common being particles with diameter <10 μm (PM10, 10 studies), particles with diameter <2.5 μm (PM2.5, 5 studies), O3 (12 studies), CO (14 studies), NO2 (13 studies) and SO2 (10 studies). The number of individual pollutants investigated by a single study ranged from 1 to 8. The design of the studies fell into two categories: 10 were analyses of daily time-series data, while the remaining nine used case-crossover designs.
Study designs and methodological considerations
Both time-series and case-crossover study designs are based solely on data from subjects who have experienced the event of interest (in this case, MI). Briefly, time-series studies typically take as their outcome the daily number of events in a defined region, and a regression analysis is performed to relate these daily counts to explanatory variables (in this case, daily pollutant levels) and potential confounders. A case-crossover study can be thought of as a kind of self-matched case–control study. For each individual, exposure data are collected for the “hazard” period (usually the period immediately before the MI) and for a “control” period which was not associated with the event of interest.
Air pollutant data originated from monitoring stations and were most commonly recorded as 24 h averages, though 8 h averages were also frequently used (table 1). One study by Peters et al used traffic exposure as the exposure of interest and this was ascertained from diary data.26 MI data came from more varied sources. Three studies looked exclusively at MI deaths, and used death registry and vital statistics data to identify cases. The rest included data on both fatal and non-fatal MI events. The majority identified MI cases through hospital admissions records (eight studies), while the remainder used data from other hospital records (three), MI registers (three) and other databases (two). Six studies, with access to symptom, ECG and biomarker records, validated potential MI events using specific diagnostic criteria.
Key potential confounders and the possibility of delayed effects were dealt with fairly consistently across studies. In case-crossover studies, confounding by season, long-term trend, and factors which do not vary over the short term, is dealt with by design. The majority of time-series studies included also adjusted for season and long-term trend, as well as temperature, which is a potential confounder since temperature may be associated with both pollution levels and MI risk. However, the specific way in which authors adjusted for temperature varied; while a few studies allowed for both non-linearity of the temperature effect and for delayed (lagged) temperature effects over a number of days, others performed only a more basic adjustment (table 1). Lagged effects of air pollution itself were included in all studies; in most cases both immediate (same day) effects and a number of different lags were considered.
Effects of particulate pollutants
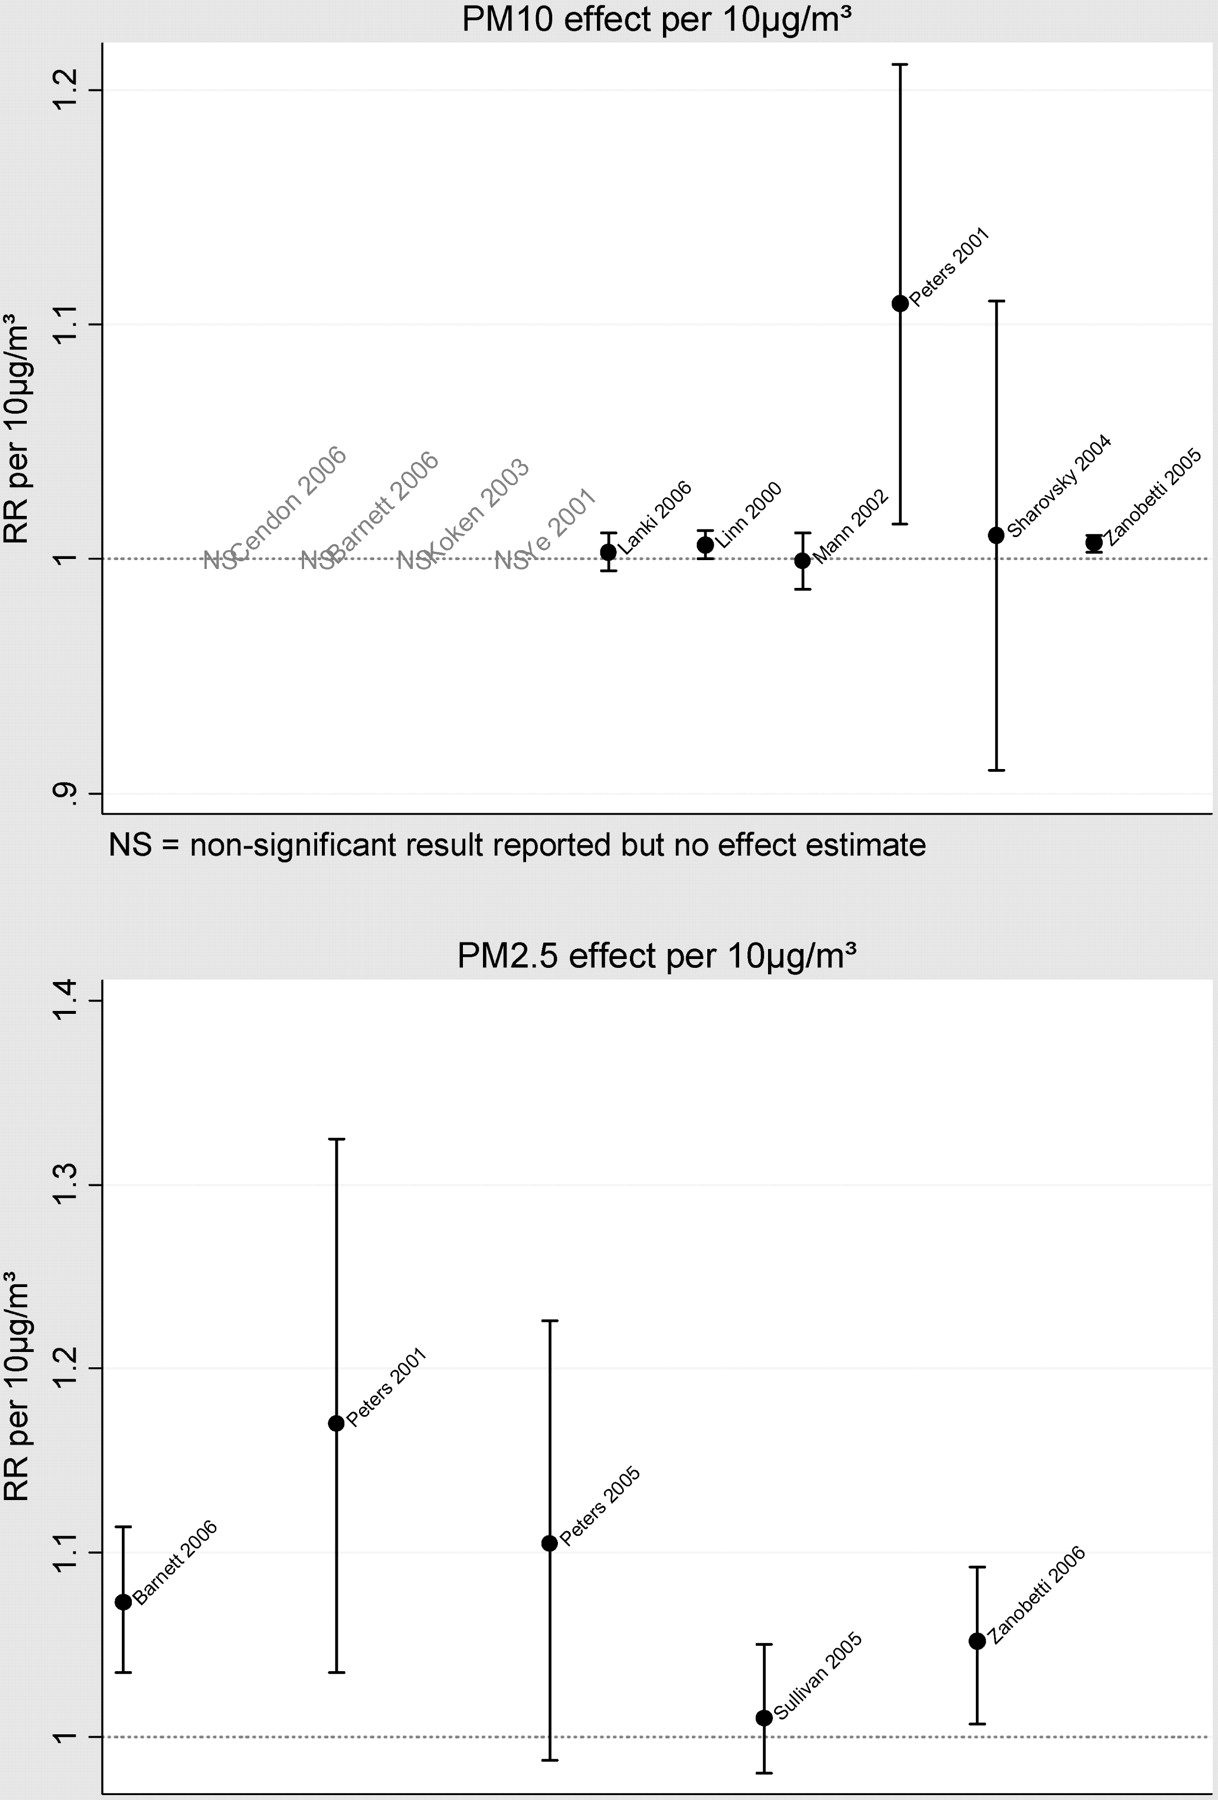
Of 10 studies investigating the effects of PM10 on MI risk, seven found no effect at all (tables 2–3, fig 2). The authors of a US study in a population aged ⩾65 years estimated a 0.65% increase in MI admissions on the same day as a 10 μg/m3 increase in PM10 (95% CI 0.3% to 1.0%).25 A second study reported an effect of similar size for a study population with no age restriction.15 However, the Onset Study, which used admissions records from a Boston coronary care unit and analysed data hourly, found a considerably larger effect: their estimate implied an 11% increase in risk for a 10 μg/m3 increase in PM10 1 h earlier.28 This larger effect was not only observed at the hourly timescale; the same authors also found a large and statistically significant effect at a daily resolution, in contrast with the lack of effect found by most studies.

Estimate effects of particulate pollution on myocardial infarction risk. PM, particulate matter; RR, relative risk.
PM2.5 was included as an exposure of interest in five studies, all of which were of a case-crossover design. Three of the five studies reported that PM2.5 significantly increased the risk of MI. Effect sizes of 5–7% per 10 μg/m3 increase were estimated in two studies using a daily timescale for analysis,20 21 a third found no effect overall.22 These effects were observed between 0 and 2 days after a change in PM2.5 levels. A few studies were able to analyse data at an hourly resolution, with two finding no effect of PM2.5 on this timescale.22 24 As with PM10, results from the Onset Study were contrasting: the authors estimated a 17% increase in risk 2 h after a 10 μg/m3 increase in PM2.5.28
Other particulate exposures were investigated in some studies. Of note, two studies looking at proxies for ultrafine particles found no effect on MI risk.12 22 On the other hand, total suspended particulate was included as an exposure in three studies, and all reported a significant association with MI, either on the same day,17 27 or with some delay.19
Effects of gaseous pollutants
Ambient ozone was investigated as a risk factor for MI by 12 studies, only one of which reported a detrimental effect, with MI admissions to intensive care units increasing on days with higher ambient ozone.11 More common were studies reporting a protective effect of ozone (tables 2–3, fig 3). Surprisingly, of 10 studies reporting a numerical estimated odds ratio or relative risk for MI associated with an increase in ozone levels, the estimate was <1 in seven studies, and this protective effect was statistically significant in three studies. However, effect sizes varied from as little as a 0.7% reduction13 to as much as an 18% reduction in MI risk for a 10 parts per billion (ppb) increase in ozone.5 It is worth recording that the relationship between ozone levels and the levels of other pollutants appeared to vary between studies. For example, considering the four studies reporting a significant effect of ozone in either direction, Cendon et al11 (the only study finding a detrimental effect of ozone) recorded positive correlations between ozone and other measured pollutants, whereas the remaining studies reported correlations that were either negative13 22 or both negative and positive.5

Estimated effects of gaseous pollutants on myocardial infarction risk. RR, relative risk.
Evidence for an effect of ambient CO, NO2, or SO2 levels on MI risk was mixed. However, for each of these pollutants, a proportion of studies (6/14, 6/13 and 4/10, respectively) found a significant detrimental effect, whereas no study found an effect in the opposite direction. Only four studies looking at multiple pollutants found no effect of any of these gases13 23 24 28; one did not report the number of cases included while the other three were relatively small studies (n = 5793, 772 and 399) which may have had limited power. Among studies which measured CO levels in parts per million (ppm, as used more commonly than μg/m3 or mg/m3), the four studies finding a significant effect presented effect sizes that were fairly consistent, each estimating a 2–4% increase in MI risk per 1 ppm increase in CO.5 15 16 20 For NO2, effect sizes ranged from a 1% to a 9% increase in risk per 10 ppb increase in NO2 levels, though the largest effects appeared in study populations restricted to those aged >65 years.20 21 Comparison of effect sizes among the four studies reporting an SO2 effect is more difficult since different pollutant measures were used between the studies. Finally, it is worth noting that the effects of these gases, where reported, appeared to operate relatively quickly: in most cases either on the same or next day.
Vulnerability among subgroups
A number of the studies described in this review included analyses stratified by various factors to assess the vulnerability of particular subgroups to any effects of air pollution on MI risk. In general, study reports did not state whether such subgroup analyses were preplanned and their results should thus be interpreted cautiously. Most commonly investigated was the role of age.
Barnett et al,20 who found detrimental effects of PM2.5, CO and NO2 among those aged ⩾65 years (table 3), reported that effects for those aged <65 years, though in the same direction, were smaller and non-significant, though it should be noted that event rates were lower among this age group so that lack of power might have been responsible for the lack of a statistically significant effect. Lanki et al12 correspondingly reported that the effects of CO and particle number concentration were larger among those aged ⩾75 years, though only for non-fatal outcomes (for CO: relative risk (RR) per 0.2 mg/m3 = 1.015, 95% CI 1.004 to 1.026 compared with 1.001, 0.995 to 1.008 for those aged <75 years); indeed the opposite effect was seen when fatal MIs were considered. The detrimental effects of ozone23 and of traffic exposure26 also appeared to increase for older subgroups. In contrast, Sullivan reported no modification by age of the effect of PM2.5 on MI risk.24
Other potential effect modifiers were less commonly investigated. One study considered the effects or PM2.5 by race, sex and smoking status, and found no differences24; this was in contrast with a study suggesting that the effect of PM2.5 may be larger among never-smokers than current- or ex-smokers (OR per IQR increase = 1.20, 95% CI 1.04 to 1.39 for never-smokers compared with 1.04, 0.90 to 1.21 for current smokers),22 and that increased risk associated with traffic exposure may be larger among women than among men (OR per IQR increase = 4.51, 2.55 to 8.00 for women compared with 2.59, 1.90 to 3.53 for men).26 The detrimental effects of traffic exposure were also reported to be larger among those out of employment, though confidence intervals were overlapping (OR = 4.20, 95% CI 2.88 to 6.12 compared with 2.20, 1.47 to 3.28 for those currently employed).26
Long-term effects of air pollution
Seven studies attempted to look at the long-term effects of cumulative exposure to air pollution on MI risk (table 4). Among these were three cohort studies in which “healthy” subjects were followed up for a number of years, and MI events accrued prospectively. Naturally, this approach can lead to relatively few events being included; indeed in the seventh-day Adventists cohort of 6303 subjects, only 62 MIs were observed30 31 and, though no effects of NO2, ozone or total suspended particles were found, large confidence intervals meant that important effects in either direction could not be ruled out. A more recent study included 584 MIs in a very large cohort of postmenopausal women (n = 65 893); no significant effect of PM2.5 was found (HR = 1.06 per 10 μg/m3 increase, 95% CI 0.85 to 1.34).
Two case–control studies found detrimental effects of long-term exposure to traffic, both for a directly estimated traffic exposure based on (road length × traffic density) as measured near the place of residence (OR = 1.04, 1.02 to 1.07 per 794 vehicle-km),32 and for NO2 exposure classified by residential district (OR = 1.43, 1.07 to 1.35 for regions with “high” versus “low” NO2 levels).34 The latter effect was reported to be stronger in older people (OR = 2.07, 1.28 to 3.35 for those aged 55–64 years). However, two further studies reported no effect of long-term exposure to NO2,33 35 or to PM10, CO, or SO2.33
Discussion
This review has concentrated principally on the effects of specific pollutants on the risk of MI. To our knowledge this is the first time the evidence base for pollution effects on this specific outcome has been systematically reviewed. Our search strategy is likely to have identified the majority of major studies focusing on this question, and we have taken steps to include studies where our specific outcome of interest was investigated as a subanalysis within a broader study.
From a total of 19 studies looking at short-term pollution effects, fairly persuasive evidence emerges of some short-term effect on MI risk. Among particle exposures, though no effect of PM10 was found in most studies, increasing daily PM2.5 levels were commonly associated with increasing MI risk between 0 and 2 days later. Increases in risk of 5–7% for a 10 μg/m3 increase in PM2.5 levels were typically reported, though one study reported an effect over three times this size. The evidence concerning effects of gaseous pollutants was more mixed: increases in CO, NO2, and SO2 were all associated with increases in MI risk in a substantial proportion of studies, yet just over half of the studies that investigated each of these exposures reported no effects. Surprisingly, higher levels of ozone were in a number of studies associated with a reduction in MI risk. However, ozone levels may be reduced close to sources of nitric oxide (such as vehicular traffic), where the two gases react to produce NO2. It has also been suggested that a negative correlation between ozone and methyl nitrate (a combustion product of some engine fuels) might be responsible for such paradoxical associations.36 Thus higher ozone levels may be acting as a marker of reductions in other pollutants. Of note, none of the studies finding significant protective effects of ozone looked at the effect in multipollutant models. An alternative explanation for the inconsistent effects observed for ozone is that since this gas may react with indoor surfaces, exposure measures based on outdoor monitors may be an inadequate marker of personal exposure among people spending a substantial proportion of their time indoors. We noted that among a limited number of studies that examined the question of effect modifiers, there was some suggestion that older people might be more vulnerable to the detrimental effects of pollution.
Though the evidence concerning most commonly measured pollutants may appear to be varied and sometimes conflicting, it should be borne in mind that the studies included were conducted using varying methodologies, and in varying situations. Variation in estimated effects may have been caused by a number of factors: different locations may have had differing underlying pollutant levels, different populations may have had differing susceptibilities, and different methods of exposure measurement, event ascertainment and statistical analysis may have led to differing results. With the earliest study of short-term effects meeting our inclusion criteria published in 1997, the quality of methodology seen in these studies reflects recent standards, with widespread attempts to control for important potential confounders, such as season, trend and ambient temperature, using statistical models. The majority of studies also included non-fatal MIs, which may be less susceptible to misclassification than MI deaths; some further validated MI diagnoses by having ECG and enzyme data examined by study investigators. Nevertheless, two important possibilities are that residual confounding by ambient temperature among studies performing only basic adjustments for temperature, and inclusion of misclassified events, may both have led to spurious results. The number of variations in study methodology, populations and settings make the extent of this problem difficult to ascertain. We did note that among the studies finding a relatively low proportion of significant pollutant effects were the few which had adjusted for lagged effects of temperature beyond the previous day,12 13 14 18 and a number of the studies in which MIs were separately validated against diagnostic criteria.12 22 23 24 However, this is at best suggestive and such differences in results might have a number of other explanations.
More generally, there are some inherent limitations in observational studies of air pollution effects. A common concern is that pollution measured by outdoor monitors may not be a good measure of overall personal exposure37 since indoor pollution sources are ignored, although median correlations as high as 0.92 have been reported between personal PM2.5 exposure in homes without environmental tobacco smoke38 and levels as measured by a central outdoor monitoring station. Correlations may nevertheless be substantially lower depending on indoor pollution sources in individual homes (notably from smoking, heating and cooking). For example, it has been suggested that personal exposure to ozone39 and nitrogen dioxide may be inadequately captured by ambient outdoor levels; indeed for the latter, indoor exposure, particularly for those with gas cookers, is likely to exceed exposure outside the home.40 More generally, ambient PM may be a better proxy than ambient gases for corresponding personal exposures.41 In time-series studies, by design, exposure must be averaged over the whole region being analysed. This leads to a second potential weakness since in reality levels of pollutants may vary substantially over, say, a city. Although the case-crossover design allows for individualised exposure measures, in practice exposure must be approximated using the limited number of pollution monitors available, so the same problem arises. Only the study by Peters et al,26 in which the exposure of interest was exposure to traffic, used a truly individualised exposure, based on diary data. Finally, since commonly measured air pollutants are likely to be highly correlated in any given situation, and unmeasured pollutants may also confound associations, studies such as those included here are unlikely to provide reliable evidence about the separate effects of individual pollutants.
A number of possible mechanisms have been suggested through which air pollution may affect cardiovascular function and trigger acute events. First, increases in levels of inflammatory markers such as C-reactive protein42 at times of higher ambient pollution have been observed, suggesting a systemic inflammatory response associated with exposure, though a number of experimental studies have reported no clear systemic inflammatory response to pollutants.43 44 Second, observational studies have linked higher levels of exposure to particulate air pollution with increases in heart rate45 and decreases in heart rate variability42; furthermore, an increase in discharges of implanted cardioverter-defibrillators has been reported following increases in ambient exposure to fine particles, NO2, CO and black carbon.46 Third, air pollution may induce changes in blood viscosity and factors that may increase the propensity to clot or impair the dissolution of thrombi: plasma viscosity increased among people exposed to a severe episode of air pollution in Germany in 1985.47 Controlled exposure experimental studies have demonstrated concentrated environmental particles leading to an increase in plasma fibrinogen levels in healthy volunteers,48 and dilute diesel exhaust leading to an increase in thrombus formation (measured using an ex vivo perfusion chamber) and platelet activation,49 and an impairment of the acute release of tissue plasminogen activator, an enzyme involved in the breakdown of blood clots.44 A fourth possible pathway is suggested by a study in rats in which exposure to urban particulate matter led to an increase in endothelins, which act as vasoconstrictors.50 Indeed, controlled exposure to a mixture of concentrated ambient particles and ozone in humans led to arterial vasoconstriction in one study,51 whereas an observational study reported an increase in blood pressure associated with increased PM2.5 levels in patients undergoing cardiac rehabilitation.52
Finally, a few individual studies have reported observations suggesting other possible mechanisms: air pollution exposure has been associated with accelerated progression of atherosclerosis and decreased plaque stability,53 decreased oxygen saturation and hypoxaemia,54 and increased ischaemic burden.44 With observational and experimental evidence seemingly supporting a number of potential pathways, it seems plausible that exposure to air pollution may affect the risk of acute cardiac events through multiple mechanisms. The exact compounds responsible are difficult to disentangle on current levels of evidence: in observational studies, ambient levels of any given pollutant are likely to be highly correlated with other pollutants, and experimental studies to date have tended to deliver composite exposures comparable with “real-world” exposures.
The final part of this review considered studies looking at longer-term effects of air pollution. A small number of prospective cohort studies have observed only a small number of events and thus reported effect estimates with wide confidence intervals. Notably, two case–control which looked at long-term exposure to traffic based on place of residence (one directly, and one using NO2 exposure as a proxy) did show a detrimental effect; however, these effects might be confounded by factors related to socioeconomic status and occupation. Thus, in contrast with short-term effects, the evidence base for long-term effects of air pollution exposures on MI risk is limited and few convincing conclusions can be drawn.
Air pollution guidelines55 and legal limits56 57 have generally not been based on cardiovascular outcomes. For example WHO recommend that average levels of PM10 (24 h average), ozone (8 h average), SO2 (24 h average) and NO2 (1 h average) should not exceed 50, 100, 20 and 200 μg/m3, respectively, but these limits were derived principally from data on mortality (for PM10 and ozone) and respiratory outcomes among vulnerable individuals (for SO2 and NO2).55 However, a notable implication of the linear pollution effects on MI risk estimated by most studies in this review is that if real, these effects would have an impact even below any threshold pollutant levels set by governments.
Our review has its limitations. First, our search strategy might have missed some studies. However, by searching a number of different databases, with different indexing systems, and furthermore, checking reference lists and the websites of major organisations, we believe that all major studies with MI as the primary outcome should have been picked up. We also took steps to include studies of cardiovascular diseases more broadly, where an analysis of MI was also performed separately. Our decision to include only papers analysing specific MI outcomes may also have led to some informative studies of related outcomes being excluded, though we believe that this is outweighed by the advantage in interpretability from the very specific focus on MI. Second, as with any review of the literature, there may have been publication bias: studies finding effects may have been more likely to be published. The extent of publication bias is difficult to assess in studies with such varied methodology and reporting. Though such concerns should always be borne in mind, our goal was not to produce a definitive numerical estimate of the effects of pollution effects on MI risk, but rather to give an overview of the evidence available. Finally, we did not include non-English-language citations owing to resource limitations, but we believe that this is unlikely to have led to the omission of any major papers in the area.
In conclusion, although the available literature is variable and sometimes conflicting, our review does seem to reveal compelling evidence for some effect of air pollution on MI risk based on studies in a variety of settings. There is much room for further research. The exact role of individual pollutants is unclear, and perhaps only further experimental studies under controlled conditions can deal with this topic. A large number of potential mechanisms have been suggested and though some have the support of limited data, no single mechanism has emerged as the most likely; indeed, multiple mechanisms may be at work, and further work may disclose the relative importance of each. There is also a need for biomarkers of exposure which can be used in epidemiological studies to give more reliable estimates of individual exposure to air pollutants. Finally, future studies may investigate factors that may make some people or indeed populations more susceptible than others to the detrimental effects of air pollution.
REFERENCES
Footnotes
See Featured editorial, page 1721
Funding This study was funded through grants from the British Heart Foundation and the Garfield Weston Foundation. LS is supported by a Wellcome Trust Senior Research Fellowship in Clinical Science. SH is funded by a Wellcome Trust Research Career Development Fellowship (076583/Z/05/Z).
Competing interests None declared.
Role of funding sources: The British Heart Foundation, the Garfield Weston Foundation, and the Wellcome Trust had no role in the design or conduct of this review, nor in the preparation, review, or approval of the manuscript.
Provenance and Peer review Not commissioned; externally peer reviewed.
Linked Articles
- Featured editorial