Article Text

Abstract
Background Insulin resistance (IR) is implicated as an independent risk factor for vascular disease. The aim of this study was to assess the impact of family history (FH) of type 2 diabetes (T2DM) and/or cardiovascular disease (CVD) on the associations between IR, low-density-lipoprotein cholesterol (LDL-C) and subclinical atherosclerosis (common and internal carotid artery intima media thickness (IMT)) in healthy European adults.
Methods Participants (n=1048) in the Relationship between Insulin Sensitivity and Cardiovascular disease (RISC) study were grouped according to family history of: (i) type 2 diabetes (FH-T2DM); (ii) cardiovascular disease (FH-CVD); (iii) both (FH-BOTH); or (iv) neither (CON). Insulin resistance (M-value, hyperinsulinaemic euglycaemic clamp), LDL-C and IMT were examined in relation to FH in all available participants, and then within subcohorts (highest quintiles) with higher LDL-C (>3.5 mmol/l (>135 mg/dl), n=252) or greater IR (M-value<5 mg/min/kg, n=299).
Results Carotid IMTs were comparable across the four FH groups, but insulin sensitivity (M-value) was lower (p<0.01) in FH-T2DM (6.1±2.6 mg/min/kg than in either CON (6.9±2.9 mg/min/kg) or FH-CVD (7.1±2.7 mg/min/kg). Within the highest LDL-C quintile, those with FH-CVD (or FH-BOTH) had higher common and internal carotid IMT (6–12%, p<0.05 vs CON). In contrast, within the most IR quintile, FH-CVD was not associated with IMT.
Conclusion In this cross-sectional analysis, family history of T2DM (but not of CVD) was associated with IR. In the presence of elevated LDL-C, FH-CVD (but not FH-T2DM) was associated with increased carotid IMT.
- Insulin resistance
- vascular disease
- low-density-lipoprotein cholesterol
- atherosclerosis
- metabolic syndrome
- endocrinology
- cerebral protection
Statistics from Altmetric.com
- Insulin resistance
- vascular disease
- low-density-lipoprotein cholesterol
- atherosclerosis
- metabolic syndrome
- endocrinology
- cerebral protection
Introduction
Insulin resistance (IR) is seen as the core component of the cardiometabolic syndrome, or IR syndrome,1 and is characterised by visceral obesity, dyslipidaemia, arterial hypertension, type 2 diabetes mellitus (T2DM) and non-alcoholic fatty liver disease.2–4 However, IR not only occurs in T2DM5 and healthy humans with a family history (FH) of T2DM (FH-T2DM),2 6–8 but is also regarded as a risk factor for cardiovascular (CVD) events such as coronary heart disease and stroke.9–11 However, these relationships are bidirectional in that IR may occur as a result of an acute cardiovascular event.12 13
Interestingly, healthy individuals with FH-T2DM8 14 and offspring of patients with coronary heart disease15 16 have been reported in smaller studies to have higher intima media thickness (IMT) in carotid artery segments. Increased carotid IMT is an important predictor of CVD events,17 18as it indicates advanced (subclinical) atherosclerosis.15 In addition, a well-established and potent risk factor for accelerated atherosclerosis is elevated circulating low-density-lipoprotein cholesterol (LDL-C).19 20 However, the relative contributions of IR and elevated LDL-C to CVD risk and atherosclerosis are not well defined.19–21
Thus, this study aimed to investigate the impact of a family history of either T2DM, CVD (FH-CVD), or both (FH-BOTH) on glucose tolerance, circulating lipids, insulin sensitivity and subclinical atherosclerosis (ie, carotid artery IMT) within a large, cohort of healthy European adults (RISC), using those without a family history of either condition as a reference group (control, CON).
In order to better differentiate the effects of increased circulating LDL-C and IR in persons at higher risk of CVD, these parameters were also examined across the same FH categories in subcohorts with elevated LDL-C or IR (highest quintiles). It was hypothesised that participants with FH-T2DM and/or FH-CVD would have higher IR and/or IMT and that this might be impacted by elevated circulating LDL-C.
The following were examined in FH-T2DM, FH-CVD, FH-BOTH and CON: (i) glucose tolerance/metabolism and time course of plasma glucose, serum insulin and C peptide concentrations during a standard oral glucose tolerance-test (oGTT), (ii) whole-body insulin-sensitivity during a 2-h hyperinsulinaemic-euglycaemic clamp with insulin-mediated suppression of plasma free fatty acids (FFA), and (iii) IMT of the common (CCA) and internal carotid artery (ICA). All groups were comparable in major anthropometric characteristics.
These variables were then re-examined within the same four groups, but, including only those participants in the highest LDL-C quintile (LDL-C+ subcohort) or highest IR quintile (IR subcohort) in order better to reveal the effects of increased LDL-C and IR.
Materials and methods
The study population is part of the prospective RISC study cohort (http://www.egir.org/).21 From 2002 to 2004, participants were recruited in 19 centres in 14 European countries.21 They were pre-screened for confirmation of excellent health and absence of any regular drug intake affecting insulin-sensitivity, blood pressure, circulating lipids or circulating glucose. All participants included were aged between 30 and 60 years.
The exclusion criteria were elevated systolic and diastolic blood pressure (>140 and >90 mmHg) after threefold measurement and pronounced hyperlipidaemia (fasting circulating total cholesterol>7.7 mmol/l (>300 mg/dl) and/or triglycerides>4.5 mmol/l (>400 mg/dl)), as well as diabetes mellitus and other chronic diseases, such as overt coronary heart disease, >40% carotid stenosis, and treatment for hypertension, diabetes or hyperlipidaemia.7 21 Approval from local ethics committees was obtained by each recruitment centre, and all participants gave informed written consent to the study protocol.
Group and subcohort selection procedure
Relatives of individuals with T2DM and CVD, selected from an entire database, were divided into four groups, namely: (i) all participants with a family history of T2DM only (FH-T2DM: n=187),7 (ii) all participants with a family history of CVD only (FH-CVD: n=201) and (iii) all participants with a family history of both T2DM and CVD (FH-BOTH: n=141); all were compared with (iv) those with no family history of T2DM and/or CVD (CON: n=519),7 who were selected to have comparable anthropometric characteristics (table 1).
All study participants
All participants with an LDL-C in the highest quintile of the whole database (>3.5 mmol/l (>135 mg/dl)) were included in the LDL-C+ subcohort (n=252), consisting of 118 CON, 45 FH-T2DM, 54 FH-CVD and 35 FH-BOTH. In addition, all participants with IR (ie, M-value<5 mg glucose/min/kg)2 were included in the IR subcohort (n=299), consisting of 131 CON, 65 FH-T2DM, 50 FH-CVD and 53 FH-BOTH. In order to assess the impact of each FH variable, the characteristics of these participants were also examined according to the presence or absence of FH-T2DM and FH-CVD.
Study Day 1
After confirming that participants had fasted overnight for at least 10 h, their medical family history and regular medication were noted on a questionnaire. The study participants underwent a thorough clinical examination to confirm their excellent health; this included a resting ECG recording, and ankle-brachial-index measurements, followed by a routine laboratory check. In addition, sitting blood pressure was measured three times (Omron 705cp, Omron Healthcare Europe, Hoofddorp, The Netherlands), as well as body weight and fat-free mass by the Tanita Bioimpedance Balance (TBF-300 Body Composition Analyser, Tanita International Division, Yiewsley, UK); and waist and hip circumferences by tape measure according to a standardised written protocol.21
Thereafter, a standardised oral glucose-tolerance-test (oGTT) was started.2 7 22 Participants drank a 75g-glucose solution within 5 min. Blood samples used to determine plasma glucose, serum insulin and serum C peptide concentrations were obtained at 0, 30, 60, 90 and 120 min. Individuals with diabetes, with respect to American Diabetes Association (ADA) criteria from 2003,23 were excluded from the study. The ADA criteria23 were also used to define impaired fasting glucose and glucose intolerance.
Study Day 2
After a further overnight fast for at least 10 h, two catheters were inserted into an antecubital vein in the left and right arm for blood sampling and infusions. The isoglycaemic clamp glucose target was determined from the mean value of three fasting plasma glucose measurements taken. However, in the case of a value lower than 4.44 mmol/l (80 mg/dl), the glucose clamp target was set to 4.44 mmol/l (80 mg/dl), and in the case of a value higher than 5.55 mmol/l (100 mg/dl), the clamp goal was 5.55 mmol/l (100 mg/dl).2 8 24 25 Hyperinsulinaemic-euglycaemic clamp-tests were performed for 120 min, with primed-(0–4 min:fourfold, 5–7 min:twofold rate)-continuous regular insulin infusion (40 mU insulin/min/m2 body surface area).2 5 24–26 Blood samples to determine plasma glucose, FFA, and serum insulin and C peptide were drawn at 0, 80 and 120 min.
Carotid artery ultrasound
High-resolution B-mode ultrasound of extracranial carotid arteries was performed bilaterally, according to a previously described scanning and reading protocol.8 17 The carotid images were obtained in each recruiting centre by trained and certified physicians/technicians following standardised protocol21 and using high-resolution ultrasound scanners, all with a 7.5 or 10.0 MHz linear-array transducer. The imaging protocol required acquisition of longitudinal B-mode images of the distal right and left CCA and the origin of ICA from the anterior, lateral and posterior angle as recommended.8 17 The entire imaging procedure was recorded on S-VHS tapes.
Carotid images were analysed in a centralised reading centre (University of Pisa, Pisa, Italy), by a single reader blinded to clinical data, using a high-resolution video recorder (Panasonic AG-MD830, Panasonic System Engineering Italia S.P.A, Milan, Italy) coupled with a computer-driven image analysis system (Medical Imaging Processing; Institute of Clinical Physiology, Consiglio Nazionale delle Ricerche, Pisa, Italy).8 27 End-diastolic unzoomed frames of the left CCA in longitudinal projection with well-defined intima media complexes of the near and far wall were selected and digitised with a resolution of 576×768 pixels and 256°grey-scale per pixel.
Plasma metabolites and hormones
Plasma total cholesterol, low- and high-density-lipoprotein (HDL) cholesterol, triglycerides, glucose and FFA, as well as serum insulin and C peptide concentrations, were measured in a central laboratory, whereas circulating creatinine levels and liver transaminase enzyme activities in local labs, were transmitted and centrally processed as described.7 21 28
Calculations
Impaired fasting glucose (IFG) and impaired glucose tolerance (IGT) were defined according to international criteria.23 Impaired glucose metabolism was defined when at least one of these criteria were fulfilled. Whole-body insulin-sensitivity was calculated as M-value (in mg glucose/min/kg total body weight) during the final 20 min clamp-test interval.5 7 24 25 Glomerular filtration rate (GFR) was calculated using the Modification of Diet in Renal Disease (MDRD) formula.2 29 Relationships between the outcome variables (common/internal carotid artery IMT, LDL-cholesterol, M-value) were evaluated by univariate Pearson correlation coefficients.7 8 30 Multiple linear regression analyses, based on the data of all participants and the subcohorts, were applied with carotid IMT as the dependent variable, in order to find possible predictors for segment carotid IMT in all participants and within each group. Predictors of carotid IMT at a significance level of p<0.10 remained in the model, as described in detail elsewhere.8 24 30 The final model was verified by backward stepwise multiple linear regression analysis.
Power
When considering previous investigations8 30 reporting a maximal IMT of ∼0.7 mm in middle-aged persons, it was calculated that a minimum of 35 participants were needed in each group to detect an absolute IMT difference of 10% between groups with a power of ∼90%, an α-value of 0.05 and a SD of 0.10.
Statistics
Comparisons between two groups were performed using a two-sided Student t test for unpaired data; those between three or more groups were carried out using ANOVA with two-sided Dunnett-t or Bonferroni post hoc testing (SPSS 13.0, SPSS Inc.). Grouped data are shown as mean±SD/SE, as indicated.
Results
Anthropometric characteristics and routine laboratory measurements
Anthropometric characteristics and baseline routine lab parameters were comparable across the four FH groups in the study population as a whole (table 1), and also in the LDL-C+ (table 2) and IR subcohorts (table 3) (although within the LDL-C+ subcohort FH-BOTH had 6% higher total cholesterol and LDL-C levels (p<0.04 vs CON for each)).
LDL cholesterol (LDL-C)+ subcohort (LDL-C>3.5 mmol/l)
IR subcohort (M<5 mg/min/kg)
Oral glucose tolerance test
Both groups with T2DM in their family history (FH-T2DM and FH-BOTH) had higher oGTT concentrations of glucose, insulin and/or C peptide (p<0.05) (figure 1A–C), as well as a greater prevalence of glucose intolerance and impaired glucose metabolism than CON and/or FH-CVD (tables 1–3).
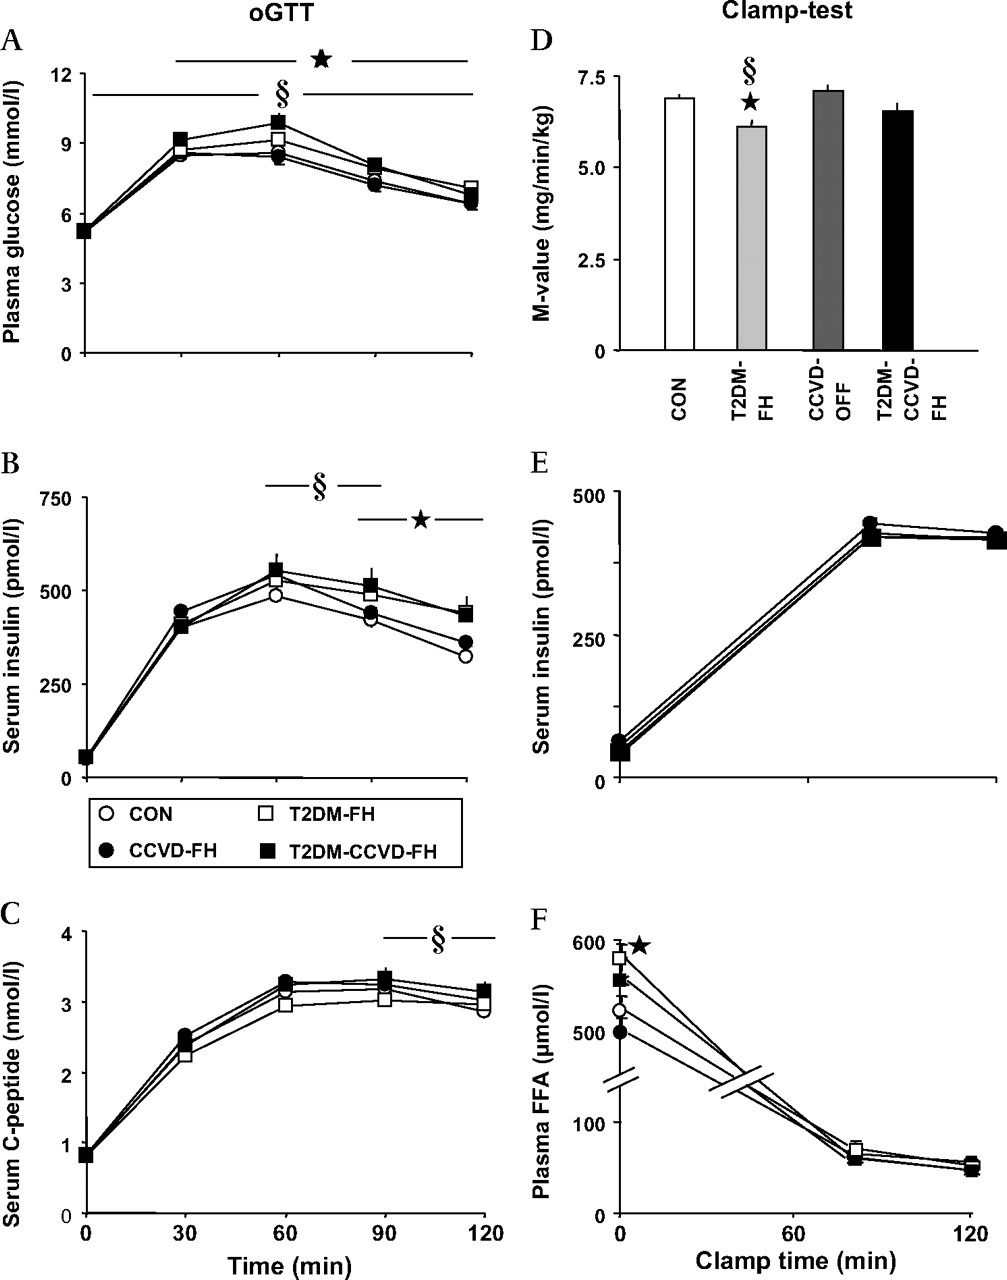
Circulating concentrations of (A) glucose, (B) insulin, and (C) C peptide during the oral glucose tolerance test (oGTT) as well as (D) M-value, (E) serum insulin and (F) plasma free fatty acid (FFA) concentrations during the 2h-hyperinsulinaemic-(40 mU/min/m2)-isoglycaemic-clamp-test in humans without type 2 diabetes mellitus (T2DM) or cardiovascular disease (CVD) in the family history (CON, open circle) (n=519), those with family history of T2DM (FH-T2DM, open square) (n=187), CVD (FH-CVD, solid circle) (n=201), and both T2DM and CVD (FH-BOTH, solid square) (n=141). All data are given as means±SE (ANOVA with Dunnett-t post hoc test): *, p<0.05 FH-T2DM versus CON; §, p<0.05 T2DM-FH-CVD versus CON.
The hyperinsulinaemic clamp-test
The M-value was lower in FH-T2DM than in CON and FH-CVD by 11% and 13% respectively (p<0.02 for each) (figure 1D). Serum insulin (figure 1E) and C peptide (data not shown) concentrations during the clamp were not different in all four groups. Fasting plasma FFA was higher by 9% and 16% in FH-T2DM compared to CON and FH-CVD respectively (p<0.05 for each) (figure 1F), although this was comparable across the FH groups during the hyperinsulinaemic clamp (figure 1F).
Of note, 35% and 38% of participants with FH-T2DM and FH-BOTH (respectively) were insulin-resistant (p<0.04 vs CON for each), in comparison with 25% of those with FH-CVD and CON (p=NS).
Carotid intima media thickness
All participants
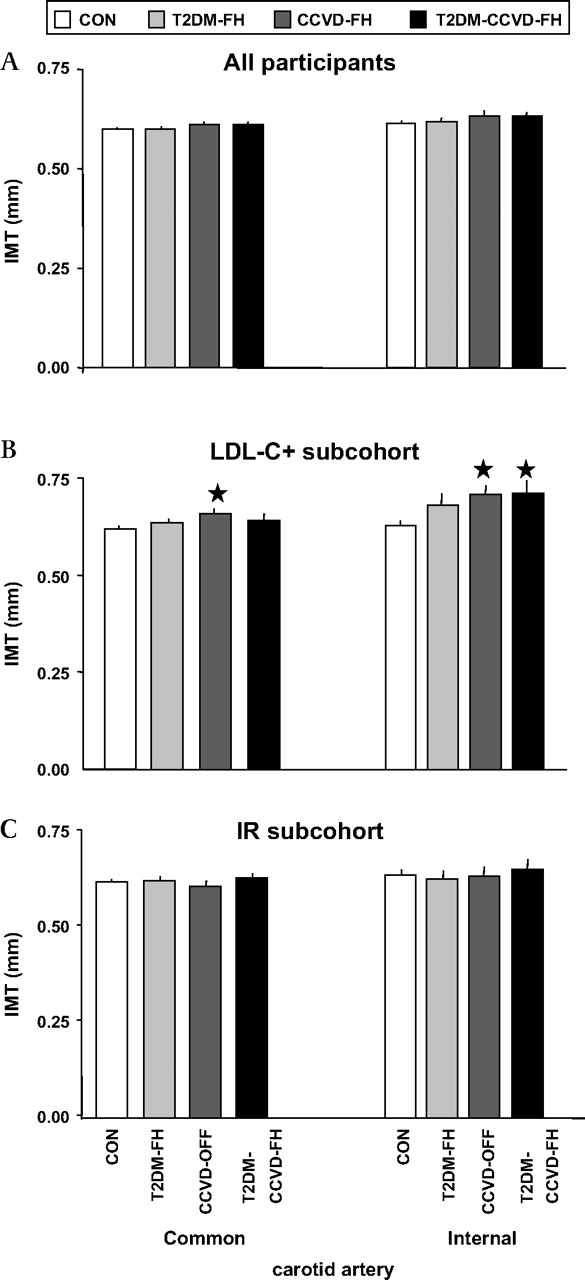
The four FH groups had comparable IMT for both common and internal carotid arteries (figure 2A).

Intima media thickness (IMT) of the common and internal carotid artery in (A) the entire cohort: humans without type 2 diabetes mellitus (T2DM) or cardiovascular disease (CVD) in the family history (CON, n=519, open bars), as well as those with family history of T2DM (FH-T2DM, n=187, light-grey bars), CVD (FH-CVD, n=201, dark-grey bars) and both T2DM and CVD (T2DM-FH-CVD, n=141, dark bars), (B) the LDL-C+ subcohort, in whom only participants with low-density-lipoprotein (LDL)-cholesterol>3.5 mmol/l (>135 mg/dl) (5th LDL-C-quintile) were included (CON: n=118, FH-T2DM: n=45, FH-CVD: n=54, and T2DM-FH-CVD: n=35), as well as (C) the insulin-resistant (IR) subcohort (only IR participants with M-value<5 mg glucose/min/kg; CON: n=131, FH-T2DM: n=65, FH-CVD: n=50, and T2DM-FH-CVD: n=53). All data are given as means±SE. ANOVA with Dunnett-t post hoc test: *, p<0.05 versus CON.
LDL-C+ subcohort
Within participants in the highest quintile for LDL-C, those with FH-CVD had 6% and 12% higher IMT in CCA and ICA respectively (p<0.05 for each) when compared with CON (figure 2B). Those with FH-BOTH had 13% higher IMT of the ICA (p<0.03 vs CON). There was a trend (p=0.067) for FH-T2DM versus CON to have 8% higher IMT in the ICA only.
IR subcohort
There were no differences in IMT of CCA and ICA between the four FH groups (figure 2C).
Effect of family history
When comparing participants with and without FH-CVD (table 4, left side), no statistically significant differences were found, although there was a trend for IMT in CCA and ICA to be higher in FH-CVD (p<0.10 for each). Family history of T2DM was associated with impaired glucose tolerance and lower M-value (p<0.003 for each) (table 4, right side).
Effects of family histories
Effects of increased LDL-C and insulin resistance on IMT
Participants with elevated LDL-C (LDL-C+ subcohort) and insulin resistance (IR subcohort) differed from participants without these features in many anthropometric characteristics and baseline routine lab parameters, but also in insulin-sensitivity as well as CCA- and ICA-IMT (table 5).
Effects of elevated LDL-C and IR
Correlation and regression analyses
Among the major outcome variables, significant correlations were found between carotid IMT (table 6) and: (i) M-value and plasma LDL-C in all participants; (ii) presence of FH-CVD and LDL-C in the LDL-C+ subcohort; and (iii) LDL-C in the IR subcohort. The backward stepwise multiple linear regression analysis (table 7) revealed LDL-C to be a common predictor for both carotid segment IMTs in the whole study population and in the two subcohorts, with the exception of ICA-IMT in the LDL-C+ subcohort. Moreover, FH-CVD was a predictor of IMT of CCA and ICA in the LDL-C+ subcohort. Insulin sensitivity (M-value) was a weaker predictor of CCA-IMT in all participants and in the LDL-C+ subcohort.
Correlation coefficients (Pearson moment products and p values) in all study participants, as well as the LDL+ and insulin-resistance (IR) subcohort, based on analyses of intima media thickness (IMT) in the common and the internal carotid artery (CA) with family histories of type 2 diabetes (T2DM) and cardiovascular disease (CVD), whole-body insulin sensitivity (M-value) and plasma low-density-lipoprotein (LDL) cholesterol
The associations of family histories of type-2 diabetes (T2DM) and cardiovascular disease (CVD), whole-body insulin sensitivity (M-value) and plasma low-density-lipoprotein (LDL) cholesterol with intima media thickness (IMT) of common and internal carotid artery in all participants as well as LDL+ and insulin-resistance (IR) subcohort, using multiple linear regression analyses
Discussion
This study provides detailed insights into the relative contributions of elevated LDL-C and insulin resistance to subclinical atherosclerosis in healthy European adults (n=1048) without hyperlipidaemia, hypertension or diabetes. It shows for the first time that, depending on individual family history, elevated LDL-C may differentially affect carotid IMT, an established surrogate predictor of vascular events9–11 Thus, those with a family history of T2DM were frequently affected by reduced insulin-sensitivity, impaired glucose metabolism and higher fasting FFA, but had no detectable increase in carotid IMT, even when considering the most insulin-resistant individuals. In contrast, those with a FH of CVD and higher LDL–C (>3.5 mmol/l (135 mg/dl)) had elevated carotid IMT (both carotid artery segments) without discernible abnormalities in glucose metabolism.
Insulin-resistance, as demonstrated by lower M-values, predominantly occurred in FH-T2DM in accordance with previous studies by ourselves and others.2 6–8 31 32 Moreover, and again in keeping with previous reports, marked IR, as defined elsewhere,2 was most prevalent (35–38%) in those with a family history of T2DM (ie, FH-T2DM and FH-BOTH),6 33 who are known to have a high (40%) lifetime risk of T2DM.32 34
Intima media thickness
Carotid IMT is a non-invasive measure of the progression of atherosclerosis, which is known to predict CVD events.10 17 35 Increased carotid IMT is found not only in older people and insulin-resistant patients with T2DM, arterial hypertension and/or hyperlipidaemia,10 17 36 37 but also in healthy descendants of patients with T2DM8 14 and CVD.15 16 Whereas IMT is often only examined in the CCA14 38 (which may have less predictive power for the presence of clinically important atherosclerosis8 11 39), in this study IMT was determined in CCA and ICA.
Pannacciulli et al reported elevated CCA-IMT in young offspring of people with T2DM.14 A previous study,8 conducted in a different cohort, detected higher IMT in the ICA only. The participants of that study8 were first-degree relatives of T2DM patients, and had a relatively high LDL-C (3.37 mmol/l (130 mg/dl)) with total cholesterol (5.2–5.4 mmol/l (200–210 mg/dl)), thereby resembling the present LDL-C+ subcohort, in whom FH-T2DM also had a borderline significantly increased IMT of ICA but not CCA (figure 2B).
Plasma lipids and association with IMT
According to the Adult Treatment Panel III (ATP-III) criteria from the US National Cholesterol Education Program,40 the four groups of the entire study cohort on average showed ‘desirable’ levels of total cholesterol, with ‘near-optimal’ LDL-C and ‘neither high nor low’ HDL-C levels, as well as ‘normal’ triglycerides (ie, a ‘healthy’ lipid profile). Elevation of plasma FFA in FH-T2DM (figure 1F) indicates IR in adipose tissue with impaired suppression of lipolysis by insulin.
In the present LDL-C+ subcohort, according to ATP-III-guidelines, average plasma triglycerides and HDL were ‘normal’, but total and LDL-C in the CON, FH-T2DM and FH-CVD were ‘borderline high’, and ‘high’ in FH-T2DM,40 According to these recommendations,40 only healthy participants with LDL-C above 4.9 mmol/l (190 mg/dl) should have been treated (∼6% of the LDL-C+ subcohort). Although there were no differences in anthropometry or other key parameters in the routine laboratory tests, the four LDL-C+ subcohort groups, as defined by family history, did differ in IMT of CCA and ICA. Thus, a family history of CVD (with or without a family history of T2DM), in combination with ‘(borderline) high’ LDL-C, is associated with a ∼0.040–0.080 mm elevation in IMT (figure 2B), potentially increasing CVD risk by 10–15%.41 Considering an average increase of carotid IMT of ∼0.005 mm/year in healthy participants at similar age,42 the observed difference in IMT is equivalent for those with FH of CVD to that of control participants approximately 10 years older. In contrast, carotid IMT does not appear to be influenced by FH when LDL-C is ‘near-optimal’,40 regardless of the presence of IR (figure 2C). Treatment of hypercholesterolaemia would not have been recommended in the vast majority of participants with a positive CVD family history in the LDL-C+ subcohort.40
In order to test the present findings further, correlation (table 6) and regression (table 7) analyses were performed to identify predictors of IMT in the entire group and within each subcohort. These highlighted fasting plasma LDL-C, family history of CVD (in the LDL-C+ subcohort) and insulin sensitivity (M-value) as predictors of carotid IMT. Low-density-lipoprotein cholesterol remained in all models as a strong predictor of IMT in both carotid segments. In participants with elevated LDL-C, a family history of CVD was the only predictor of IMT in both common and internal carotid arteries. Whole-body insulin-sensitivity remained in the model, but only as a weak predictor. No association of IMT with a FH of T2DM was detected. Thus, a combination of heritable and environmental risk factors was most deleterious, whereas the presence of a genetic predisposition alone appears to be insufficient to markedly promote atherosclerosis.
Participants with both family histories
As predicted, those with a family history of both conditions had higher glucose and insulin concentrations following oral glucose ingestion, and (for those in the highest LDL-C quintile) increased IMT in the ICA. When looking at the combined effects due to family histories of T2DM and CVD, it appears that the T2DM-FH-CVD group display both defects of glucose metabolism, as seen in the oGTT, and increased atherosclerosis, as reflected by elevated IMT of the ICA. The effects seen in the FH-BOTH group seemed not to be more than the sum of the effects of FH-T2DM and FH-CVD separately, as both insulin-sensitivity and CCA-IMT were not significantly different from controls.
Conclusion
In this cross-sectional analysis of well-phenotyped healthy individuals, those with a family history of T2DM (but not a family history of cardiovascular disease) were insulin-resistant. In those with elevated LDL-C and a family history of cardiovascular disease, carotid IMT was increased, although this was not the case in those with a family history of type 2 diabetes. These findings suggest a closer association of elevated LDL-C than insulin resistance with the development of atherosclerosis.
Acknowledgments
The European Group for the Study of Insulin Resistance (EGIR, http://www.egir.org/) RISC study is partly supported by EU grant QLG1-CT-2001-01252.
References
Footnotes
↵* RISC Investigators
RISC recruiting centres
Amsterdam, The Netherlands: R.J. Heine, J Dekker, S de Rooij, G Nijpels, W Boorsma
Athens, Greece: A Mitrakou, S Tournis, K Kyriakopoulou, P Thomakos
Belgrade, Serbia and Montenegro: N Lalic, K Lalic, A Jotic, L Lukic, M Civcic
Dublin, Ireland: J Nolan, TP Yeow, M Murphy, C DeLong, G Neary, MP Colgan, M Hatunic
Frankfurt, Germany: T Konrad, H Böhles, S Franke, F Baer, H Zuchhold
Geneva, Switzerland: A Golay, E. Harsch Bobbioni, V. Barthassat, V. Makoundou, TNO Lehmann, T Merminod
Glasgow, Scotland: JR Petrie, C Perry, F Neary, C MacDougall, K Shields, L Malcolm
Kuopio, Finland: M Laakso, U Salmenniemi, A Aura, R Raisanen, U Ruotsalainen, T Sistonen, M Laitinen, H Saloranta
London, England: SW Coppack, N McIntosh, J Ross, L Pettersson, P Khadobaksh
Lyon, France: M Laville, F. Bonnet, A Brac de la Perriere, C Louche-Pelissier, C Maitrepierre, J Peyrat, S Beltran, A Serusclat
Madrid, Spain: R. Gabriel, EM Sánchez, R. Carraro, A Friera, B. Novella
Malmö, Sweden (1): P Nilsson, M Persson, G Östling, (2): O Melander, P Burri
Milan, Italy: PM Piatti, LD Monti, E Setola, E Galluccio, F Minicucci, A Colleluori
Newcastle-upon-Tyne, England: M Walker, IM Ibrahim, M Jayapaul, D Carman, C Ryan, K Short, Y McGrady, D Richardson
Odense, Denmark: H Beck-Nielsen, P Staehr, K Hojlund, V Vestergaard, C Olsen, L Hansen
Perugia, Italy: GB Bolli, F Porcellati, C Fanelli, P Lucidi, F Calcinaro, A Saturni
Pisa, Italy: E Ferrannini, A Natali, E Muscelli, S Pinnola, M Kozakova
Rome, Italy: G Mingrone, C Guidone, A Favuzzi. P Di Rocco
Vienna, Austria: C Anderwald, M Bischof, M Promintzer, M Krebs, M Mandl, A Hofer, A Luger, W Waldhäusl, M Roden
Project Management Board
B Balkau (Villejuif, France), SW Coppack (London, England), JM Dekker (Amsterdam, The Netherlands), E Ferrannini (Pisa, Italy), A Mari (Padova, Italy), A Natali (Pisa, Italy), M Walker (Newcastle, England)
Core laboratories and reading centres
Lipids Dublin, Ireland: P Gaffney, J Nolan, G Boran
Hormones Odense, Denmark: C Olsen, L Hansen, H Beck-Nielsen
Albumin:creatinine Amsterdam, The Netherlands: A Kok, J Dekker
Genetics Newcastle-upon-Tyne, England: S Patel, M Walker
Stable isotope laboratory Pisa, Italy: A Gastaldelli, D Ciociaro
Ultrasound reading centre Pisa, Italy: M Kozakova
ECG reading, Villejuif, France: MT Guillanneuf
Data Management Villejuif, France: B Balkau, L Mhamdi
Mathematical modelling and website management Padova, Italy: A Mari, G Pacini, C Cavaggion
Coordinating office: Pisa, Italy: SA Hills, L Landucci, L Mota
Further information on the RISC Study and participating centres can be found on http://www.egir.org/
Funding Financial support was provided by AstraZeneca (Sweden). The European Group for the Study of Insulin Resistance who carried out the study is supported by Merck Santé, France.
Competing interests None.
Patient consent Obtained.
Ethics approval This study was conducted with the approval of the local ethics committees from all study centres.
Provenance and peer review Not commissioned; externally peer reviewed.