Article Text

Abstract
Background On echocardiography approximately one-third of patients with severe aortic valve stenosis based on aortic valve area (AVA<1.0 cm2) demonstrate a non-severe mean pressure gradient (ΔPm; ≤40 mm Hg) despite apparently normal left ventricular function. It has been suggested that inconsistent echocardiographic grading may be due to ‘paradoxical’ low stroke volume. However, the correct echocardiographic assessment of stroke volume hinges on the often problematic measurement of the left ventricular outflow tract (LVOT) diameter.
Objective To investigate whether inconsistent grading and reduced stroke volume persist when the quantification of aortic valve stenosis is based on cardiac catheterisation which is independent of LVOT measurements.
Methods and results 333 consecutive patients underwent cardiac catheterisation within 30 days after their index echocardiography showing an AVA ≤2 cm2 and shortening fraction ≥30%. On invasive testing 85 patients (26%) demonstrated inconsistent (AVA<1 cm2 and ΔPm≤40 mm Hg) and 153 (46%) consistent grading (AVA<1 cm2 and ΔPm>40 mm Hg) with the remainder (28%) presenting with a calculated AVA≥1 cm2. Inconsistently graded patients were older (71 vs 67 years, p<0.006) with no differences in sex or body surface area between groups. Stroke volume and stroke volume index were significantly lower in inconsistently graded patients (63±14 vs 73±18 ml and 35±7 vs 39±7 ml/m2, respectively, both p<0.001). However, 41/85 (48%) of inconsistently graded patients had a normal stroke volume index >35 ml/m2.
Conclusion In the framework of current guidelines inconsistent grading of aortic valve stenosis is common, extends to cardiac catheterisation and is only partially explained by low stroke volume despite apparently normal left ventricular systolic function.
- Aortic valve stenosis
- echocardiography
- cardiac catheterisation
- stroke volume
- guidelines
- aortic valve disease
Statistics from Altmetric.com
- Aortic valve stenosis
- echocardiography
- cardiac catheterisation
- stroke volume
- guidelines
- aortic valve disease
Introduction
Current American and European guidelines both recommend an aortic valve area (AVA) cut-off value of <1.0 cm2, or, indexed by body surface area, <0.6 cm2/m2 for severe aortic stenosis.1 2 The American guidelines set the cut-off point at 4 m/s peak transvalvular velocity or a mean pressure gradient (ΔPm) >40 mm Hg in the presence of a ‘normal’ cardiac output. The European Society of Cardiology guidelines further state that ‘Severe aortic stenosis is unlikely if cardiac output is normal, and there is a mean pressure gradient <50 mm Hg’. Calculation of AVA and ΔPm should yield a consistent classification of a particular aortic stenosis in patients with normal left ventricular function. However, a common clinical observation consists of a patient with severe aortic valve stenosis based on AVA but non-severe stenosis based on ΔPm (AVA<1.0 cm2 and ΔPm≤40 mm Hg). We recently reported that this constellation may be found in up to 30% of patients with normal left ventricular systolic function when assessed by echocardiography.3
A substantial proportion of patients with aortic stenosis present with ‘paradoxical’ low flow,4 defined as unexpectedly reduced stroke volume in the presence of a normal ejection fraction. Reduced stroke volume resulting in a lower than expected ΔPm may therefore explain inconsistent grading in some patients. On the other hand, Carabello, using the Gorlin equation (
Contemporary assessment of AVA and ΔPm and management of patients with aortic stenosis rely on (serial) echocardiographic measurements. AVA is calculated from the continuity equation (
To overcome the uncertainty of the echocardiographic assessment of stroke volume and AVA we analysed data from LVOT independent-cardiac catheterisation in patients with aortic valve stenosis. We hypothesised that inconsistent grading of the severity of aortic valve stenosis persists when cardiac catheterisation is performed. Second, we set out to investigate whether a low stroke volume is mandatory for inconsistent grading or whether it may occur even in the presence of normal flow as predicted from the Gorlin equation.
Patients and methods
From our database we identified 333 consecutive patients between 1995 and 2005 demonstrating normal left ventricular systolic function and a calculated AVA ≤2 cm2 on echocardiography who underwent cardiac catheterisation within 30 days after their index echocardiography. The echocardiographic data of the 333 patients were included in a previous report of a cohort of 2483 patients.3 All patients had normal left ventricular function, no regional wall motion abnormalities, grade I or less mitral or aortic regurgitation and unobstructed flow in the left cavity or LVOT. Normal left ventricular function was defined as normal global systolic left ventricular function with fractional shortening ≥30% without regional wall motion abnormalities. Ejection fraction was not determined routinely.
Echocardiography
Echocardiography was performed following the guidelines for the clinical application of echocardiography7 and has been described in detail previously.3 Pressure gradients were determined using the simplified Bernoulli equation (ΔP=4v2). ΔPm was calculated automatically from the mean of the instantaneous gradients divided by the number of measurements
Cardiac catheterisation
Right and left heart catheterisation were performed via the right femoral approach. Right heart catheterisation was carried out using a 7 French Swan–Ganz flow-directed thermodilution catheter and a cardiac output computer (Edwards Lifesciences Irvine, California, USA). Cardiac output was calculated from the average of three consecutive manual injections9 of 10 ml of iced NaCl 0.9% solution. A pigtail catheter was passed retrogradely across the aortic valve, and the transvalvular gradient was determined by catheter pullback into the aorta. The mean gradient, represented by the area under the curve, and systolic ejection period were measured automatically by the device software. Manual correction was performed when deemed necessary. AVA was calculated using the Gorlin formula
Statistics
Complete clinical, echocardiographic and catheterisation data were available for all 333 patients. Non-linear regression was performed for data pairs AVA versus ΔPm from echocardiography and cardiac catheterisation using SPSS software (version 12.0.1) based on the formula
Results
Inconsistent grading
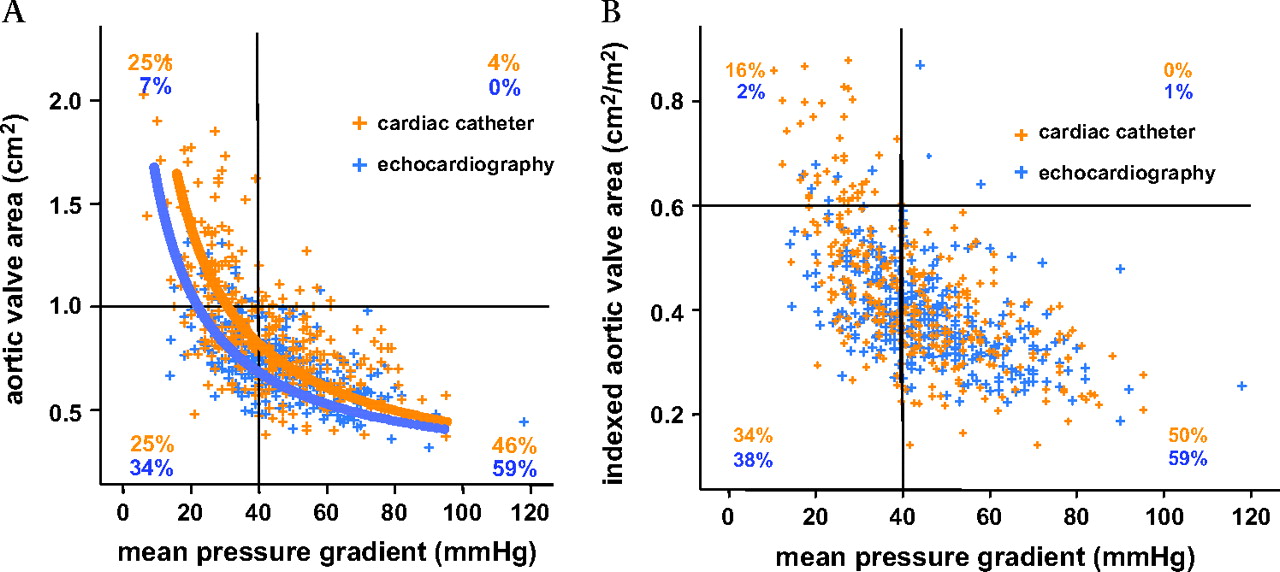
Table 1 summarises the clinical, echocardiographic and cardiac catheterisation data of the study population of 333 patients. To illustrate the frequency of inconsistent grading in patients with aortic valve stenosis individual values for AVA were plotted against ΔPm. The data from echocardiography (figure 1 in blue) in the 333 patients had a distribution and resultant fitted curve virtually identical to the findings in the original 3483 echocardiographies
Clinical, echocardiographic, and catheterisation data of 333 patients with aortic valve stenosis (AVA<1.0 cm2) and the subgroups with inconsistent grading (catheter-derived AVA<1.0 cm2 and ΔPm<40 mm Hg) and consistent severe stenosis (AVA<1.0 cm2 and ΔPm>40 mm Hg)

Inconsistent grading of the severity of aortic valve stenosis in echocardiography and cardiac catheterisation. Aortic valve area (AVA) is plotted against mean pressure gradient (ΔPm) in 333 patients with aortic valve stenosis and normal left ventricular systolic function. (A) The fitted curves for data from cardiac catheterisation (orange) and echocardiography (blue) are presented. Quadrants are based on cut-off values for severe aortic stenosis as stated in current American guidelines.1 Data pairs positioned in the right lower quadrant (AVA<1 cm2 and ΔPm>40 mm Hg) indicate consistent grading and data pairs in the left lower quadrant (AVA<1 cm2 and ΔPm≤40 mm Hg) indicate inconsistent grading of severe aortic valve stenosis. The percentage of patients in each quadrant is given with, for example, cardiac catheterisation resulting in inconsistent grading (AVA<1 cm2 and ΔPm≤40 mm Hg) in 25% of patients. (B) Data pairs for indexed aortic valve area with the cut-off value of 0.6 cm2/m2 are depicted.
Patient percentages and numbers (in brackets) according to type of assessment, severity of aortic valve stenosis, and stroke volume index
The data pairs for AVA and ΔPm derived from cardiac catheterisation are shown in figure 1 in orange. Regression analysis yielded a fitted curve at
Low stroke volume
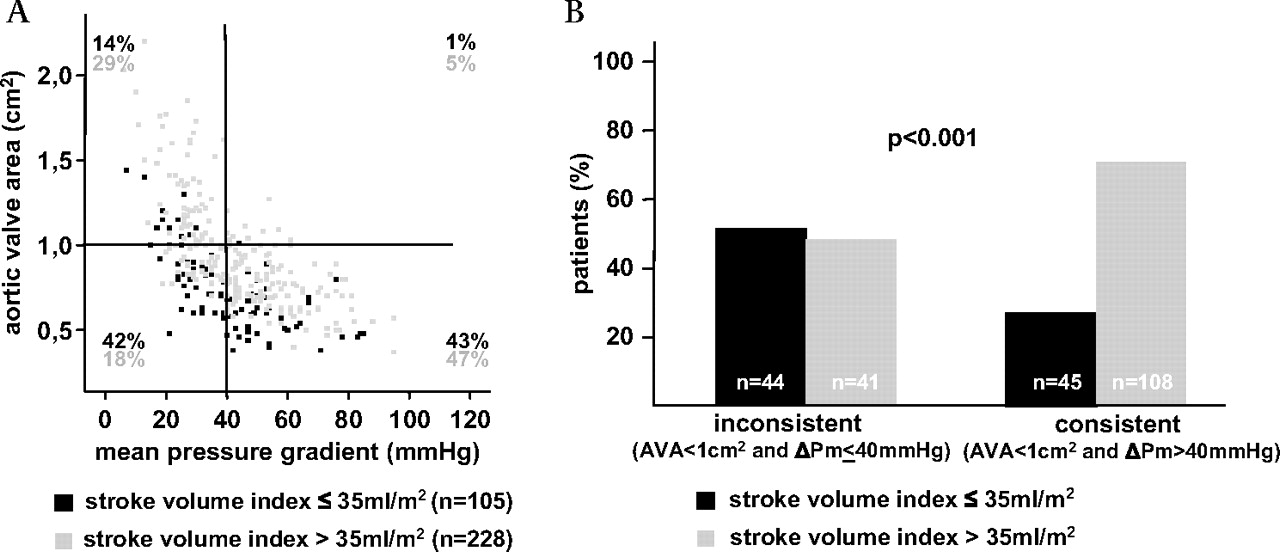
To assess a possible role of low stroke volume and to overcome the limitations of its strongly LVOT-dependent echocardiographic assessment we plotted AVA versus ΔPm from cardiac catheterisation distinguishing between patients with a stroke volume index ≤35 ml/m2 and >35 ml/m2. Figure 2A illustrates that in the population of 333 patients low stroke volume is found in patients with mild–moderate stenosis, as well as in consistently and inconsistently graded patients. However, low stroke volume was significantly more common in inconsistently graded than consistently graded patients (44/85 (52%) vs 45/153 (29%), p<0.001, figure 2B and table 2). Therefore 52% of inconsistently graded patients could be diagnosed with severe stenosis due to reduced stroke volume.

Low stroke volume (stroke volume index ≤35 ml/m2) despite apparently normal left ventricular systolic function as diagnosed during cardiac catheterisation in 333 patients with aortic valve stenosis. (A) The percentage of patients in each quadrant is given with, for example, 42% of patients with a stroke volume index ≤35 ml/m2 and 18% of patients with a stroke volume index >35 ml/m2 demonstrating inconsistent grading (AVA<1 cm2 and ΔPm≤40 mm Hg, left lower quadrant). (B) In the 85 patients with inconsistent grading (AVA<1 cm2 and ΔPm≤40 mm Hg) low stroke volume is significantly more frequent than in the 153 patients with consistent grading (AVA<1 cm2 and ΔPm>40 mm Hg, right lower quadrant, 44/85 vs 45/153, p<0.001). AVA, aortic valve area; ΔPm, mean pressure gradient.
Extent of inconsistencies
On the other hand figure 2B demonstrates that 41/85 (48%) inconsistently graded patients had a normal stroke volume index. Low stroke volume can therefore only partially explain the phenomenon of inconsistent grading. Substituting standard values for cardiac output (6 l/min), systolic ejection period (0.33 s), and heart rate (70/min) into the Gorlin formula yields the equation

Extent of inconsistent grading of the severity of aortic valve stenosis in patients with low- and normal-stroke volume. (A) The fitted curves for data pairs mean pressure gradient (ΔPm) versus aortic valve area (AVA) from cardiac catheterisation for the entire study population (n=333) and limited to patients with a catheter-derived stroke volume index (SVI) >35 ml/m2 (n=228) are presented together with the hypothetical curve based on the Gorlin equation with a cardiac output of 6 l/min, a systolic ejection period of 0.33 s and a heart rate of 70/min.6 All three fitted curves intersect to the left and below the respective cut-off values of AVA 1.0 cm2 and ΔPm 40 mm Hg given in current American guidelines1 with the extent of shift to the left and to the bottom reflecting increased inconsistent grading. (B) Data from echocardiography for all patients (n=333) and limited to patients with a echocardiography-derived SVI >35 ml/m2 (n=204) show a similar but more pronounced pattern, indicating that inconsistent grading is more prevalent with non-invasive assessment of the severity of aortic valve stenosis than with cardiac catheterisation.
In our patient population inconsistent grading was significantly more common with echocardiography than with cardiac catheterisation (114/333 (33%) vs 85/333 (26%), p<0.001). Furthermore, non-linear regression of data pairs ΔPm vs AVA showed that inconsistencies were more pronounced with echocardiography, with a resultant ΔPm of 22.0 mm Hg for an AVA of 1 cm2 and an AVA of 0.74 cm2 for a ΔPm of 40 mm Hg (figure 3B broken line). Limiting the analysis to patient with an (echo-derived) stroke volume index >35 ml/m2 (n=201) yielded a ΔPm of 27.8 mm Hg for an AVA of 1.0 cm2 and an AVA of 0.80 cm2 for a ΔPm of 40 mm Hg (figure 3B dotted line), again clearly below the ΔPm of 40 mm Hg and AVA of 1.0 cm2 expected from current guidelines.
Discussion
The main finding of this study demonstrates that in the framework of current guidelines inconsistent grading of aortic valve stenosis is common, extends to cardiac catheterisation, and is only partially explained by low stroke volume despite apparently normal left ventricular systolic function.
In the management of patients with aortic valve stenosis symptoms attributable to aortic stenosis (syncope, angina and dyspnoea) determine which patient should undergo valve replacement. In symptomatic patients with comorbidities such as chronic obstructive pulmonary disease, obesity or hypertension, decision-making may prove particularly difficult owing to the non-specificity of dyspnoea. Furthermore, asymptomatic patients with severe aortic valve stenosis may benefit from surgery in the presence of pronounced calcification or rapid progression.10 In these settings the severity of aortic stenosis may become critical in deciding whether a patient should be subjected to the risk of valve replacement. Defining consistent cut-off values for severe aortic stenosis as a possible indicator for surgery is therefore paramount.
Hachicha and coworkers4 have shown that on non-invasive testing, ‘paradoxical’ low flow despite preserved left ventricular function may be indicative of more advanced disease. Therefore, patients with inconsistent grading and reduced stroke volume may represent a subgroup for whom early valve replacement may be particularly beneficial. On the other hand, in this study half of patients with inconsistent grading had normal stroke volume, indicating that an AVA of 1.0 cm2 usually does not relate to a ΔPm of 40 mm Hg, a fact that—assuming normal cardiac output—can be predicted from the Gorlin equation.6 In these patients (AVA<1 cm2, ΔPm≤40 mm Hg, stroke volume index >35 ml/m2) the indication for valve replacement is not straightforward, particularly in the presence of symptoms that cannot be clearly attributed to aortic stenosis. The discrepancy of grading even in the presence of normal flow may require ‘harmonisation’ of currently used cut-off values for AVA in comparison with ΔPm. According to the data presented here, indexing AVA for body surface area and applying the cut-off values from current guidelines (indexed AVA<0.6 cm2/m2 and ΔPm>40 mm Hg) increases the percentage of patients with inconsistent grading.
This analysis highlights the discrepancies within different parameters (AVA and ΔPm) for the quantification of aortic valve stenosis independently of the methods (echocardiography and catheterisation) by which they were obtained. Consequently, no conclusions can be drawn from our data about which method is more suitable or accurate for the grading of aortic valve stenosis. However, our data show a significantly higher percentage of inconsistently graded patients with echocardiography (34%) than with cardiac catheterisation (25%), which may be explained by at least three observations. First, the Gorlin equation yields an anatomical AVA, whereas the continuity equation calculates an effective AVA, which is smaller owing to continued convergence of the stenotic jet distal to the stenotic orifice. Second, the Gorlin equation uses a constant for the transformation from effective to anatomical AVA, which may be inadequate in a number of clinical situations.8 Third, an overestimation of AVA during cardiac catheterisation may result from pressure recovery.11 With respect to cut-off values for the severity of aortic valve stenosis more conservative values may be appropriate for an AVA derived from echocardiography than cardiac catheterisation.
Estimation of stenosis severity in patients with preserved left ventricular function requires accurate differentiation between low and normal stroke volume. Nowadays, the severity of aortic stenosis is assessed by Doppler echocardiography in the majority of patients. As outlined in the introduction small errors in the measurement of the LVOT diameter will cause a substantial error in stroke volume and AVA. In addition, a more elliptical rather than circular shape of the LVOT may lead to underestimation of stroke volume and AVA.12–14 Thus, echocardiographic data may overestimate the number of patients with low-flow severe aortic valve stenosis. In an individual patient, meticulous assessment of the LVOT area is mandatory for a reliable calculation of both stroke volume and AVA. To overcome the uncertainties of transthoracic echocardiography a transoesophageal approach will frequently allow for planimetry of the stenotic orifice and may help in assessment of valve morphology, calcification and LVOT diameter. The last of these can be used for the calculation of AVA and stroke volume in combination with data from transthoracic Doppler measurements, thereby allowing for the correct estimation of stenosis severity in most cases. Additional echocardiographic parameters may help to estimate an individual patient's risk including the progression of stenosis severity over time and the degree of valve calcification.10 The latter may also be evaluated by CT scanning.15 MRI may be useful in some patients with equivocal echocardiographic findings and will allow for the accurate assessment of stroke volume.16 Cardiac catheterisation may be required in selected patients; however, since passage of the stenotic valve exposes the patient to an increased risk of thrombembolism,17 the risk of this modality must be weighed critically against its potential benefits.1
The data presented here are based on a retrospective analysis with all its limitations. Although the percentage of patients with atrial fibrillation was low (5%) we cannot entirely rule out the possibility that technical difficulties in the echocardiographic and in invasive assessment of haemodynamics may have skewed the results. The echocardiographic assessment of stroke volume using mean flow velocity in the LVOT and assuming an ejection period of 0.33 s is not the recommended method. An average ejection period of 0.36 s on invasive testing both for patients with inconsistent and consistent severe stenosis (table 1) may indicate that 0.33 s represents a realistic assumption. The main finding of this paper that inconsistent grading extends to invasive testing, however, remains unchanged. Further limitations of this study include the fact that the ejection fraction was not determined routinely in patients with normal systolic function. Finally, no second method for the measurement of stroke volume (eg, MRI, Fick principle) was performed in addition to the thermodilution method, which has its own, well-recognised, limitations.1
In summary, the constellation of severe aortic valve stenosis based on AVA but non-severe stenosis based on ΔPm (inconsistent grading) is common, both with echocardiography and cardiac catheterisation. Low stroke volume despite apparently normal left ventricular systolic function contributes to this finding and should actively be investigated in these patients. Since inconsistent grading is found even in the presence of normal stroke volume, harmonisation of cut off values for severe aortic valve stenosis may be appropriate.
References
Footnotes
Linked articles 195149
Competing interests None.
Provenance and peer review Not commissioned; externally peer reviewed.