Article Text

Abstract
Objectives The co-transmitter neuropeptide Y (NPY) is released during high levels of sympathetic stimulation and is a potent vasoconstrictor. We defined the release profile of plasma NPY during acute ST elevation myocardial infarction, and tested the hypothesis that levels correlate with reperfusion measures after treatment with primary percutaneous coronary intervention (PPCI).
Design Prospective observational study.
Setting University hospital heart centre.
Patients 64 patients (62.6±11.7 years-old, 73% male) presenting throughout the 24-h cycle of clinical activity with ST elevation myocardial infarction.
Interventions PPCI.
Main outcome measures NPY was measured (ELISA) in peripheral blood taken before and immediately after PPCI and at 6, 24 and 48 h post-PPCI. Reperfusion was assessed by angiographic criteria, ST segment resolution, invasive measurement of coronary flow reserve and the index of microcirculatory resistance.
Results Plasma NPY levels were highest before PPCI (17.4 (8.8–42.2) pg/ml, median (IQR)) and dropped significantly post-PPCI (12.4 (6.5–26.7) pg/ml, p<0.0001) and after 6 h (9.0 (2.6–21.5) pg/ml, p=0.008). Patients with admission NPY levels above the median were significantly more hypertensive and tachycardic and were more likely to have diabetes mellitus. Patients with angiographic no-reflow (less than thrombolysis in myocardial infarction 3 flow and myocardial blush grade >2, n=16) or no electrocardiographic ST resolution (<70%, n=30) following PPCI had significantly higher plasma NPY levels. Patients with a coronary flow reserve <1.5 or index of microcirculatory resistance >33 also had significantly higher plasma NPY levels pre-PPCI and post-PPCI.
Conclusions Plasma NPY levels correlate with indices of reperfusion and coronary microvascular resistance.
Statistics from Altmetric.com
Introduction
The coronary microcirculation is the key determinant of reperfusion in acute ST elevation myocardial infarction (STEMI) following primary percutaneous coronary intervention (PPCI). Microcirculatory ‘no-reflow’ can be identified in nearly one-third of patients and correlates with persistent ST elevation, larger infarctions and poor ejection fraction and prognosis1 ,2 There is an important mechanical component of the no-reflow phenomenon, which arises from distal atherothrombotic embolisation from the ruptured plaque after PPCI. This is compounded by ischaemic endothelial injury and the infiltration and activation of leucocytes and platelets, and together with myocardial oedema can obstruct capillary lumens.3 There is also a functional vasoactive component of no-reflow in PPCI patients which is incompletely understood, although a range of substances have been implicated including endothelin-1,4 thromboxane A25 and B-type natriuretic peptide.6
Neuropeptide Y (NPY) is a 36 amino acid peptide with a relatively long half-life, abundant in the peripheral sympathetic nervous system. Following prolonged sympathetic activation, it is released from cardiac sympathetic nerve endings along with the main neurotransmitter norepinephrine7 where it can act as a co-transmitter and local neuromodulator of several aspects of cardiac function. NPY is a potent vasoconstrictor which may be involved in the pathogenesis of atherosclerosis,8 in addition to maintaining cardiac contraction, promoting ventricular remodelling9 and reducing parasympathetic nerve activity.10 When infused directly into coronary arteries in humans, NPY induces vasoconstriction of the microvasculature11 and plasma levels have been associated with the degree and duration of postexercise ST segment depression.12 Animal studies suggest that cardiac NPY is released from sympathetic nerves during experimentally induced myocardial infarction13 and studies in humans have shown that plasma NPY levels are elevated following acute coronary syndromes and during left ventricular failure where they correlate positively with the severity of heart failure and 1 year mortality14 ,15 Whether NPY contributes to microvascular function and reperfusion in the context of STEMI has not been established.
The aim of this study was to describe the dynamics of plasma NPY release in STEMI patients undergoing PPCI and evaluate if levels relate to non-invasive and invasive measures of myocardial reperfusion.
Methods
Patients with STEMI who underwent PPCI at the John Radcliffe Hospital in Oxford were prospectively enrolled between October 2010 and June 2011 (Oxford Studies In Acute Myocardial Infarction (Ox-AMI) Cohort). STEMI was defined as chest pain continuing for >30 min and ST elevation ≥ 2 mm in ≥2 contiguous chest leads or ≥1 mm in ≥2 contiguous limb leads. Exclusion criteria were symptom duration >12 h, the presence of cardiogenic shock and contraindication to the use of adenosine. The study was conducted in accordance with the Declaration of Helsinki and approved by the local ethics committee (REC number 10/H0408/24). All participants gave written informed consent.
Coronary intervention and evaluation of coronary microcirculation
PPCI was performed according to contemporary international guidelines. Patients received oral aspirin (300 mg) and thienopyridines (600 mg clopidogrel or 60 mg prasugrel) preprocedure. Thrombus aspiration and use of abciximab (ReoPro, Eli Lilly, USA) before predilatation and stent deployment were recommended but performed at the discretion of the primary operator.
All coronary angiograms were recorded with the aim of allowing offline analyses. Coronary flow was graded using the standard thrombolysis in myocardial infarction (TIMI) criteria, while corrected TIMI frame count was measured according to Gibson et al.16 Myocardial blush grade (MBG) at the end of the procedure was evaluated according to van't Hof et al.17 Angiographic no-reflow was defined as TIMI flow less than grade 3 and/or TIMI 3 flow with MBG less than 2 at completion of the procedure. Angiographic analysis was performed by two interventional cardiologists and disagreement resolved by consensus.
At the end of the PPCI procedure, a pressure wire (Certus, St Jude Medical, St. Paul, Minnesota, USA) was placed in the distal third of the infarct-related artery to perform invasive assessment of the coronary microcirculation. Coronary flow reserve (CFR) and the index of microcirculatory resistance (IMR) were measured using previously described methods.18 Briefly, the shaft and the sensor near the tip of the pressure wire act as thermistors and by detecting changes in temperature after the injection of room-temperature saline transit times. The mean transit time (Tmn) was calculated from three injections of 5 ml room-temperature saline through the guiding catheter. Tmn was recorded at baseline and after induction of hyperaemia with intravenous adenosine infusion (140 µg/kg/min) into the right femoral vein. Simultaneous measurements of mean aortic pressure (Pa, by guiding catheter) and mean distal coronary pressure (Pd, by pressure wire) were made in the resting and maximal hyperaemic states. CFR was calculated as the ratio of the transit times at baseline and hyperaemia. IMR is defined as the simultaneously measured distal coronary pressure multiplied by the hyperaemic Tmn (mm Hg. s). Fractional flow reserve is defined as the ratio of the pressure distal to a lesion relative to the pressure proximal to it during maximal hyperaemia.
Electrocardiographic analysis of ST resolution
For assessment of preprocedural ST elevation the ECG with the maximal ST elevation (performed by paramedics or in the accident & emergency department) was taken. For postprocedural ST analysis the ECG was recorded 60 min after PPCI. Two readers blinded to clinical and angiographic results performed measurements. The absolute level of ST elevation was measured with digital callipers to the nearest 0.01 mV, 20 ms after the end of the QRS interval. The sum of preprocedural and postprocedural ST elevation was calculated for anterior (V1–V6, I and aVL) and non-anterior (II, III, aVF, V5, V6) infarctions. For statistical analysis, summed ST resolution parameters were categorised as complete (>70%) and incomplete (<70%).
Blood tests
Peripheral venous blood samples were obtained in all patients on admission, following PPCI and again at 6h, 24h and 48 h following PPCI. Blood was collected using standardised tubes containing dipotassium ethylenedinitro tetraacetic acid and centrifuged at 9000 g for 1 min. before being immediately snap frozen in liquid nitrogen and stored at −80°C until being assayed. NPY was measured using a commercially available ELISA kit (EZHNPY-25K, Millipore, USA), according to the manufacturer's instructions with a lower limit of detection of 3 pg/ml. Cardiac troponin I measurements were performed using automated chemiluminescent immunoassay techniques on the Siemens ADVIA Centaur (Siemens Healthcare Diagnostics, Frimley, UK). The area under the curve (AUC) analysis was calculated using the trapezoidal rule.
Statistical analysis
Normally distributed parameters are reported as mean±SD and non-normally distributed parameters as median (IQR). As NPY levels were not normally distributed non-parametric tests were used. The Mann-Whitney and Wilcoxon signed rank tests were used for unpaired and paired comparisons, respectively. Analysis of variance (ANOVA) was used to compare values of more than two groups. For normally distributed values we then used the Bonferroni post hoc test, whereas Scheffe's test was used for post hoc analysis of non-normally distributed values. Comparison of nominal variables was performed using the χ2 test. Statistical analyses were performed with Statview V.5.0 for Windows and Prism Software, V.5.0 for Mac OS X. A p value of <0.05 was considered statistically significant.
Results
A total of 95 consecutive patients with acute STEMI (presenting throughout the 24 h cycle of clinical activity) were screened for inclusion. Seventy-one patients were recruited and underwent invasive assessment of the coronary microcirculation at PPCI and complete plasma NPY levels blood sampling obtained in 64 patients (90%). The baseline characteristics and PPCI details of these 64 patients are summarised in table 1. The majority were male presenting with left anterior descending artery infarcts with a mean pain-to-balloon time of 215±175 min and mean door-to-balloon time of 20±14 min. Angiographic no-reflow was found in a quarter of all patients.
Baseline characteristics of the study population (n=64)
Plasma NPY levels following PPCI
The evolution of NPY levels over the first 48 h of STEMI treated by PPCI is shown in figure 1. NPY levels at presentation (prior to PPCI) were 17.4 (8.8–42.2) pg/ml and dropped significantly immediately post-PPCI (12.4 (6.5–26.7) pg/ml, p<0.0001) and again at 6 h after PPCI (9.0 (2.6–21.5) pg/ml, p=0.008 compared with post-PPCI) but did not change significantly thereafter.

Evolution of plasma neuropeptide Y (NPY) levels over the first 48 h of ST elevation myocardial infarction treated by primary percutaneous intervention (PPCI). Raw data shown with medians (horizontal line) and the IQR. NPY values dropped significantly in the first 6 h (pre-PPCI vs post-PPCI, p<0.001; post-PPCI vs 6 h, p=0.008) but stayed stable thereafter (6 h vs 24 h, p=0.91, 24 h vs 48 h, p=0.88).
Clinical and angiographic characteristics of patients with admission NPY plasma values less than and greater than the median are summarised in table 2. Patients with admission NPY values greater than the median were more likely to be female, diabetic and without known coronary artery disease, as well as being more hypertensive and tachycardic. There was also a trend towards angiographic no-reflow and higher AUC troponin I release in this group.
Clinical and angiographic characteristics according to the median neuropeptide Y (NPY) levels pre-primary percutaneous intervention (PPCI)
Plasma NPY levels and electrographic ST resolution
Complete ST resolution was achieved in 34/64 patients (53%). NPY values post-PPCI and at 6 h were significantly higher in patients without >70% cumulative ST resolution at 60 min after PPCI (figure 2).
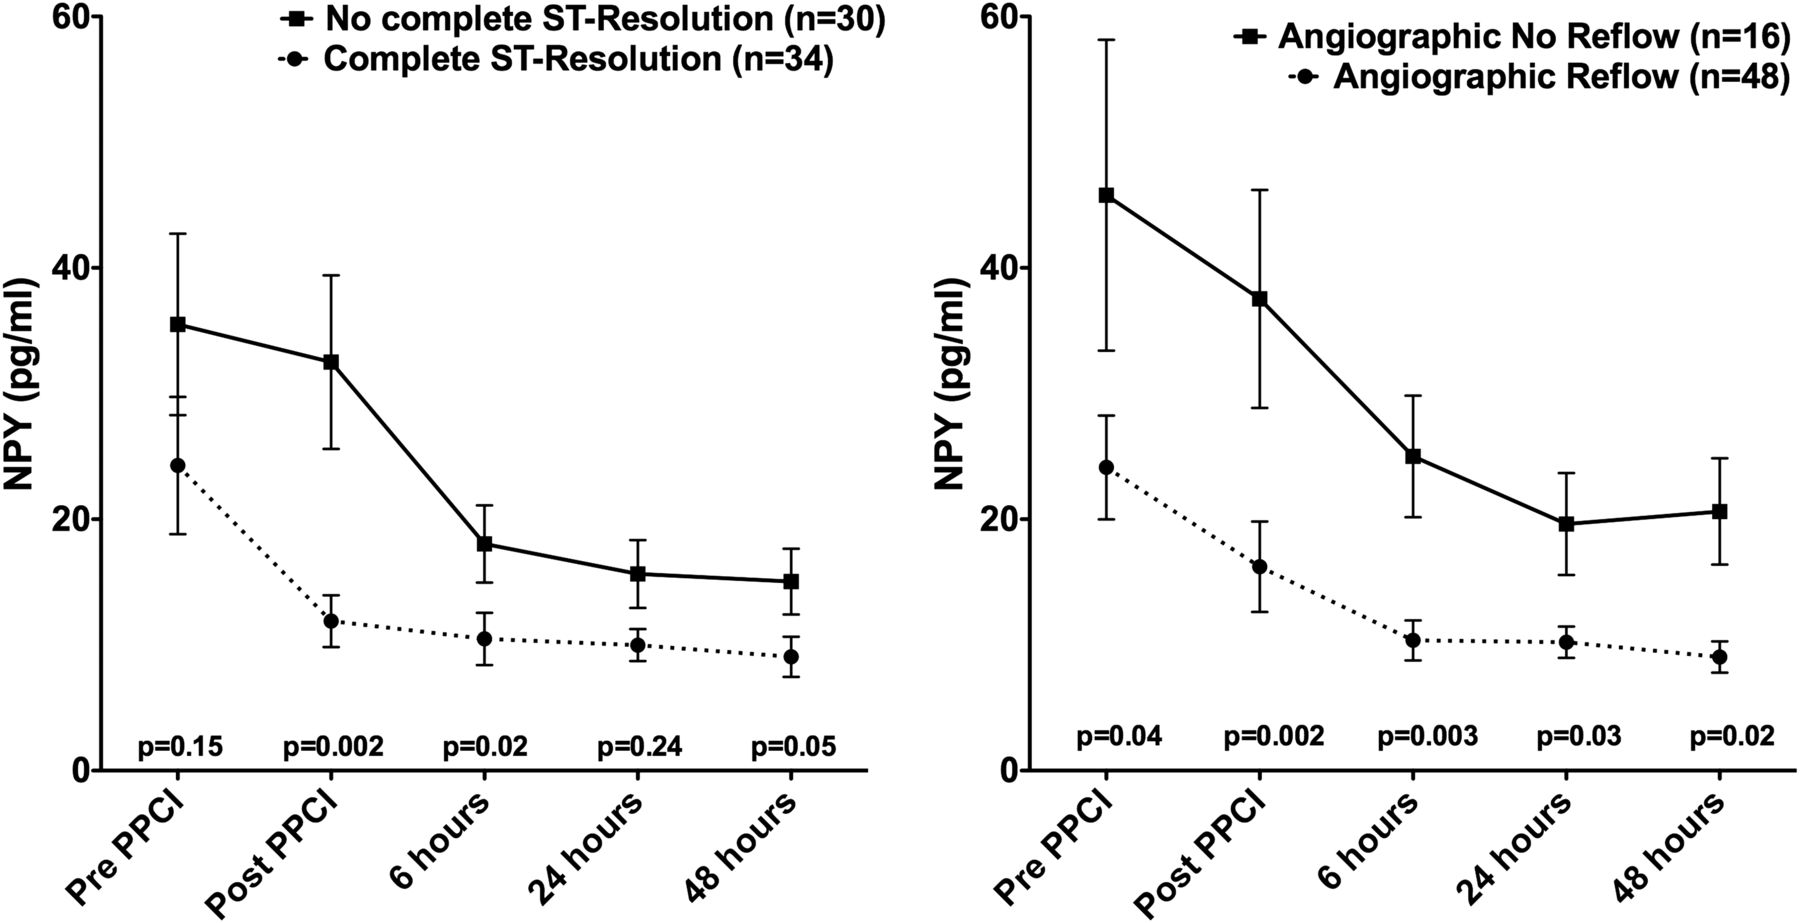
Plasma neuropeptide Y (NPY) levels (mean values, bars representing the SE of mean) according to resolution of ST elevation and angiographic reflow. NPY values between angiographic reflow/no-reflow and resolution/no resolution of the ST segment were compared using non-parametric testing (Mann-Whitney).
Plasma NPY levels and angiographic no-reflow
Angiographic reflow (TIMI 3 and MBG >2) was achieved in 48/64 (75%) patients. Patients with angiographic no-reflow had significantly higher NPY values at all five time points but the greatest difference was reached immediately post-PPCI and at 6 h. Furthermore, 55/64 (86%) had TIMI 3 flow at the end of the procedure: admission NPY values (16.2 (8.5–32.0) vs 42.2 (20.6–61.8) pg/ml, p=0.04) and post-PPCI values (9.6 (5.4–20.5) vs 28.9 (15.9–68.9) pg/ml, p=0.02) were significantly lower in this group.
Plasma NPY levels and invasive measures of the coronary microcirculation
The results of invasive measures of the coronary microcirculation at the end of PPCI are presented in table 3 according to the median NPY level at this time point. CFR was significantly lower in patients with post-PPCI NPY values higher than the median suggesting a greater level of vasoconstrictor tone. Median IMR values did not show a significant difference at this time point.
Invasive measures of coronary physiology according to median neuropeptide Y (NPY) levels immediately post-primary percutaneous intervention (PPCI)
We stratified patients by median values of CFR. Median CFR was 1.5. Patients with CFR >1.5 had lower values of NPY compared with those patients with values <1.5 at admission and after PPCI. These results were similar for the groups stratified by a median IMR value of 33 (figure 3).

Plasma neuropeptide Y (NPY) levels (mean values, bars representing the SE of mean) according to median coronary flow reserve and median index of microvascular resistance. NPY values between CFR <1.5/>1.5 and IMR <33/>33 compared using non-parametric testing (Mann-Whitney). PPCI. primary percutaneous intervention.
Relationships of infarct size and measures of coronary microcirculation and plasma NPY levels
We stratified the group by tertiles of infarct size as determined by log AUC troponin I (range: low tertile (-0.87–1.82); mid tertile (1.87–2.38); top tertile (2.39–3.09)). As demonstrated in figure 4, log NPY levels differed significantly between patients with low tertile and those with mid or top tertile infarct size (ANOVA, p=0.04 and p=0.029 for low vs mid tertile and p=0.025 for low vs top tertile infarct size).

Log plasma neuropeptide Y (NPY) levels according to tertiles of myocardial infarction size. Infarct size was assessed using log area under the curve (AUC) troponin (AUC from following measurements: pre-primary percutaneous intervention (PPCI), post-PPCI, 6 h, 24 h and 48 h). Log NPY values were compared using ANOVA (p=0.04) and the differences between the groups were evaluated using Bonferroni post hoc analysis.
Discussion
The novel findings from our study are that plasma NPY levels are markedly raised in patients at presentation with STEMI, fall rapidly over the first 6 h of reperfusion and plateau over the next 48 h, although still remaining at levels higher than detected in normal physiological conditions. Furthermore, we identify a relationship with angiographic, ECG and invasive measures of reperfusion in patients undergoing PPCI: patients with angiographic no-reflow, incomplete ST resolution and impaired CFR, have significantly higher NPY levels. The results of this study suggest a role for NPY in myocardial reperfusion in the early stage of STEMI.
Plasma NPY levels following PPCI
Several studies published over 20 years ago established that plasma NPY levels are raised in acute coronary syndromes, especially in the presence of congestive cardiac failure19 where levels above 255 pg/ml (or 60 pmol/l)14 correlate with 1 year mortality. These studies were conducted before the advent of emergency PCI and before the current range of pharmacological treatments had been established. The inhospital death rate in these studies was high (>10%) compared with our population where there were no inhospital deaths (though patients with cardiogenic shock were excluded from the study). While some studies from this era describe plasma NPY levels falling within 25 h of admission, others show NPY levels peaking at 3 days after myocardial infarction20 which may reflect differences in treatments and the degree of congestive cardiac failure. Importantly, many of these older studies used radioimmunoassays to detect NPY with a higher limit of detection (>90 pg/ml compared with our 2–3 pg/ml) and had more cross-reactivity with related peptides and peptide fragments such that only ‘NPY-like immunoactvitiy’ could be reported. This lack of sensitivity and specificity in a historical population emphasises the importance of our contemporary data.
While plasma catecholamine and cortisol levels vary diurnally in healthy subjects by at least 70%21 and 200%,22 respectively, plasma NPY levels have a minor circadian variation of less than 10%22 making them a useful tool for assessing sympathetic drive. The PPCI patients in this study presented randomly throughout a 24-h cycle and all patients showed similar kinetics with median values falling by 48% from admission to 6 h post-PPCI and then stabilising (while remaining elevated) over the subsequent 48-h period. By comparison, the median plasma NPY level in 303 normal adult subjects (using an assay with a similar level of detection to ours and minimal cross-reactivity) is <2 pg/ml.23 It is likely that these changes are an accurate reflection of the reduction in sympathetic drive following treatment of a life-threatening STEMI, but the reasons for ongoing elevated levels remain to be determined.
Patients with admission NPY levels above the median were hypertensive and tachycardic in keeping with previous observations that NPY is a vasoconstrictor released during high-level sympathetic stimulation that can also inhibit parasympathetic neurotransmission.7 ,10 Elevated NPY levels have been observed in animal models24 and in patients with essential hypertension25 and type II diabetes mellitus.26 In keeping with this, we also observed that significantly more patients with admission plasma NPY levels above the median were diabetic.
Plasma NPY levels, angiographic ‘no-reflow’ and invasive microvascular function
Different measures can be used to assess the degree of reperfusion after PPCI. Angiographic reflow assessment using TIMI flow/MBG scoring and ST resolution on the ECG are readily available and have been demonstrated to have prognostic importance.2 In our study, patients with angiographic reflow have significantly lower plasma NPY values at all time points compared with those without. In patients with complete ST resolution, NPY values are not significantly different before PPCI but there is a highly significant difference after PPCI indicating a possible role of NPY in successful reperfusion in STEMI.
Assessing the efficacy of reperfusion using the electrocardiogram and angiographic perfusion grade27 is indirect and has limited diagnostic accuracy for culprit artery microvascular function. More accurate assessments of microvascular damage such as contrast-enhanced cardiac MRI28 and direct invasive measures of reperfusion29 can predict myocardial salvage, infarct characteristics, left ventricular ejection fraction and prognosis in patients with STEMI. We directly assessed myocardial reperfusion using CFR and IMR. Microvascular dysfunction indicated by a higher CFR or lower IMR is associated with lower NPY levels at several time points before and after PPCI. Interestingly, NPY levels tend to fall early in patients with successful reperfusion; otherwise NPY levels remain high possibly indicating continued production due to higher sympathetic stress. There is much evidence that global and cardiac sympathetic drive is elevated during acute myocardial infarction and it may be that cardiac release of NPY causes a degree of vasoconstriction in the microvascular bed of even non-culprit epicardial coronary arteries as well as the ischaemic region. High extracellular potassium levels due to cellular necrosis are likely to causes persistent depolarisation of local sympathetic neurons and maintain a regionally high level of NPY in the peri-infarct area.
Taken together, these findings suggest that circulating NPY levels at the time of presentation and during the first 6 h after PPCI are associated which a range of important indices of reperfusion. It is premature to speculate whether the NPY levels are causal in this situation, and we did not directly measure cardiac NPY release via coronary sinus blood sampling. While a coronary arterial/venous blood sample difference would be a more precise measure, clinically it is difficult to obtain compared to a peripheral blood sample and can only be performed at the time of PCI.
To our knowledge this is the first description of the association between plasma NPY and indices of reperfusion and raises the possibility for further investigation of this pathway and its clinical importance. We show a significant correlation between the AUC NPY and infarct size, and demonstrate that the third of patients with smallest infarction had lower NPY levels compared with those in the middle or upper third. We speculate that maintained microvascular vasoconstriction post-PPCI by NPY may contribute to a larger infarct size and poorer prognosis. If this is the case, NPY receptor antagonism may be beneficial postrevascularisation in PPCI to improve angiographic reflow. A recently developed competitive Y1 receptor antagonist administered as an intravenous infusion has been tested in patients with stable angina but did not impact on exercise induced ischaemic parameters at the dose used.30 Whether intracoronary infusion of this or similar compounds improve microvascular function, reduce infarct size and impact on prognosis remains to be established.
Acknowledgments
We are very grateful to the patients who participated. This study would also not have been possible without the tireless support of the coronary care unit and catheter laboratory staff at the John Radcliffe Hospital.
References
Footnotes
-
Contributors FC and NH are joint first authors. All authors are familiar with the primary data and have contributed to the preparation of the manuscript.
-
Funding This work was supported by an Oxford Health Services Research Committee (OHSRC: 967) grant (NH) and an Oxford Biomedical Research Centre grant (RKK/APB). NH also acknowledges support from the BHF Centre of Research Excellence (RE/08/004), Oxford. BDP, RPC and KMC acknowledge support from the Oxford Partnership Comprehensive Biomedical Research Centre via the Department of Health's National Institute for Health Research Biomedical Research Centre's funding scheme.
-
Competing interests None.
-
Ethics approval Local ethics committee (REC number 10/H0408/24).
-
Provenance and peer review Not commissioned; externally peer reviewed.