Article Text

Abstract
Objectives: To assess mechanisms of myocardial perfusion impairment in patients with hypertrophic cardiomyopathy (HCM).
Methods: Fourteen patients with obstructive HCM (mean (SD) age 53 (10) years, 11 men) underwent intravenous adenosine myocardial contrast echocardiography (MCE), positron emission tomography (PET) and cardiac catheterisation. Fourteen healthy volunteers (mean age 31 (4) years, 11 men) served as controls. Relative myocardial blood volume (rBV), exchange flow velocity (β), myocardial blood flow (MBF), MBF reserve (MFR) and endocardial-to-subepicardial (endo-to-epi) MBF ratio were measured from the steady state and contrast replenishment time–intensity curves.
Results: Patients with HCM had lower rest MBF (for LVRPP-corrected)—mean (SD) (0.92 (0.12) vs 1.13 (0.25) ml/min/g, p<0.01)—and hyperaemic MBF—(2.56 (0.49) vs 4.34 (0.78) ml/min/g, p<0.01) than controls. Resting rBV was lower in patients with HCM (0.094 (0.016) vs 0.138 (0.014) ml/ml), and during hyperaemia (0.104 (0.018) ml/ml vs 0.185 (0.024) ml/ml) (all p<0.001) than in controls. β tended to be higher in HCM at rest (9.4 (4.6) vs 7.7 (4.2) ml/min) and during hyperaemia (25.8 (6.4) vs 23.1 (6.2) ml/min) than in controls. Septal endo-to-epi MBF decreased during hyperaemia (0.86 (0.15) to 0.64 (0.18), p<0.01). rBV was inversely correlated with left ventricular (LV) mass index (p<0.05). Both hyperaemic and endo-to-epi MBF were inversely correlated with LV end-diastolic pressure, LV mass index, and LV outflow tract pressure gradient (all p<0.05). MCE-derived MBF correlated well with PET at rest (r = 0.84) and hyperaemia (r = 0.87) (all p<0.001).
Conclusions: In patients with HCM, LV end-diastolic pressure, LV outflow tract pressure gradient, and LV mass index are independent predictors of rBV and hyperaemic MBF.
- myocardial perfusion
- hypertrophic obstructive cardiomyopathy
- myocardial contrast echocardiography
- positron emission tomography
Statistics from Altmetric.com
- myocardial perfusion
- hypertrophic obstructive cardiomyopathy
- myocardial contrast echocardiography
- positron emission tomography
Impaired hyperaemic perfusion despite normal epicardial coronary arteries is a hallmark of patients with hypertrophic cardiomyopathy (HCM), which is indicative of microvascular dysfunction.1 The extent of microvascular dysfunction independently predicts prognosis in patients with HCM.1 2 Several mechanisms have the potential to contribute to myocardial microcirculatory abnormalities in HCM such as reduced capillary density and vascular remodelling,3 4 and extravascular forces such as wall stress and left ventricular (LV) end-diastolic pressure (LVEDP).5 However, the amount contributed by these factors is not well known. Microvascular dysfunction in patients with HCM has been demonstrated by histological examinations,4 single-photon emission tomography,6 and positron emission tomography (PET).7 8 However, a simple bedside technique which can be repeated during follow-up of disease progression is necessary. Myocardial contrast echocardiography (MCE) has the potential for quantification of myocardial perfusion at a microvascular level.9 Studies comparing MCE perfusion imaging with nuclear stress testing showed good correlations.9–11
Recently, it has been shown that MCE accurately measures the myocardial blood flow (MBF) through determination of the underlying microvascular variables, relative blood volume (rBV), and its exchange frequency or velocity (β) in a volumetric model of ultrasound contrast agents kinetics.12 Since contrast agents are pure intravascular tracers the rBV corresponds to the intravascular volume fraction and thus reflects the capillary density. β reflects the turnover of rBV and is a measure of the resistance to MBF.12 13 The current study sought to assess microvascular response to vasodilator stress in HCM, to clarify whether rBV or β contributes to abnormal flow reserve, and to examine haemodynamic and morphological determinants of microvascular volume and velocity using real-time MCE.
PATIENTS AND METHODS
Study group
The study included 14 consecutive patients (table 1) with obstructive HCM (mean (SD) age 53 (10) years, 11 men). All patients had New York Heart Association functional class III with or without angina and a peak left ventricular outflow tract gradient (LVOTG) ⩾50 mm Hg at rest or provocation. The study protocol consisted of standard two-dimensional echocardiography, invasive LV pressure measurements, MCE, and PET. All patients had normal epicardial coronary arteries and none had diabetes. Drugs such as β blockers and calcium antagonists were discontinued 48 hours before the stress test. Fourteen healthy volunteers (mean (SD) age 31 (4) years, 11 men) who had a normal medical history, normal physical examination, normal electrocardiogram, and normal standard transthoracic two-dimensional echocardiography served as a control group. None of the healthy volunteers had diabetes mellitus or dyslipidaemia. All subjects gave informed consent, and the hospital review board approved the study protocol.
Echocardiography
All patients underwent a standard two-dimensional echo-Doppler examination using a Sonos 7500 ultrasound system (Philips, Best, The Netherlands) in accordance with the guidelines,14 including continuous- and pulsed-wave Doppler recording of LVOTG (at rest and after Valsalva manoeuvre), mitral inflow and other Doppler variables.15 Mitral regurgitation was graded on a scale from 0 (no regurgitation) to 4 (severe regurgitation). M-mode measurements of septal and posterior wall thickness, and LV dimensions were obtained in accordance with the guidelines.16 LV end-diastolic and end-systolic volumes, and LV ejection fraction (by modified bi-plane Simpson rule) were calculated from the apical four-chamber and two-chamber views. An LV mass index (LVMI) was assessed with the two-dimensional area–length method, as previously described.17
Invasive measurements
Coronary angiography was performed, which excluded significant coronary artery disease in all patients. LVEDP, LV end-systolic pressure and peak LVOTG were determined.
Real-time MCE
Image acquisition
All studies were performed by a single expert sonographer (WBV) in accordance with the guidelines.18 MCE was performed using a continuous infusion of SonoVue (Bracco, Geneva, Switzerland), at a mean rate of 1.0 ml/min. A parallel infusion of 0.9% saline at a rate of 250 ml/h was performed with the same infusion set. The infusion rate was adjusted to obtain maximal opacification of the LV myocardium and to minimise basal attenuation because of intracavitary contrast. Image acquisition was started before contrast injection and during 4 minutes of continuous infusion of SonoVue, to allow for steady blood concentration of the microbubbles. Images were acquired with the Sonos 7500 ultrasound system equipped with a broadband 1.8–4 MHz transducer. Machine settings were adjusted before contrast imaging for optimal gain and colour settings and kept constant throughout the study. Furthermore, contrast image acquisitions were recorded with a low mechanical index (0.1). These settings were interrupted with transient bursts of high mechanical index (1.8) (flash imaging) manually triggered at peak contrast intensity to allow for destruction of microbubbles within the LV myocardium. After these flashes were applied, images were recorded for 15 cardiac cycles, representing contrast replenishment within the LV myocardium. Image acquisition was done during quiet respiration to minimise cardiac motion, and images from the same part of the respiratory cycle were considered for analysis. All data were digitally stored and sent to a separate workstation for offline analysis. Stress images were recorded after 8 minutes of adenosine infusion at a rate of 140 μg/kg/min. During the stress study, heart rate and blood pressure were recorded every 3 minutes.
Data analysis
Images were analysed using QLAB (Philips, Best, The Netherlands) quantification software. MCE recordings were performed in standard apical views. End-systolic images were selected and fixed-size regions of interest (ROIs) were manually drawn according to segments defined by a standard 16-segment model.19 In addition ROIs were placed in the LV cavity, adjacent to each ROI in the LV myocardium to compensate for intracavitary contrast intensity. Then, contrast time–intensity curves were calculated for each available LV segment, as previously described.9 Logarithmic signal compression was removed, and linearised signal intensity data were expressed in arbitrary units. The absolute MBF was calculated using the model described by Vogel et al.12 In brief, absolute MBF is calculated from the formula:
MBF = rBV × β/ρΤ = (A/ALV) × β/ρΤ
where rBV is the relative blood volume pool and can be calculated by dividing the plateau intensity of myocardial contrast (A) by the maximal intensity of the adjacent LV ROI contrast (ALV); β is the exchange frequency or velocity of this blood volume calculated from refill curves after microbubbles flash destruction; ρΤ is the myocardial density in grams and equal to 1.05 g. Myocardial intensity data were corrected for non-contrast signals arising from the tissue by subtracting the signal intensity of the first frame after destruction of microbubbles. β (/s) was derived from the frames after destruction of microbubbles and was then transformed into a value/min. Signal averaging of all but the frames during destruction of microbubbles, including the first one after the destruction, yielded the signal intensity of the left ventricle ALV.
Absolute quantification of MBF
MBF was calculated in ml/min/g from rBV (ml/ml) and β (/s), which is converted to minutes and in accordance with PET, ρT was set to 1.05 g/ml. As resting MBF is related to the rate–pressure product (RPP), corrected resting MBF (MBF/RPP.10K) was also determined. Myocardial flow reserve (MFR) was calculated by dividing hyperaemic and resting values. Values of LVRPP ((peak LVOTG + systolic blood pressure) × heart rate) were used for correction.
Transmural MBF distribution
Two ROIs were manually drawn in the mid-septal and mid-lateral area, one over the subendocardium (endo), and the other over the subepicardium (epi); a third ROI was placed in an LV cavity as stated before. MBF values were calculated for both regions, both at rest and during hyperaemia. The subendocardial to subepicardial (endo-to-epi) MBF ratio at rest, during hyperaemia and endo-to-epi MFR were calculated.
Positron emission tomography
Data acquisition
PET studies were performed using a two-dimensional mode scanner (ECAT Exact HR+, Siemens/CTI, Knoxville, Tennessee, USA). A 10-minute transmission scan, using three rotating 68Ge line sources together with sinogram windowing, was performed after a short transmission scan for patient positioning. After the transmission scan, 1100 MBq of H215O dissolved in 5 ml of saline was injected intravenously, followed by a 40 ml saline flush at a rate of 4 ml/s (bolus injection). A dynamic scan was acquired consisting of 40 frames with variable frame length for a total duration of 10 minutes (12×5, 12×10, 6×20, and 10×30 seconds). All patients were constantly monitored with single-lead electrocardiography, and blood pressure was measured every 3 minutes. After the rest study, a hyperaemia study was performed during infusion of adenosine at a rate of 140 μg/kg/min. Emission data were corrected for physical decay of 15O, dead time, scatter, randoms, and photon attenuation. Reconstruction of the H215O emission sinograms was performed using filtered back projection with a Hanning filter at 0.5 of the Nyquist frequency, resulting in a transaxial spatial resolution of about 7 mm full width at half maximum.
Data analysis
ROIs were defined on parametric short-axis MBF images, generated as described previously.20 At the basal and mid-ventricular level, these ROIs divided each short axis in six equidistant sectors angulated 60° apart, starting from the posterior insertion of the right ventricular free wall into the LV myocardium. At the apical level, one ROI was defined. For each patient, corresponding ROIs from a variable number of slices were grouped to compose 13 volumes of interest (six basal, six mid-ventricular, and one apical). Additional ROIs were defined in the LV and right ventricular chamber for image-derived input functions. The complete set of ROIs was projected onto the dynamic H215O images to generate time–activity curves. Using the standard single compartment model, MBF (ml/min/ml perfusable tissue) was determined from these time–activity curves. The values were corrected for myocardial density (1.05 g/ml), hence MBF values were expressed in ml/min/g. Corrections were made for LV and right ventricular spillover effects using the method described by Hermansen et al.20 Global MBF was calculated by grouping all volumes of interest. MFR and resting MBF (LVRPP-corrected) were calculated as mentioned previously.
Comparison of MCE and PET
For comparison of MCE and PET, a 13-segment model was used comprising 12 ROIs (six basal and six mid-ventricular) and one apical segment as previously described by our group.13 For each patient, PET-derived mean global MBF, regional MBF values of the three anatomical (septal, lateral and anteroapical) territories and transmural (endo-to-epi) mean rest and hyperaemic MBF were compared with the corresponding MCE values.
Statistical analysis
Data were expressed as mean (SD). Paired and unpaired t tests were used to compare dependent and independent samples. Correlations were assessed using linear regression, and agreement was confirmed by the Bland–Altman analysis.21 Univariate and multivariate regression analyses were used to determine the measures that could predict the impairment in hyperaemic MBF. In the multivariate analyses, a stepwise forward selection procedure was used, with an entry probability for each variable set at 0.05. Significance was set at p<0.05. All statistics were performed using SPSS (12.0.2) for Windows (Chicago, IL, USA). To determine the variability in MCE measurements, a second observer performed all MCE measurements using the dedicated software program. For assessment of intraobserver variability, the first investigator reanalysed the whole study group 1 month after the first analysis. ROI size and method of analysis were fixed for accurate comparison. Variability, expressed as a percentage, was calculated for each patient as the absolute difference between two measurements divided by the mean of the two measurements. Each second analysis was done blinded to other results.
RESULTS
All MCE and PET studies were successfully completed. Table 1 summarises the baseline clinical and echocardiographic characteristics for the 14 patients with HCM.
Haemodynamic characteristics
Table 2 shows that during MCE, adenosine infusion was associated with a modest but significant increase in heart rate, and RPP while systolic and diastolic blood pressure remained unchanged. During PET examination, patients had a somewhat lower systolic blood pressure, but RPP was comparable, as during the MCE examination. Minor reversible side effects (flushing, chest pain, dyspnoea, headache, or dizziness) during adenosine infusion were seen in six (43%) patients. During cardiac catheterisation, mean (SD) LVRPP was 9927 (1074) mm Hg/min (see also table1). All other haemodynamic data from the patients with HCM and healthy controls are presented in table 2.
Feasibility of MCE measurements
Of the 364 LV segments, studied 72 (20%) could not be used for analysis because of attenuation artefacts. Of these, 48 segments (67%) were basal anterolateral segments.
MCE-derived global MBF
Resting global MBF did not change significantly (0.90 (0.13) vs 0.92 (0.12) ml/min/g) after correction for LVRPP. As seen in table 3, patients with HCM had lower values of resting MBF (for LVRPP-corrected) (0.92 (0.12) vs 1.13 (0.25) ml/min/g, p<0.01) than healthy controls. Hyperaemic MBF was also lower (2.56 (0.49) vs 4.34 (0.78) ml/min/g, p<0.01), resulting in a lower MFR (2.80 (0.62) vs 3.95 (0.77), p<0.01) than in healthy controls.
Relative myocardial volume and blood flow velocity
Figure 1 shows that resting mean rBV was lower in patients with HCM (0.094 (0.016) vs 0.138 (0.014) ml/ml, p<0.001), and during hyperaemia (0.104 (0.018) vs 0.185 (0.024) ml/ml, p<0.001) than in healthy controls. Moreover, vasodilator reserve of rBV was lower in patients with HCM (1.01 (0.01) vs 1.35 (0.01), p<0.001) than in healthy controls. Mean β tended to be higher in patients with HCM at rest (9.4 (4.6) vs 7.7 (4.2) ml/min) and during hyperaemia (25.8 (6.4) vs 23.1 (6.2) ml/min) than in healthy controls.

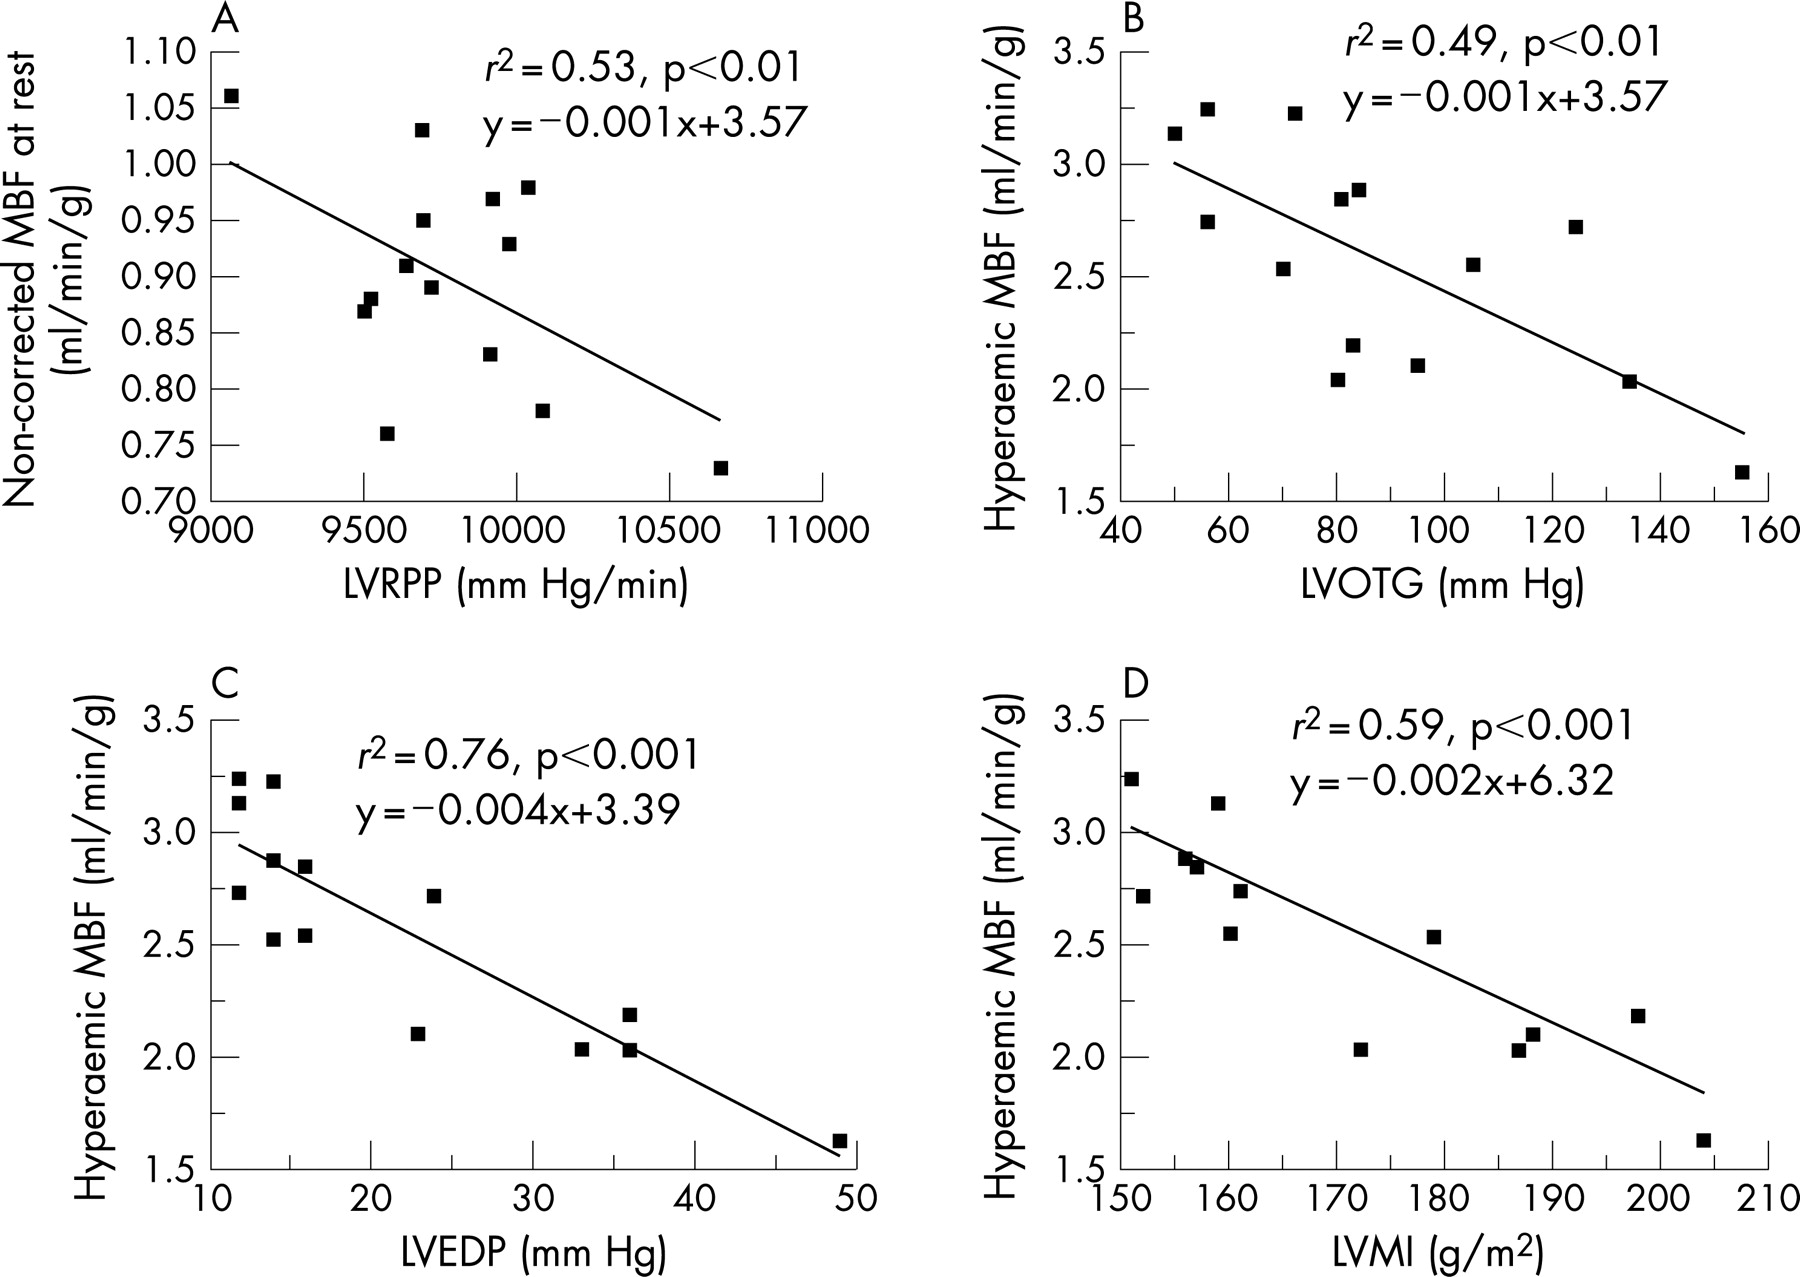
Morphological and haemodynamic determinants of MBF and rBV
Figures 2 and 3 show a strong inverse correlation (r2 = 0.53, p<0.01) between LVRPP and non-corrected resting MBF. Furthermore, hyperaemic MBF was inversely correlated with LVEDP (r2 = 0.76, p<0.001), LVMI (r2 = 0.59, p<0.001), and LVOTG (r2 = 0.49, p<0.01). Similarly, rBV was correlated with LVMI (r2 = 0.36, p<0.05). The hyperaemic endo-to-epi MBF ratio was inversely correlated with LVOTG (r2 = 0.68, p<0.001), LVEDP (r2 = 0.57, p<0.001), and LVMI (r2 = 0.36, p<0.05). After multivariate regression analysis for hyperaemic MBF and the endo-to-epi MBF ratio, respectively, LVEDP, LVOTG, and LVMI remained significant (all p<0.05). None of other clinical or echocardiographic variables had a significant correlation with resting or hyperaemic MBF.


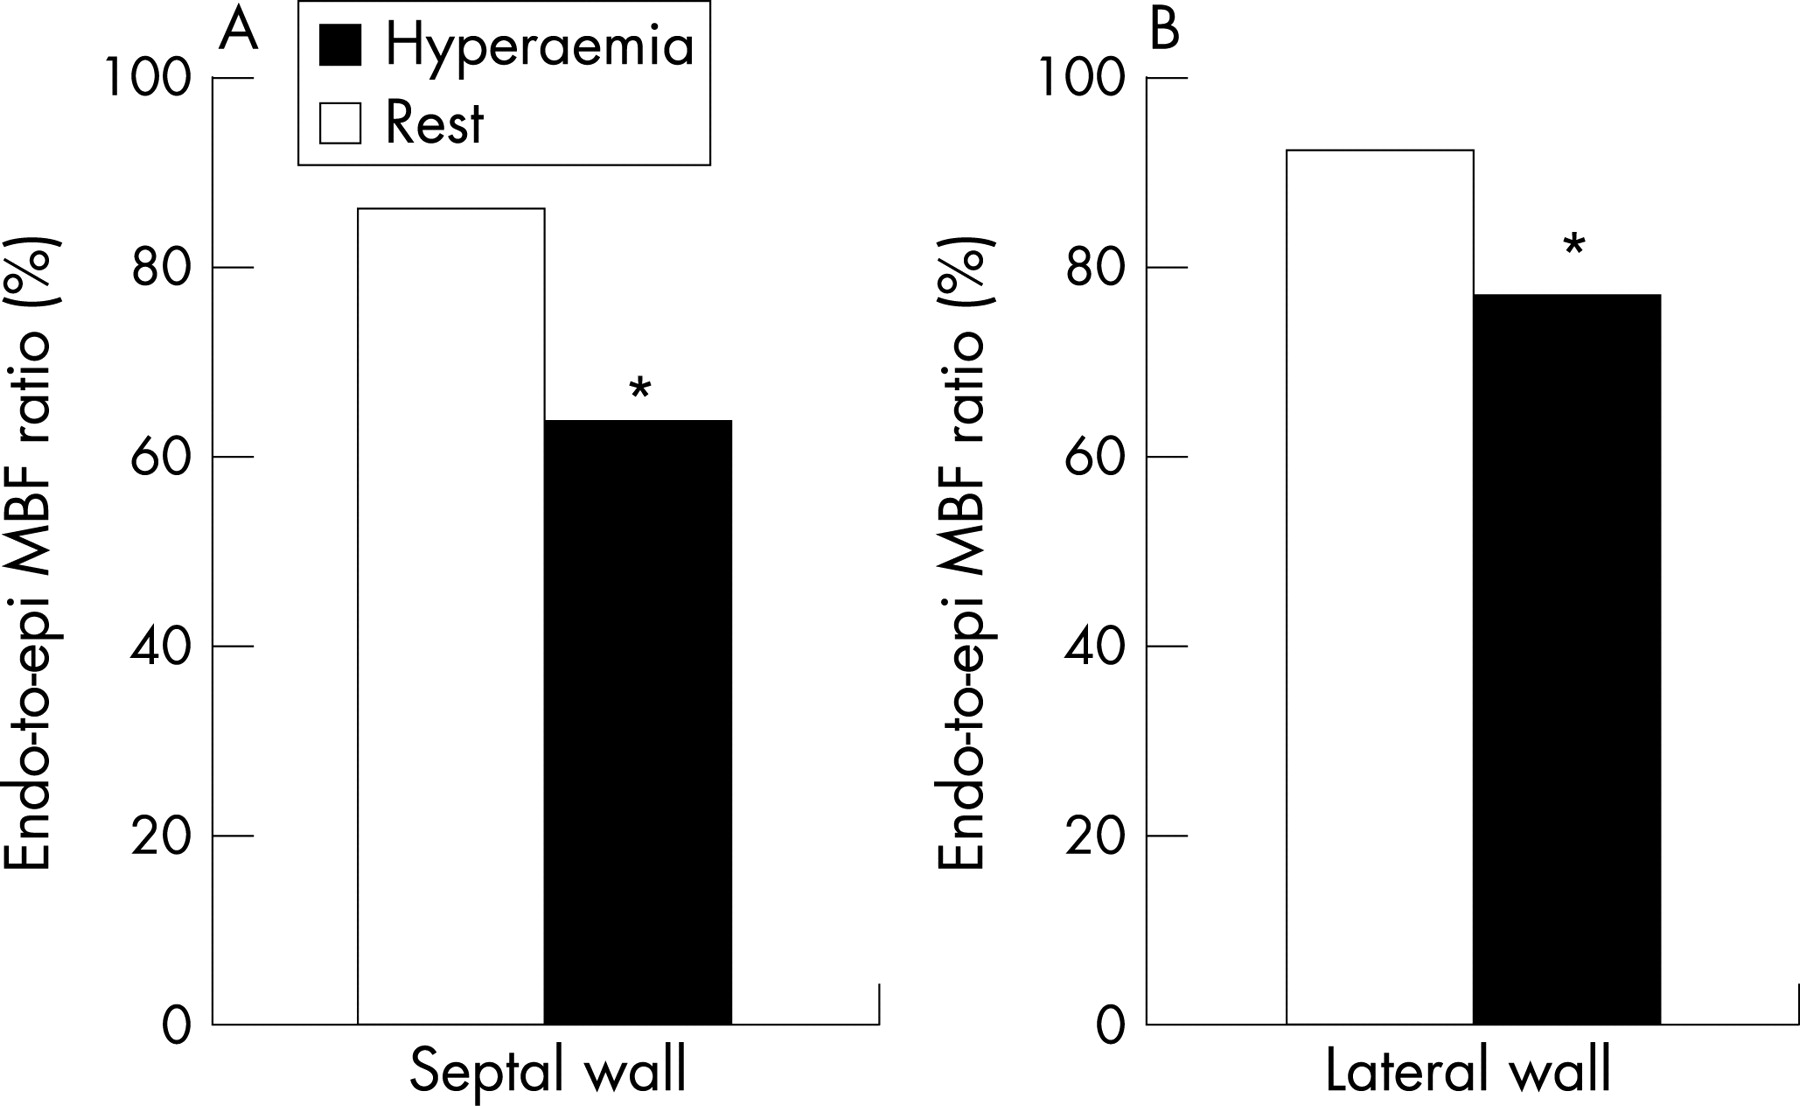
Transmural MBF
Figure 4 shows that the MCE-derived endo-to-epi MBF ratio decreased from rest to hyperaemia in the mid-septal region (0.86 (0.15) to 0.64 (0.18), p<0.01) and in the lateral wall (0.92 (0.19) to 0.77 (0.23), p<0.01).

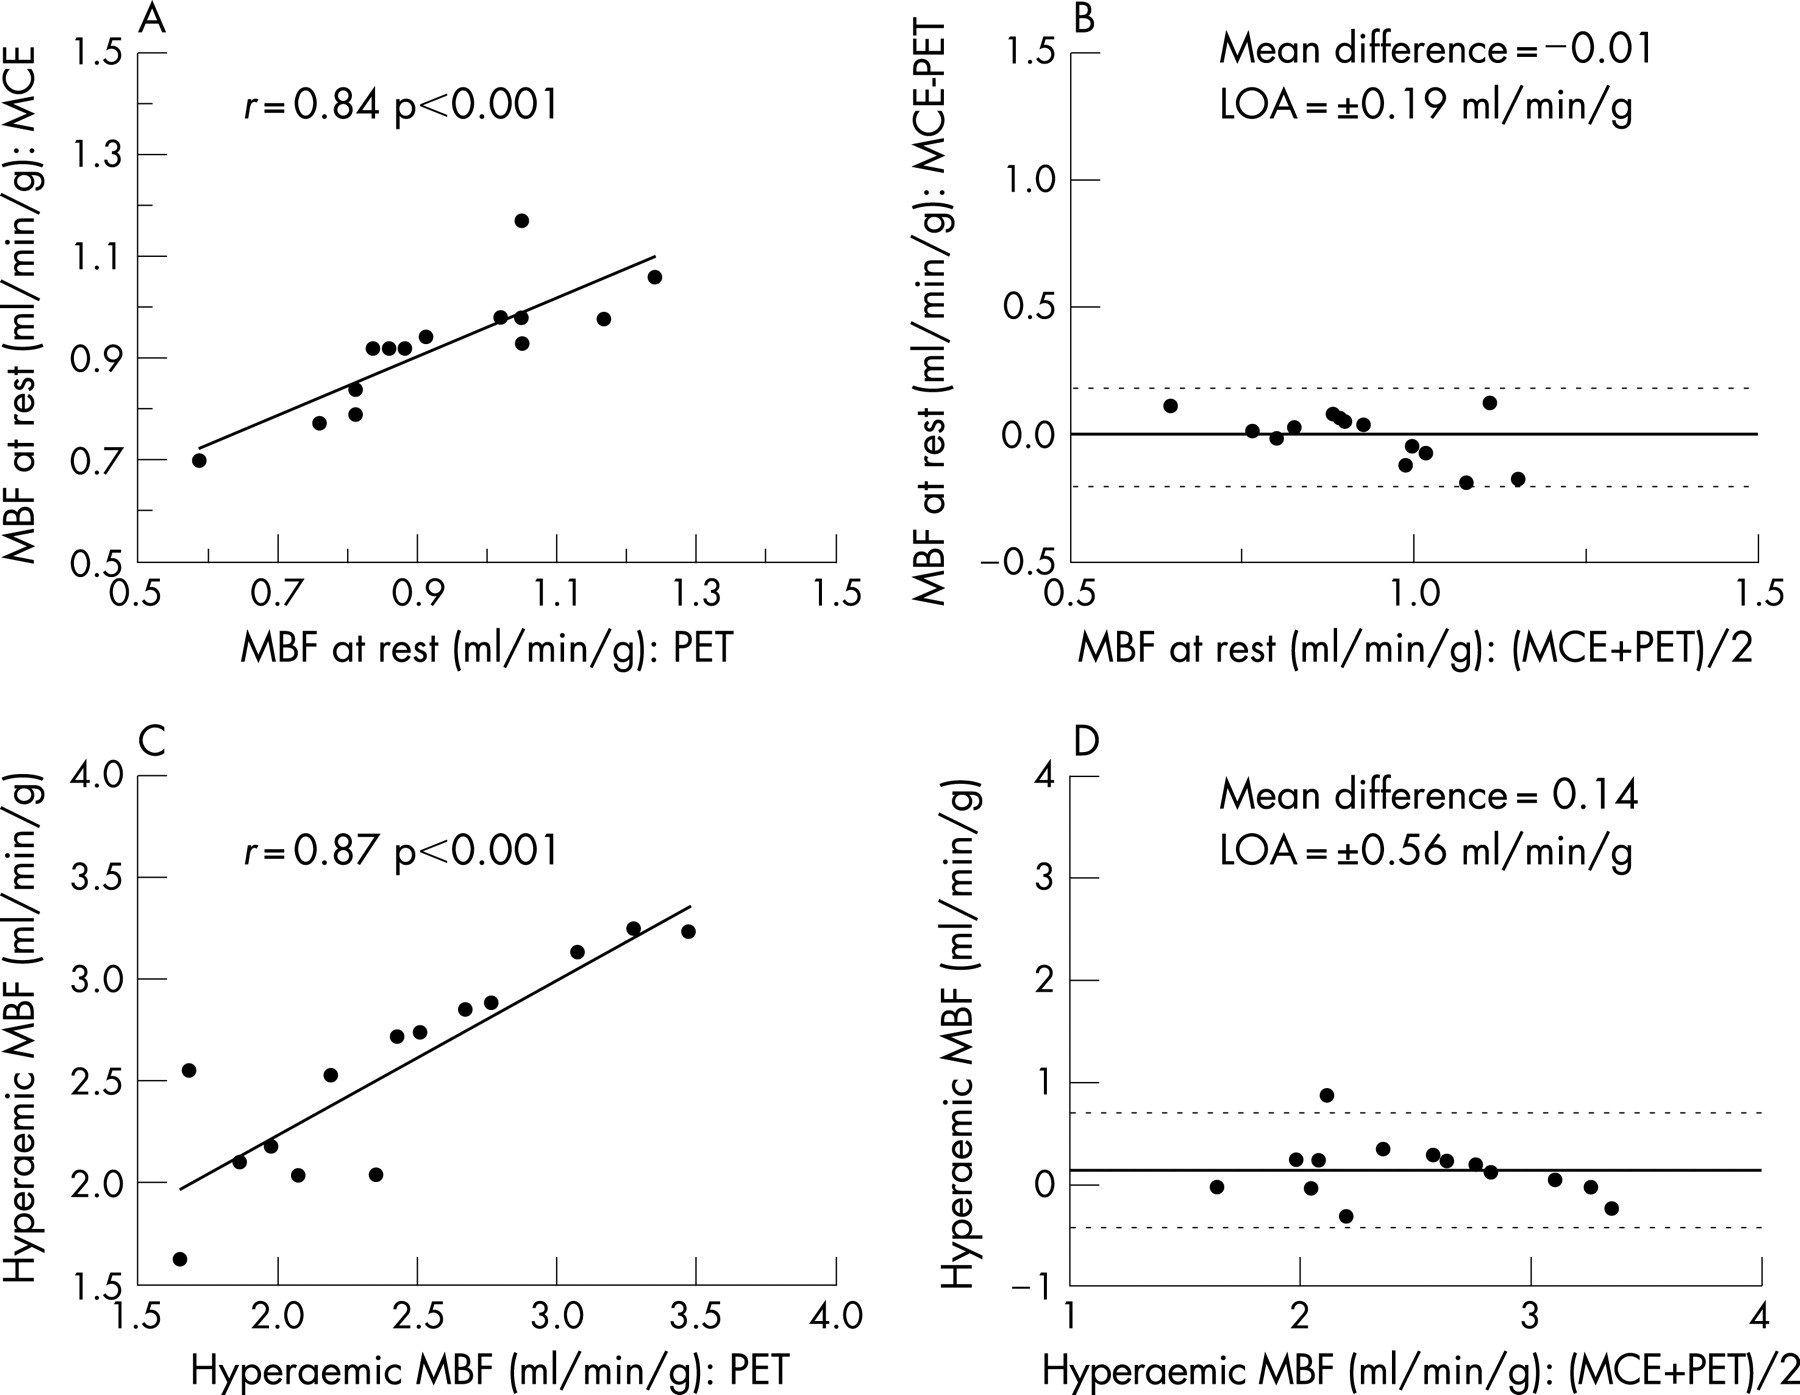
Correlations of MCE with PET
Table 4 and fig 5A show the linear regression analysis of resting MCE-global MBF (for LVRPP-corrected) demonstrating an excellent correlation (r = 0.84, p<0.001) with PET-global MBF (for LVRPP-corrected). Bland–Altman analysis confirmed the excellent agreement by small mean difference –0.01 ml/min/g (−0.20% of the mean) with narrow 95% limits of agreement at ±0.19 ml/min/g (±20% of the mean) (fig 5B). As shown in fig 5C, MCE-stress MBF correlated well (r = 0.87, p<0.001) with PET. Bland–Altman analysis confirmed the excellent agreement by small mean difference 0.14 ml/min/g (6% of the mean) with narrow 95% limits of agreement ±0.56 ml/min/g (±25.1% of the mean) (fig 5D).
Reproducibility of MCE data
Mean values of interobserver variability of MCE-derived MBF at rest and hyperaemia were 10.1 (14.5)% and 12.5 (16.2%), respectively. Likewise, interobserver variability of rBV and β were 12.6 (9.6)% and 18.6 (20.1)%, respectively. Furthermore, mean intraobserver variability of MCE-derived MBF at rest and during hyperaemia were 7.8 (13.9)% and 10.7 (12.5)%, respectively. Likewise, intraobserver variability of rBV and β were 7.1 (10.2)% and 14.5 (16.2)%, respectively.
DISCUSSION
The main findings of the present study are: (a) quantification of MBF by real-time MCE correlates well with PET in patients with HCM and healthy controls; (b) MFR is significantly reduced in patients with HCM compared with healthy controls; (c) the endo-to-epi ratio of MBF was reduced more in the interventricular septum than the lateral wall and more during hyperaemia than at rest; and more importantly (d) primarily, the blunted MFR is mainly due to the failure of myocardial blood volume to increase during hyperaemia, which denotes a failure of capillary recruitment; (e) the main determinants of myocardial perfusion impairment are LVEDP, LVOTG and LVMI. These findings are in agreement with previous studies of coronary flow reserve in patients with HCM, using invasive coronary Doppler flow measurements,7 8 22 single-photon emission computed tomography,6 PET,6 22 magnetic resonance measurements of coronary flow,23 24 and echo-Doppler measurements of coronary flow.25–27 However, studies using MCE for evaluation of MBF in patients with HCM are scarce and mainly semiquantitative.28 To the best of our knowledge, this is the first study to investigate real-time MCE for the quantification of rBV and MBF in patients with HCM. The technique used in the current study for quantification of MBV and MBF has been previously validated.12 13
MCE quantification of MBF
MCE is a relatively new technique for non-invasive, real-time evaluation of myocardial perfusion. This technique, as previously described, depends on quantification of video-intensity of ultrasound contrast agent within the capillary bed. In the current study, we used a previously validated volumetric model12 for quantification of MBV and MBF at rest and during intravenous adenosine infusion. We found a good correlation between this technique and PET.
Intravascular determinants of myocardial perfusion (MBV)
Under normal physiological conditions intravenous infusion of adenosine acts on specific tissue receptors and through release of endothelial nitrous oxide, causing an enhanced metabolic activity at the microcirculatory level of coronary vasculature. This causes subsequent reduction in the coronary resistance due to both vasodilatation and capillary recruitment. Thus, coronary blood flow is increased (ie, hyperaemia), and this is maintained throughout the period of increased metabolic activity then subsides after normal metabolism is restored.29 30 This active hyperaemia known as coronary blood flow reserve represents a compensatory mechanism to an increased oxygen demand that happens also in cases of reduced oxygen delivery to tissues, such as in hypoxia. Impairment of coronary blood flow reserve may either be due to diseased epicardial coronary circulation (coronary artery stenosis) or myocardial microcirculation (microvascular dysfunction), or both. The coronary microcirculation consists of arterioles, venules and capillaries (∼2500–3000/mm3), and (∼90%) of myocardial blood volume resides inside capillaries.31 Thus at the level of coronary microcirculation, a healthy (normal endothelium) and normal capillary density are responsible for normal microcirculatory reserve, termed MFR.
Furthermore, blunted MFR may be due to failure of either capillary recruitment or increasing blood flow velocity, or both. MBF, and hence MFR, can be measured non-invasively by PET and lately by MCE, which provides additional information on the microcirculation—that is, the relative myocardial blood volume and its exchange frequency or velocity. In the present study, we found that MBF at rest was lower in patients with HCM than in healthy controls as measured by MCE and PET. Likewise, the rBV was lower in patients with HCM than in healthy controls. Conversely, β, which represents blood exchange velocity, was higher in patients with HCM at rest and during hyperaemia. The higher myocardial blood velocities in HCM is in agreement with previous findings in HCM32 33 and hypertensive heart disease.34 Moreover, the blunted hyperaemic response in patients with HCM was mainly due to increase of exchange frequency β and minimally due to increase of the rBV (mean increase of β 2.6-fold, rBV 1.1-fold). Hence, the blunted MFR in HCM is mainly due to failure in increase of myocardial capillary blood volume, which in turn supports the conclusion that the interventricular septum at rest has near-maximal capillary vasodilatation (exhausted myocardial capillary autoregulation), which is in agreement with previous study from our group.4
These findings, in the context of mechanism of action of adenosine on coronary vasculature, can be explained by the reduced myocardial capillary density and endothelial dysfunction due to vascular remodelling that results from perivascular and myocardial deposition of collagen, which was shown in previous reports from our group and others.3 4 Furthermore, abnormal narrowing of intramural coronary arteries was found in histological specimens from patients with HCM.35 36 The unique possibility of using MCE to study myocardial blood volume changes in patients with HCM is clearly shown in this study, as it was shown previously in different patient groups.34 37 38
Extravascular forces and their clinical implications
Microvascular dysfunction has been demonstrated in patients with HCM.1 Since decreased MBF is a strong, independent predictor of clinical deterioration and mortality,3 4 its quantification will be of major clinical importance. The mechanisms of myocardial ischaemia and decreased MFR in patients with HCM have been partially described previously. In addition to the aforementioned morphological findings in patients with HCM, impaired LV relaxation and increased filling pressure may limit diastolic coronary perfusion by increments of extravascular compression.28 In our study, resting MBF was related only to LVRPP, which confirms previous reports.39 Moreover, hyperaemic MBF was related to LVEDP, LVOTG and LVMI, which supports the role of extravascular compression in limiting hyperaemic response in patients with HCM. Similarly, LVOTG, LVMI and LVEDP are related to the severity of subendocardial perfusion impairment. This in turn implies significant subendocardial compensatory vasodilatation in the hypertrophied muscle at rest, resulting in a decreased coronary perfusion pressure during stress. Another important finding is that subendocardial abnormalities were as seen in the hypertrophied interventricular septum as well the lateral wall. This may be due to extensive fibrosis and injury and is in agreement with previous reports,8 in which the authors found that the severity of microvascular abnormalities correlated with the degree of regional myocardial hypertrophy in patients with HCM.
Limitations of the study
The study evaluated a rather small number of patients (n = 14) and characteristically was conducted only on patients with obstructive HCM. The findings in this study may not be extrapolated to other forms of HCM. However, although only a small number of patients were examined, significant findings were seen in the patient group as compared with healthy controls. In addition, a comparison between the two techniques was performed and good correlation was found.
Another limitation is the comparison between two imaging modalities with different resolution, as MCE was based on a two-dimensional model, while data from PET were based on a three-dimensional volume. To overcome this limitation, we calculated the mean of each myocardial segment with both techniques for the interventricular septum (anterior and inferior), lateral free wall and apex. Thus, a 13-segment model was derived for comparison with PET. More importantly, MCE measurements of MBF in patients with HCM showed good agreement with PET at rest and during hyperaemia. Furthermore, the Bland-Altman analysis and paired t test showed no significant differences between MCE and PET for MBF either at rest or during hyperaemia. Moreover, the unique finding in the current study is that accurate measurements of MBF by MCE provide a non-invasive and better understanding of factors responsible for microvascular dysfunction in patients with HCM. Other techniques that have been used for evaluation of microvascular dysfunction in patients with HCM are invasive (intra-coronary Doppler) or not freely available (PET). Other non-invasive techniques like magnetic resonance imaging and single-photon emission tomography imaging have limited practical application compared with echocardiography.
CONCLUSIONS
In patients with HCM, the blunted hyperaemic perfusion and MFR are due to exhausted autoregulation of myocardial microcirculation as well extravascular compression forces. LVEDP, LVOTG and LVMI are independent predictors of hyperaemic perfusion and endo-to-epi MBF. These findings may have important practical implications for the understanding and follow-up of patients with HCM and can be measured accurately with MCE. A study to investigate the prognostic value of current findings is warranted.
Acknowledgments
We thank Dr E Boersma from the Department of Statistics and Clinical Epidemiology Unit, Thoraxcenter, Erasmus Medical Center, Rotterdam, The Netherlands, for the assistance in the statistical analysis.
REFERENCES
Footnotes
Competing interests: None.
- Abbreviations:
- endo-to-epi
- endocardial-to-subepicardial
- HCM
- hypertrophic cardiomyopathy
- LV
- left ventricular
- LVEDP
- left ventricular end-diastolic pressure
- LVMI
- left ventricular mass index
- LVOTG
- left ventricular outflow tract gradient
- LVRPP
- left ventricular rate–pressure product
- MBF
- myocardial blood flow
- MCE
- myocardial contrast echocardiography
- MFR
- myocardial flow reserve
- PET
- positron emission tomography
- rBV
- relative blood volume
- ROI
- region of interest
- RPP
- rate–pressure product