Article Text

Abstract
Objective: To evaluate the diagnostic impact of magnetic resonance imaging (MRI) first-pass perfusion using steady-state, free-precession (SSFP) sequences with parallel imaging (SENSE) for detection of coronary stenoses.
Design: Prospective observational study.
Setting: University hospital, cardiac MRI and catheterisation laboratories.
Patients and methods: 228 patients were examined with coronary angiography and MRI (1.5 T Intera CV). A three-slice, short-axis SSFP perfusion scan with a saturation prepulse was performed during infusion of adenosine and at rest followed by myocardial scar (late enhancement) imaging. Gadolinium-DTPA was given at 0.1 mmol/kg body weight. Perfusion images were visually assessed. Analysis for myocardial hypoperfusion was done according to patient group and according to vessel.
Results: Sensitivity, specificity and accuracy of MRI first-pass perfusion for detection of a coronary artery stenosis (>50% luminal narrowing) in the total patient group were 93.0%, 85.7%, 91.2% and for a significant lesion (>70% luminal narrowing) 96.1%, 72.0%, 88.2%, respectively. Based on 536 coronary artery territories without myocardial scar, the sensitivity of MRI perfusion analysis for detection of a significant lesion was for the left anterior descending artery 91.4%, for the circumflex artery 81.6% and for the right coronary artery 65.1% (p<0.001).
Conclusions: MRI first-pass perfusion analysis using an SSFP sequence with three myocardial slices was a highly accurate diagnostic method for detection of coronary artery stenoses. This MRI technique can be included in daily practice and has the potential to guide the indication for invasive coronary angiography.
- magnetic resonance imaging
- myocardial perfusion
- coronary angiography
- coronary stenosis
- SSFP
Statistics from Altmetric.com
Non-invasive assessment of myocardial ischaemia to detect haemodynamically relevant coronary artery stenoses is required in patients referred for primary diagnosis of suspected coronary artery disease (CAD) and those with recurrent symptoms of angina pectoris after percutaneous coronary interventions. Cardiac magnetic resonance imaging (MRI) is a powerful and reliable tool for assessing both morphology and ventricular function. Myocardial ischaemia can be assessed with MRI by regional wall motion abnormalities during dobutamine stress1–3 or by assessing perfusion defects with first-pass contrast enhancement of the myocardium using peak signal intensity and the slope of the signal intensity time curve as perfusion parameters.4–8
Most previous MRI perfusion studies have been performed without modern MRI techniques such as steady-state, free-precession (SSFP) or parallel imaging and are hampered by artefacts and poor signal-to-noise ratio (SNR), impeding an accurate visual assessment of regional myocardial hypoperfusion. In contrast with echo-planar imaging hybrid sequences and with standard spoiled gradient echo sequences, the SSFP technique provides a gain in SNR of up to 85% and in contrast-to-noise ratio of up to 50%.9 These higher ratios may facilitate visual assessment of regional differences in signal intensity. Furthermore, the higher SNR enables shorter acquisition times, in combination with parallel imaging techniques.10 This allows a preparatory prepulse to be added before each slice. Additionally, semiquantitative analysis of the signal intensity change and maximum signal in relation to the left ventricular cavity signal is elaborate,11 which limits the semiquantitative approach for clinical routine. Thus, SSFP seems to be an option for improving myocardial perfusion imaging,12 enabling visual assessment.
This study aimed at evaluating the ability of first-pass MRI to detect coronary stenoses in clinical routine using an SSFP sequence with parallel imaging and adenosine stress.
SUBJECTS AND METHODS
Study group
Between July 2004 and December 2005 we studied 228 consecutive patients referred for cardiac catheterisation with a time interval of less than 4 weeks between the MRI study and cardiac catheterisation. Two study groups were specified: patients referred for primary diagnosis of CAD and patients with suspected progress of CAD. Exclusion criteria were acute myocardial infarction, previous coronary artery bypass grafting, severe claustrophobia, MR-incompatible implants, a heart rate that was not well controlled and pulmonary disease requiring treatment with methyl xanthine derivatives. During the study period nine additional patients were scheduled but did not undergo an MRI study owing to tachyarrhythmia in five patients and to frequent premature ventricular beats in four. β Blockers, calcium channel blockers and nitrates were withdrawn ⩾24 hours before MRI, and caffeinated foods ⩾12 hours before, to ensure maximal vasodilatory response to adenosine. The study was approved by the local ethics committee and all patients gave their written informed consent.
Magnetic resonance imaging
MRI was performed on a 1.5 T whole body scanner (Intera CV, Philips Medical Systems, Best, The Netherlands, slew rate 150 T/m/s, amplitude 30 mT/m) in a supine position using a five-element, phased-array cardiac coil. To define the position and axis of the left ventricle, three short survey scans and two functional long-axis scans were performed. For first-pass perfusion studies an SSFP sequence was used with three slices per heartbeat. Slice thickness was 10 mm using a variable gap to cover the whole left ventricle, keeping a distance of 1.5 cm from the first and last slice to the apex and mitral annulus, respectively. The position of the three slices was individually adjusted on diastolic and systolic functional scans. A saturation recovery prepulse (delay 130 ms) was used before each slice. Repetition time was 2.4 ms, echo time was 1.2 ms. The field of view was adjusted between 360 and 410 mm, with a rectangular reduction of 80–100% depending on the chest size of the patient. A test scan was performed in every patient before adenosine stress to avoid fold over artefacts. The measurement matrix was 115×128, resulting in a typical in-plane resolution of 2.8×3.0 mm2. Fourier interpolation resulted in a pixel size of 1.4 mm2. The parallel imaging technique sensitivity encoding (SENSE) was used with a reduction factor of two.10 Prospective triggering was used for cardiac synchronisation without arrhythmia rejection.
The mean time interval between the MRI studies and cardiac catheterisations was 6.6 days (range 0–28). During this time interval no coronary intervention was performed. The MRI protocol was completed in all 228 patients. A stable sinus rhythm was present in 218/228 (95.6%) patients during MRI acquisition. Five patients had atrial fibrillation and five had ventricular premature beats. Adenosine stress induced a significant increase in heart rate and pulse pressure product (table 2).
Perfusion studies were performed using coronary vasodilatation induced by adenosine in a dosage of 140 µg/kg/min through a separate antecubital vein. The patient’s blood pressure was monitored. Electrocardiogram and pulse oximetry were continuously registered (Millenia 3150 MRI; Invivo, Orlando, USA). After at least 4 minutes of pharmacological stress, perfusion imaging was started. Imaging and adenosine infusion were continued for a total of 60 heartbeats. A bolus of 0.1 mmol/kg bodyweight gadolinium-DTPA (Magnevist; Schering, Berlin, Germany) was injected into a separate antecubital vein at 6 ml/s by a power injector (Medrad Spectris, Volkach, Germany), flushed with 20 ml of saline. After visible enhancement of the right ventricular cavum the patient was instructed to hold his breath in an end-expiratory position as long as possible to minimise cardiac motion. To cover the delicate phase of left ventricular first-pass, the breath holding period should last for about 10 seconds. Each patient was trained to this breathing manoeuvre before the examination. A second first-pass study with identical scan variables was performed at rest, 15 minutes after the stress study. Late enhancement (LE) imaging was carried out 15 minutes after rest MR perfusion imaging using a three-dimensional spoiled turbo gradient echo sequence with a selective 180° inversion recovery prepulse. Inversion times were individually optimised using the Look–Locker sequence.13
Image analysis
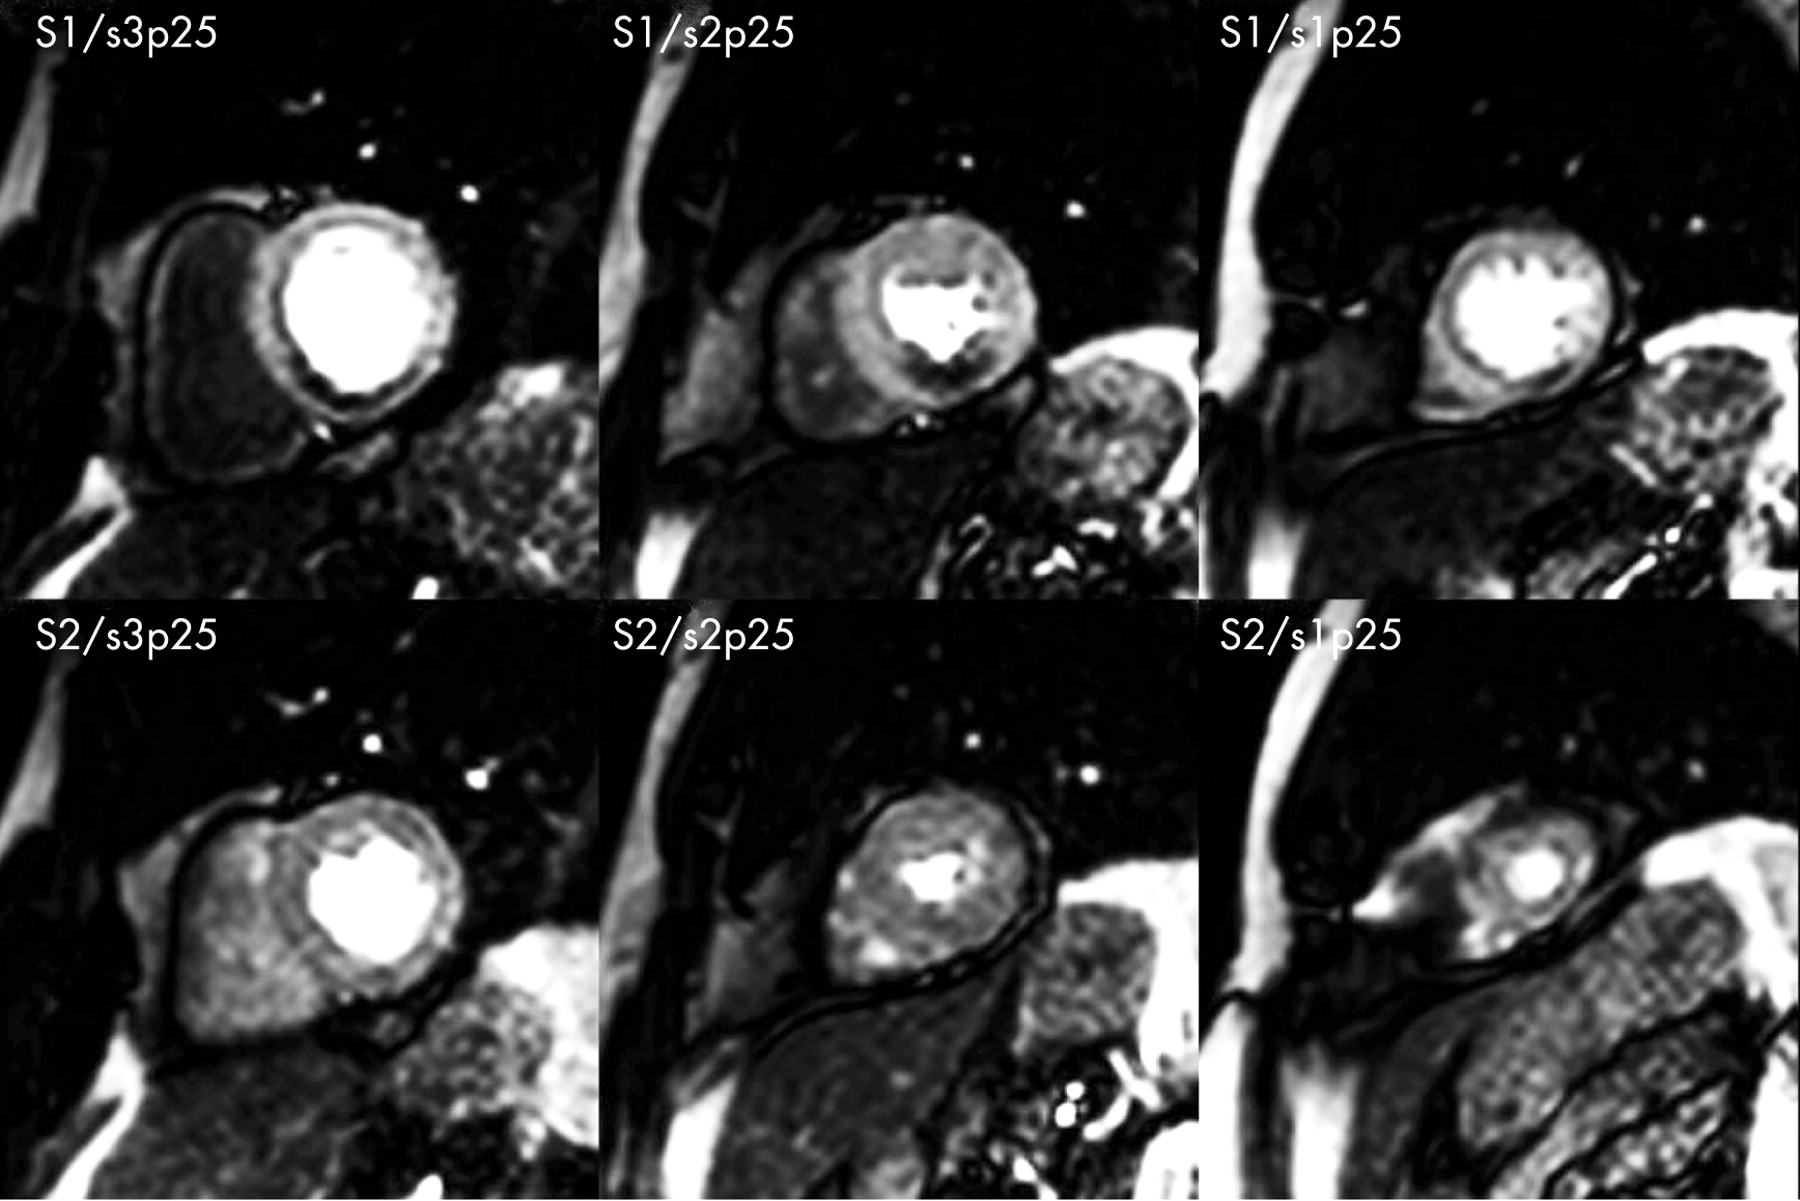
The late enhancement and functional images were assessed on a Philips workstation (Easy Vision 5.1; Philips Medical Systems, Best, The Netherlands). The myocardium was further evaluated for scar according to the model of the American Heart Association.14 The presence of late enhancement was defined as myocardial scar. MRI first-pass studies were qualitatively analysed by two experienced observers who were unaware of the patients’ history and coronary status. Comparisons of the three slices during adenosine stress with the corresponding slices at rest were made on an MRI MASS Plus V5.0 (Medis, Leiden, The Netherlands). A relevant myocardial perfusion defect in MRI was defined as a clearly visible hypoenhancement in at least one slice, persisting for at least five heartbeats in the stress study but not seen at rest (fig 1). Diffuse subendocardial perfusion defects not attributable to a coronary supply territory were defined as unspecific. Myocardial perfusion defects were assessed with respect to the patient group and to the supply region of each coronary artery. For the latter, the segments with coronary perfusion defects in MRI were related to the supply region of the left anterior descending artery (LAD), circumflex artery (CX) and the right coronary artery (RCA). LE images were correlated with perfusion scans to evaluate regions with myocardial scar, which were excluded from the perfusion analysis.

Coronary angiography
Cardiac catheterisation was performed by the femoral approach using a standard Judkins technique. Coronary arteries were visualised in multiple projections after intracoronary application of glycerol trinitrate. In the presence of a coronary lesion within the main vessel or major side branch, the diameter stenosis was evaluated in two orthogonal views. A coronary artery stenosis was defined as at least one diameter stenosis >50%. The presence of significant coronary artery stenosis was defined as at least one diameter stenosis >70%. The degree of coronary stenoses was assessed by an experienced angiographer who was unaware of the MRI results. In borderline cases quantitative coronary angiography was performed using the CAAS QCA for Research 2.0 software (Pie Medical Imaging, Maastricht, The Netherlands).15 16
Statistical analysis
Continuous variables are presented as mean (SD). For comparison of continuous variables, a two-tailed t test was used. Discrete variables were expressed as counts and percentages compared by χ2 analysis. Sensitivity, specificity, positive and negative predictive values (PPV, NPV) and accuracy of the MR results for the detection of coronary stenoses were calculated. Statistics were calculated with Statistica release 6.1 (StatSoft Inc, Tulsa, OK, USA). 95% Confidence intervals (CIs) were calculated according to Altman et al.17
RESULTS
Patients
A total of 228 patients were included in the study. Table 1 shows the baseline clinical characteristics. Median body weight was 78 kg (interquartile range 72–86).
An increase in heart rate >10% during adenosine infusion was achieved in 204 (89.5%) patients. Transient atrioventricular block grade III occurred in 14 patients (6.1%) and resulted in trigger dropouts. However, no patients were excluded from the MRI perfusion analysis (intention-to-treat analysis). One hundred and five (46.1%) patients experienced angina pectoris during adenosine stress. Seventy-four of these patients showed a significant stenosis in coronary angiography. No adverse side effects of adenosine like anaphylaxis, bronchospasm or serious ventricular arrhythmias occurred during pharmacological stress.
Analysis according to patient group
In the total group, stress induced perfusion defects in MRI were seen in 168/228 (73.7%) patients. Coronary stenosis (>50% luminal narrowing) was diagnosed in 172/228 (75.4%) patients. Sensitivity for detection of coronary stenosis by hypoperfusion in MRI during adenosine stress was 93.0% (95% CI 88.2% to 96.0%; n = 160/172), specificity 85.7% (95% CI 74.3% to 92.6%; n = 48/56), PPV 95.2% (160/168), NPV 80.0% (48/60) and accuracy 91.2% (95% CI 86.8% to 94.2%; n = 208/228). A significant coronary stenosis (>70% luminal narrowing) was seen in 153/228 (67.1%) patients. Sensitivity for detection of a significant coronary artery stenosis was 96.1% (95% CI 91.7% to 98.2%; n = 147/153), specificity 72.0% (95% CI 61.0% to 80.9%; n = 54/75), PPV 87.5% (147/168), NPV 90.0% (54/60) and accuracy 88.2% (95% CI 84.6% to 92.4%; n = 201/228). Interestingly, accuracy, sensitivity and specificity for detection of CAD or a significant lesion was higher in women than in men (data not shown).
In the group of patients referred for primary diagnosis (n = 59), perfusion defects in MRI were seen in 22/59 (37.3%) patients. Diagnosis of a coronary stenosis was confirmed in 18 (30.5%) patients and a significant lesion was detected in 13 (22.0%) patients. Sensitivity of MRI perfusion analysis for detection of a coronary stenosis was 83.3% (95% CI 60.8% to 94.2%; n = 15/18), specificity 82.9% (95% CI 68.7% to 91.5%; n = 34/41), PPV 68.2% (15/22), NPV 91.9% (34/37) and accuracy 83.1% (95% CI 71.5% to 90.5%; n = 49/59). The sensitivity of MRI perfusion analysis for detection of a significant coronary artery stenosis was 100.0% (95% CI 77.2% to 100%; n = 13/13), specificity 80.4% (95% CI 66.8% to 89.3%; n = 37/46), PPV 59.1% (13/22), NPV 100.0% (37/37) and accuracy 84.7% (95% CI 73.5% to 91.8%; n = 50/59). The incidence of hypertension (78%) and hyperlipidaemia (88%) was higher in this subgroup of patients than in the whole study group (table 1).
In the group of patients with suspected progress of CAD (n = 169), perfusion defects in MRI were seen in 146/169 (86.4%) patients. A coronary stenosis with at least one 50% diameter stenosis was diagnosed in 154 (91.1%) patients. A significant stenosis was detected in 140 (82.8%) patients. Sensitivity of MRI perfusion analysis for detection of coronary stenoses was 94.2% (95% CI 89.3% to 96.9%; n = 145/154), specificity 93.3% (95% CI 70.2% to 98.8%; n = 14/15), PPV 99.3% (145/146), NPV 60.9% (14/23) and accuracy 94.1% (95% CI 89.5% to 96.8%; n = 159/169). Sensitivity of MRI perfusion analysis for detection of a significant coronary artery stenosis (>70% diameter stenosis) was 95.7% (95% CI 91.0% to 98.0%; n = 134/140), specificity 58.6% (95% CI 40.7% to 74.5%; n = 17/29), PPV 91.8% (134/146), NPV 73.9% (17/23) and accuracy 89.3% (95% CI 83.8% to 93.2%; n = 151/169).
Analysis according to the supply region of each coronary artery
A total of 536 coronary artery territories without myocardial scar in LE imaging were eligible for assessing adenosine stress-induced perfusion defects in MRI. Stress-induced hypoperfusion in MRI was seen in 150/536 (28.0%) territories. Presence of coronary stenosis was diagnosed in 228/536 (42.5%) territories by coronary angiography. Sensitivity for detection of CAD by hypoperfusion in MRI during adenosine stress per coronary artery territory was 69.3% (95% CI 63.0% to 74.9%; n = 158/228), specificity 95.5% (95% CI 92.5% to 97.3%; n = 294/308), PPV 91.9% (158/172), NPV 80.8% (294/364) and accuracy 84.3% (95% CI 81.0% to 87.2%; n = 452/536). A significant coronary stenosis was seen in 171/536 (32.1%) territories. Sensitivity for detection of a significant coronary artery stenosis per territory was 80.7% (95% CI 73.6% to 86.2%; n = 121/150), specificity 86.8% (95% CI 83.0% to 89.8%; n = 335/386), PPV 70.3% (121/172), NPV 92.0% (335/364) and accuracy 85.1% (95% CI 81.8% to 87.8%; n = 456/536).
Adenosine stress-induced hypoperfusion in MRI was analysed according to the individual coronary arteries—namely, LAD (n = 173), CX (n = 183) and RCA (n = 180). Sensitivity of the MRI stress test for diagnosis of a coronary stenosis was significantly different for LAD, CX and RCA territories, with 81.0% (n = 68/84) for LAD, 72.6% (n = 53/73) for CX and 52.1% (n = 37/71) for RCA territory (p<0.001). There were no significant differences in specificity (p = 0.99) or accuracy (p = 0.72) between the three territories (table 3). Sensitivity of hypoperfusion in MRI during adenosine stress for detection of a significant coronary artery stenosis was significantly different between the three territories (p<0.001). Sensitivity for the LAD territory was 91.4% (n = 53/58), CX 81.6% (n = 40/49) and RCA 65.1% (n = 28/43). There were no significant differences in specificity (p = 0.34) or accuracy (p = 0.99) between the three territories for detection of significant coronary stenosis (table 3).
In the subgroup of patients with single-vessel disease due to a significant coronary lesion, a positive MRI perfusion analysis for the LAD territory was seen in 100% (95% CI 61.0% to 100%, n = 6/6), CX 85.7% (95% CI 48.7% to 97.4%, n = 6/7) and RCA 100% (95% CI 18.8% to 81.2%, n = 3/3). Numbers for two-vessel disease were for the LAD 83.3% (95% CI 64.1% to 93.3%, n = 20/24), CX 73.7% (95% CI 51.2% to 88.2%, n = 14/19) and RCA 72.2% (95% CI 49.1% to 87.5%, n = 13/18) and for the subgroup with three-vessel disease 96.4% (95% CI 82.3% to 99.4%, n = 27/28), 86.2% (95% CI 69.4% to 94.5%, n = 25/29) and 56.5% (95% CI 36.8% to 74.4%, n = 13/23), respectively.
DISCUSSION
In this study on 228 patients, MRI first-pass perfusion imaging using an SSFP sequence was a highly accurate diagnostic method for detection of coronary stenosis. Accuracy for detection of a significant lesion (>70% diameter stenosis) according to patient group was 91.2% (88.2%) for the total population, 83.1% (84.8%) in patients referred for primary diagnosis and 94.1% (89.4%) in patients with suspected progress of CAD.
Two small published studies used SSFP sequences for perfusion analysis in patients with CAD. Fenchel et al studied 22 patients with CAD using a TrueFisp sequence with semiquantitative analysis.18 For the detection of relevant stenoses the sensitivity was 81% and specificity 89%. In a group of 13 patients Chiu et al performed visual assessment of MR first-pass perfusion imaging with an SSFP sequence, obtaining a high sensitivity and specificity of 92%.19 Only patients with an acute coronary syndrome were included. Both studies reflect the impact of an SSFP sequence but are probably biased by the highly selected and small patient groups compared with our group with 228 patients. In contrast with conventional MRI imaging techniques,7 8 11 20–22 SSFP perfusion imaging seems to be better for the detection of CAD, even if semiquantitative analysis of signal upslopes7 8 or perfusion reserve indices20 22 are calculated. Nagel et al used a turbo-gradient echo/echo-planar imaging-hybrid sequence for MR first-pass-perfusion with visual assessment20 as well as calculation of the perfusion reserve index. They observed a high sensitivity for detection of CAD by the semiquantitative approach but low values for visual analysis. Using five slices, the sensitivity was 74%, specificity 58% and accuracy 66%. With the inner three slices, numbers were 70%, 78% and 78%, respectively. The corresponding values in our study in the patient group with primary diagnosis of CAD were 83.3%, 82.9% and 83.1% for detection of CAD and 100.0%, 80.4% and 84.5% for detection of a significant stenosis. One possible reason for the difference between both studies may be the use of the SSFP technique with its gain in SNR and contrast-to-noise ratio.9
We were particularly interested in the results for patients admitted owing to suspected progress of CAD. In this group, sensitivity for detection of a significant stenoses was 95.7%, specificity 58.6%, and accuracy 89.4%. PPV was high, with 99.3% for diagnosis of a coronary lesion with >50% diameter stenosis and 91.8% for >70% diameter stenoses. These findings can be translated into clear clinical decisions. Patients with suspected progression of CAD and a positive MRI perfusion scan (perfusion defect) should undergo subsequent coronary angiography for further risk stratification and planning of treatment strategy. In contrast, the PPV in patients referred for primary diagnosis of CAD was lower. The higher rate of risk factors in these patients supports the idea that those patients more frequently had hypertensive heart disease, syndrome X or coronary endothelial dysfunction. Although, the MRI perfusion analysis in these patients shows more false positive results for the detection of epicardial stenosis, the observation of perfusion deficits in those patients might be a substrate of ischaemic pain.23 24
LE imaging showed 536 coronary artery territories without myocardial scar. The sensitivity of MRI first-pass perfusion to detect a significant lesion differed significantly between LAD, CX and RCA. Sensitivity was highest for LAD and lowest for RCA. A possible explanation might be the use of a surface coil, leading to lower signal intensities in the inferior segments, which might be amplified in an obese population. Nevertheless, mean body weight and body mass index in the reported patients were well within the range for patients with CAD.25–27 The decreasing sensitivity within the RCA from single- to three-vessel diseases indicates that visual assessment of regions with lower signal intensities is hampered when more than one supply region is affected. This problem may be overcome with a semiquantitative approach, using the more elaborate perfusion reserve to correct for those coil-dependent signal differences.8 21
Limitation
Perfusion analysis was visually performed. Quantitative coronary analysis was not carried out for all coronary lesions. Nevertheless, this approach reflects a typical clinical setting. The results of our study cannot be transferred to all patients with CAD because we excluded patients with prior coronary artery bypass grafting. This was done because the more complex coronary anatomy in those patients limits the exact correlation of MRI hypoperfusion areas with the corresponding culprit coronary artery. For segmental analysis, areas with myocardial scar were excluded, because the value of myocardial perfusion analysis for detection of coronary stenosis in myocardial infarction may be limited (wall thinning, reduction of capillaries) and is associated with a high number of false positive results.28 Thus, the results using the SSFP sequence are only valid for non-infarcted areas. Nevertheless, in the analysis according to patient group, no patient was excluded.
CONCLUSION
MRI first-pass perfusion analysis using an SSFP sequence with three myocardial slices is a highly accurate diagnostic method for detection of coronary artery stenoses. This MRI technique could be included in daily practice and has the potential to guide the indication for invasive coronary angiography.
Acknowledgments
The study was supported in part by Philips Medical Systems, Best, The Netherlands.
REFERENCES
Footnotes
Conflict of interest: None declared.
Nico Merkle and Jochen Wöhrle contributed equally—both should be considered first authors.
- Abbreviations:
- CAD
- coronary artery disease
- CX
- circumflex artery
- LAD
- left anterior descending artery
- LE
- late enhancement
- NPV
- negative predictive value
- PPV
- positive predictive value
- RCA
- right coronary artery
- SNR
- signal-to-noise ratio
- SSFP
- steady-state, free-precession