Article Text

Abstract
Background Adjustment of cardiac dimensions by measures of body size appears intuitively convincing and in patients with aortic stenosis, aortic valve area (AVA) is commonly adjusted by body surface area (BSA). However, there is little evidence to support such an approach.
Objective To identify the adequate measure of body size for the adjustment of aortic stenosis severity.
Methods Parameters of aortic stenosis severity (jet velocity, mean pressure gradient (MPG) and AVA) and measures of body size (height, weight, BSA and body mass index (BMI)) were analysed in 2843 consecutive patients with aortic stenosis (jet velocity ≥2.5 m/s) and related to outcomes in a second cohort of 1525 patients from the Simvastatin/Ezetimibe in Aortic Stenosis (SEAS) study.
Results Whereas jet velocity and MPG were independent of body size, AVA was significantly correlated with height, weight, BSA and BMI (Pearson correlation coefficient (r) 0.319, 0.281, 0.317 and 0.126, respectively, all p<0.001) to the effect that larger patients presented with larger AVA (less severe stenosis). Of the anthropometric measures used for linear adjustment, BSA was most effective in eliminating the correlation between AVA and body size (r=0.007), rivalled only by allometric (non-linear) models, findings that are confirmed in 1525 prospectively followed patients from the SEAS study. Predictive accuracy for aortic valve events and cardiovascular death during 46 months of follow-up was unchanged by adjusting AVA, regardless of measure of body size (area under the receiver operating curve for AVA 0.72 (CI 0.58 to 0.87) versus, for example, AVA/BSA 0.75 (CI 0.61 to 0.88), p=0.22).
Conclusions In the assessment of aortic stenosis, linear adjustment of AVA by BSA improves comparability between patients with diverging body size without, however, increasing the predictive accuracy for clinical events in a population with mild to moderate stenosis.
Statistics from Altmetric.com
Introduction
Echocardiography is the pivotal diagnostic tool in the assessment of aortic valve stenosis. Parameters of stenosis severity include jet velocity, mean pressure gradient (MPG) and aortic valve area (AVA). To account for differences in body size, current valvular heart disease guidelines recommend adjustment of AVA by body surface area (BSA) resulting in a fourth parameter termed AVAindex.1–3 Adjusting AVA appears intuitively convincing, should improve comparability between patient populations, and has been widely adopted in the literature. However, scientific data to support this approach are scarce4 and a number of reports have questioned the validity of linear adjustment or scaling of cardiac dimensions by measures of body size both based on theoretic and mathematic considerations and rather support a non-linear (allometric) approach.4–8 To our knowledge, adjustment of AVA by body size in adults has so far only been systematically investigated in a single cohort of healthy volunteers9 and little information regarding adjustment in patients with aortic valve stenosis is available. Recently, we have shown that indexing AVA by BSA and applying the recommended cut-off value for severe stenosis of 0.6 cm2/m2 dramatically increases the prevalence of severe stenosis in a given population.10 In the present analysis, we explore the fundamental relationships among individual parameters of stenosis severity jet velocity, MPG and AVA and common measures of body size (including height, weight, BSA, body mass index (BMI)) in two distinct populations comprising a total of 4368 patients with the aim of answering the following questions: (1) Do the echocardiographic parameters of aortic valve stenosis severity have a differential correlation with measures of body size? (2) Which method of adjustment adequately corrects for differences in body size? (3) Does adjustment for body size improve predictive accuracy for clinical events in patients with aortic valve stenosis?
Methods
From our database, we identified 2843 consecutive patients (retrospective cohort) investigated at the Bad Krozingen Heart Centre echocardiographic laboratory between January 1998 and December 2010 with normal LV function and a peak aortic transvalvular jet velocity of ≥2.5 m/s. Patients with a moderate or severe mitral or aortic regurgitation, an MPG <10 mm Hg or incomplete data were excluded. Normal LV function was defined as normal global systolic LV function with fractional shortening ≥30% without regional wall motion abnormalities. The second (prospectively followed) cohort was recruited from the Simvastatin/Ezetimibe in Aortic Stenosis (SEAS) study (NCT00092677), which enrolled 1873 patients with asymptomatic aortic valve stenosis, defined by echocardiography at local study centres as aortic valve thickening and transaortic Doppler jet velocity ≥2.5 and ≤4.0 m/s. Patients were randomised from January 2001 to February 2004 to at least 4-year placebo-controlled combined treatment with ezetimibe 10 mg/day and simvastatin 40 mg/day. Patients with coronary heart disease, heart failure, diabetes, history of stroke or peripheral vascular disease, clinically significant mitral valve disease, severe or predominant aortic regurgitation, rheumatic valvular disease, aortic valve prosthesis, or renal insufficiency and patients already on lipid-lowering therapy or having an indication for lipid lowering according to guidelines were excluded. The primary result of the SEAS study showed no difference in major cardiovascular events between treatment and placebo group but a significant reduction in ischaemic events in patients treated with simvastatin/ezetimibe.11 The present study population comprises 1525 (81.4%) of the 1873 patients recruited in the SEAS study with an EF>55% in whom a detailed echocardiographic assessment by the core laboratory was available. Outcome in the current analysis was assessed by aortic valve events, defined as aortic valve replacement, congestive heart failure due to aortic valve stenosis or death from cardiovascular causes.11 Echocardiography was performed following the guidelines for the clinical application of echocardiography12 and has been described in detail previously.11 ,13 Briefly, maximal jet velocity within the valve (v2) was recorded by aligning the continuous wave beam parallel to the stenotic jet. The velocity curve was traced and ΔPm was calculated automatically from the mean of a series of instantaneous velocities (vi) of a single beat measured during the systolic ejection period using the simplified Bernoulli equation ( ). AVA was calculated from the continuity equation (
 , ie,
, ie,  ). In the retrospective cohort maximum velocities and in SEAS velocity time integrals were used. In patients with atrial fibrillation, ΔPm was calculated from a representative (average) beat. Flow velocity in the LV outflow tract (LVOT) v1 was measured by pulsed wave Doppler just below the aortic valve. LVOT area A1 was calculated as A1=π*r2. LVOT diameter (D=2*r) was measured by 2D-Echo (‘inner edge’) in early systole just below the aortic valve using the largest of repeated measurements in the parasternal long-axis view.
Anthropometric data (height and weight) were recorded electronically at the time of echocardiography.
BSA was calculated according to Dubois and Dubois, ,14 and body mass index as
  .
.
Statistics
Pearson's coefficient was calculated for the correlation between each measure of severity of aortic valve stenosis (jet velocity, MPG, AVA) and each measure of body size (height, weight, BSA, BMI). Linear adjustment of valve area by each body size parameter (height, weight, BSA, BMI) was obtained by dividing valve area by the anthropometric parameter (eg, AVA/height, AVA/weight). To assess the effect of adjustment for body size, the Pearson correlation coefficient was calculated between the adjusted variable and the respective measure of body size (eg, correlation between AVA/height and height, AVA/weight and weight). Since adjustment by any parameter should ideally eliminate the correlation of the variable under consideration with that parameter, the resulting Pearson correlation coefficient should be zero. Allometric modelling was performed using non-linear regression based on the equation y=a×xb.4 Time-to-event adjusted receiver operating characteristic (ROC) curves were constructed to compare the ability of parameters of aortic valve stenosis (jet velocity, MPG and AVA adjusted by the different measures of body size) to predict aortic valve events or cardiovascular death. The comparison of areas under the ROC curves was performed as recommended by DeLong et al.15 All statistics were calculated using SPSS software (IBM Corp. statistics V.19.0), MedCalc V.10.3.0 (MedCalc Software, Mariakerke, Belgium) and the R statistical package (http://www.R-project.org/) with continuous variables presented as mean±SD and categorical variables as proportions. A p value of <0.05 was considered statistically significant.
Results
Table 1 summarises clinical, anthropometric and echocardiographic parameters of the two patient populations of 2843 and 1525 patients, respectively. Whereas the retrospective cohort corresponds to the typically encountered patients referred to a tertiary care centre with a wide range of aortic valve stenosis severity, including very severe stenosis,16 the SEAS population represents selected patients with low cardiovascular risk and predominantly mild to moderate stenosis.
Clinical, anthropometric, and echocardiographic characteristics of a total of 4368 patients from two distinct cohorts with significant aortic valve stenosis
Correlation between parameters of aortic valve stenosis severity and body size
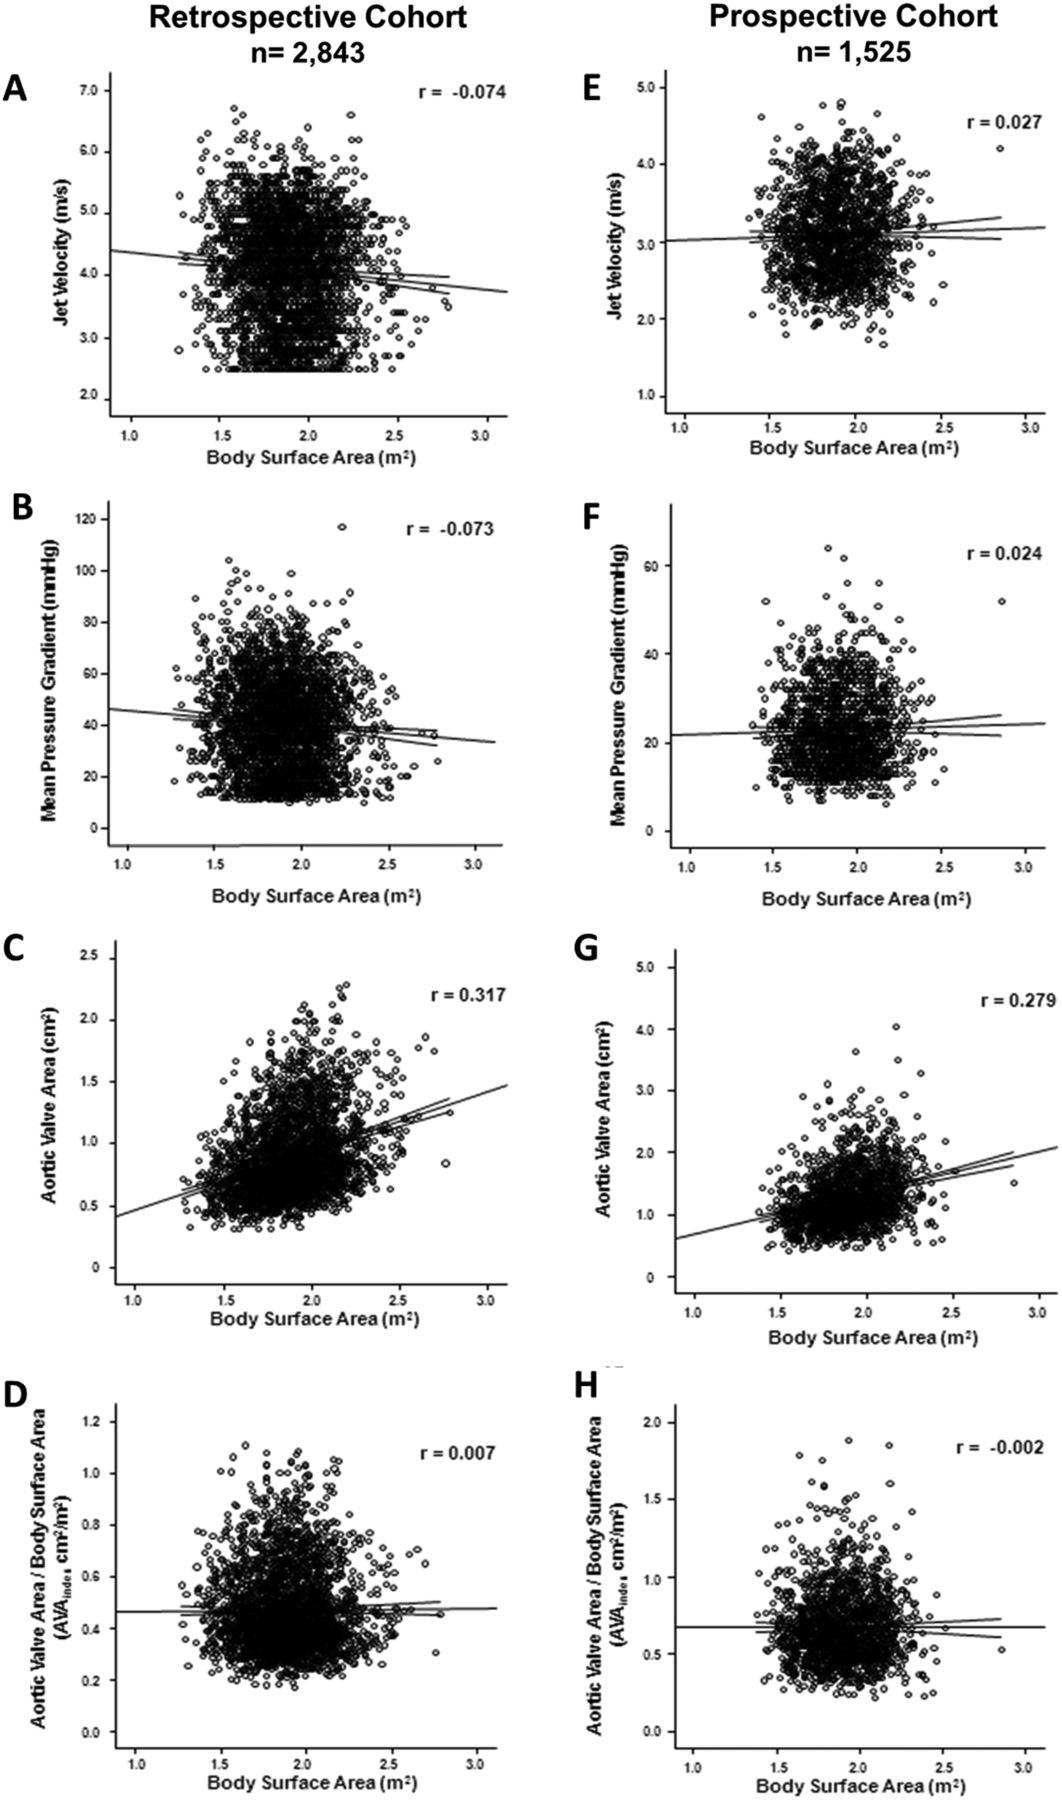
Of the three parameters entered into the continuity equation for the calculation of AVA, the constitutive component, LVOT diameter, showed the strongest correlation with height, weight, BSA and BMI (table 2) whereas the functional parameters, velocity in the LVOT (v1) and jet velocity in the aortic valve (v2) were independent of body size (figure 1A, table 3). Similarly, MPG, which is derived from the same Doppler signal as v2, showed no correlation with body size (figure 1B, table 3). Calculation of AVA resulted in the introduction of a significant correlation between this parameter of severity of aortic valve stenosis and body size to the effect that larger patients had larger valve areas, an effect most pronounced for height (r=0.319) and BSA (r=0.317, figure 1C, table 3). These findings were confirmed in the prospectively followed SEAS population (figure 1E–G, table 3).
Correlation between individual components of the continuity equation and body size
Correlation between echocardiographic parameters of the severity of aortic valve stenosis and measures of body size in a total of 4368 patients with aortic valve stenosis

Correlation between parameters of aortic valve stenosis severity and body surface area (BSA). Individual values of parameters of aortic valve stenosis severity (jet velocity, mean pressure gradient (MPG), aortic valve area (AVA)) and AVA adjusted linearly to BSA (termed AVA index in current guidelines)1 ,2 are plotted against BSA in the retrospective cohort (A–D, left) and the prospectively followed patients (E–H, right). Whereas jet velocity and MPG are independent of BSA (A, B and E, F), AVA shows a substantial correlation with BSA in both populations (C and G) which can be removed by linear adjustment of AVA by BSA (AVA index, D and H).
Linear adjustment of AVA
To compare the effectiveness of linear adjustment of AVA by different measures of body size we calculated correlation coefficients for the normalised variable (AVA divided by each measure of body size) and each measure of body size (height, weight, BSA and BMI). Since following adjustment by body size there should ideally be little or no residual correlation of the adjusted variable with the scaling variable (eg, AVA/BSA with the scaling variable BSA), the resulting Pearson coefficient should be close to zero. At the same time, because the goal is only to remove the effects of body size, the correlation of the adjusted variable with the underlying measurement must remain (ie, AVA/BSA must still correlate with AVA) and the resulting Pearson coefficient here should be close to one.4 Finally, adjustment of AVA by a given measure of body size should also adjust for the remaining parameters (ie, adjustment of AVA by BSA should adjust for BSA and for height, weight and BMI). The correlation coefficients for the various adjustments are summarised in table 3 and exemplarily illustrated for the adjustment of AVA by BSA in figure 1. Among linear adjustments, AVA/BSA was superior to AVA/height, AVA/weight and AVA/BMI with a correlation coefficient close to zero, high residual correlation with AVA and good adjustment for the remaining parameters of body size (height, weight and BMI).
Allometric adjustments
Since the validity of linear adjustment of cardiac dimension by measures of body size has been questioned,4 we constructed allometric (non-linear) models based on height2.04 as suggested by de Simone and colleagues17 or based on non-linear regression using the equation AVA=a×xb. Allometric adjustment with height, weight, BSA and BMI was most effective in eliminating the association with body size with resulting Pearson coefficients between 0.000 and 0.006 while retaining strong correlation with AVA (table 3). Individual scaling factors (a) and scaling exponent (b) for allometric adjustments of AVA by height, weight, AVA, BSA and BMI are summarised in the online supplementary appendix table. As with linear adjustment, allometric adjustment with BSA (and height) appeared the preferable parameter when considering the correlation coefficient, residual correlation with AVA and adjustment for the other parameters of body size.
Predictive accuracy for clinical events
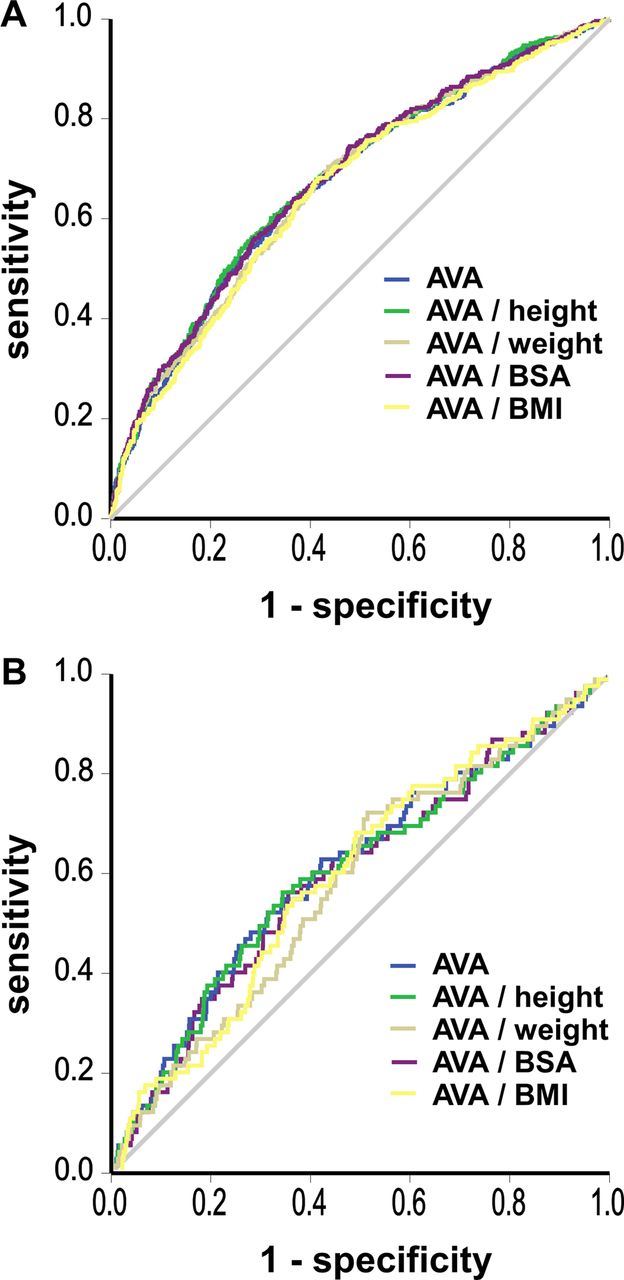
In the prospectively followed cohort of patients with mild to moderate stenosis from SEAS (n=1525) there were 495 aortic valve events, consisting of 431 aortic valve replacements, 21 heart failure due to progression of aortic stenosis and 43 cardiovascular deaths over a mean follow-up of 45.8±14.1 months. Predictive accuracy for aortic valve events was similar for AVA and AVA adjusted by body size regardless of anthropometric measure (figure 2A) and none of the adjustments reached the predictive accuracy of MPG and jet velocity. There was no difference in predictive accuracy for cardiovascular death between any parameter of aortic valve stenosis severity (table 4, figure 2B). Calculation of integrated discriminatory improvement (IDI) demonstrated a small (absolute IDI 0.7%) increase in predictive accuracy for aortic valve events when adjusting AVA by height or BSA (table 5).
Predictive accuracy of echocardiographic parameters for clinical events before and after linear adjustment for measures of body size
Integrated Discriminatory Improvement (IDI)
Diagnostic accuracy of adjusted and unadjusted aortic valve area (AVA) for aortic valve events (A) and cardiovascular death (B).
Discussion
The current study is the first to systematically investigate adjustment of parameters of aortic valve stenosis severity by measures of body size and reports three main findings. First, of the parameters of stenosis severity, only AVA is correlated with body size. Second, adjustment of AVA by BSA or height very effectively removes the confounding effect of body size on the calculation of AVA with a resultant correlation coefficient close to zero while maintaining a strong correlation with AVA. Third, linear adjustment for differences in body size does not substantially improve predictive accuracy for clinical events in a cohort of prospectively followed patients with mild to moderate aortic stenosis.
Differential correlation between parameters of stenosis severity and body size
Recently, we have demonstrated—given the current cut-off values for severe stenosis (AVA<1.0 cm2 and AVAindex<0.6 cm2/m2)—adjustment of AVA by BSA substantially increases the prevalence of aortic valve stenosis in a given population.10 This finding together with the general paucity of data in the literature with respect to adjustment of parameters of aortic valve stenosis severity motivated us to explore the fundamental relationships between these parameters and common measures of body size (height, weight, BSA and BMI). Calculation of Pearson correlation coefficients demonstrated that the functional parameters jet velocity and MPG were independent of body size. In contrast, the calculation of AVA based on the continuity equation calls for the assessment of LVOT diameter, a constitutive parameter, and introduces a correlation with body size to the effect that larger patients exhibit larger valve areas. Consequently, of the three components of the continuity equation for the calculation of AVA (v1=jet velocity in the LVOT, v2=jet velocity in the valve and LVOT diameter), LVOT diameter had the strongest correlation with body size.
Adjustment of AVA by measures of body size
Since larger patients may require a larger valve area or—inversely—since in smaller patients a smaller valve area may suffice, adjustment of AVA by measures of body size is frequently performed. However, so far there are little data to support such an approach. Adjustment of AVA by body size in patients with aortic valve stenosis should facilitate inter-group and intragroup comparisons by removing the effects of differences in patients’ size to assess for the effects of stenosis severity. Because the goal of adjustment by body size is to remove the effects of body size, following normalisation there should ideally be little or no residual correlation of the adjusted variable with the scaling variable (eg, AVA/BSA with the scaling variable BSA).4 At the same time, because the goal is only to remove the effects of body size, the correlation of the adjusted variable with the underlying measurement must remain (ie, AVA/BSA must still correlate with AVA).4 However, in a real world population, this goal is illusive since to achieve little of no residual correlation of the adjusted variable with the scaling variable would imply that the relative severity of the stenosis, notwithstanding body size, is similar in all patients (eg, that all patients with a certain BSA have the same AVA), which obviously is not the case. Conversely, the same would have to be true for the Pearson correlation coefficient between AVA/BSA and AVA to be close to one. In light of these hypothetical considerations, the current study demonstrates that linear adjustment of AVA by BSA or height effectively removes the confounding effect of body size on the calculation of AVA and that such adjustment maintains a strong correlation with AVA, thereby underlining that the inherent severity of a given stenosis is dependent on the two factors, AVA and BSA.
Body weight and BMI, in contrast, proved inadequate to adjust for differences in body size. For example, the correlation between AVA and BMI (r=0.126) was not removed by adjustment for BMI but rather increased (r=−0.284) and shifted from positive to negative suggesting overcorrection when adjusting by this parameter.
Linear versus allometric adjustment
Published reports on adjusting cardiac dimensions by measures of body size indicate that linear adjustment may be inadequate to account for differences in body size and an allometric approach may be more scientifically correct.4–7 For instance, Neilan et al4 demonstrated that adjustment of the left atrial diameter for differences in body size was best performed using an allometric approach based on body weight and LV mass may best be adjusted by an allometric model using BSA.7 On the other hand, with respect to AVA, a study in healthy volunteers demonstrated a linear relationship between AVA and BSA, at least for a BSA ranging from 1.84 to 2.2 m2.9 The current analysis extends these findings to patients with aortic valve stenosis and supports linear adjustment of AVA by BSA as recommended in current valvular heart disease guidelines.1 ,2 The allometric adjustments performed with non-linear regression based on height2.04 or on the equation AVA=a×BSAb were also very effective in removing the consequence of body size on AVA. However, Tanner5 clearly showed that linear adjustment is permissible when the coefficient of variance (CV, SD divided by the mean) for the body size variable (CVx) divided by the CV of the dependent variable (CVy) is equal to the Pearson correlation coefficient (r). This is indeed the case for our two populations as can be calculated from the data provided (retrospective cohort: CVBSA/CVAVA=0.106/0.360=0.295 relating to a Pearson coefficient of 0.317; SEAS population: 0.104/0.359=0.290 relating to a Pearson coefficient of 0.279). Consequently, the projected difference in AVA between linear (AVA/BSA) and allometric (AVA=a×BSAb) adjustment for a patient with a BSA two SDs above the mean (eg, 2.26 m2 in the retrospective cohort) is less than 2% (see online supplementary appendix figure). From these calculations, it becomes apparent that linear adjustment of AVA by BSA as suggested by current valvular heart disease guidelines represents a simple and statistically correct method to account for differences in body size at least in patients with a BSA between 1.5 and 2.3 m2.
Limitations
When performing linear adjustment of AVA by BSA, three caveats need to be considered. First, outcomes data relate to patients with mostly mild to moderate stenosis 11 and patients with more advanced disease may still benefit from adjustment of AVA. Analysing the SEAS population according to the last available echo—by which time stenosis severity had increased and 33% of patients had an MPG >40 mm Hg—adjustment by body size also failed to improve predictive accuracy for aortic valve events or cardiovascular death (data not shown). Therefore, further outcomes studies including patients with more advanced disease are warranted. Second, linear adjustment of AVA by BSA (rather than allometric adjustment) is possible only because ‘special circumstances’ regarding the study populations are present as outlined above.5 Populations with substantially different anthropometric characteristics might need other methods of adjustment.18 Third, the current analysis provides compelling evidence that linear adjustment of AVA by BSA adequately accounts for the association between AVA and body size in patients with aortic valve stenosis. However, this finding does not extend to cut-off values for AVA and BSA-adjusted AVA (AVAindex) currently used to define when a stenosis is considered severe.10
Conclusions
To improve comparability between patients with aortic valve stenosis and different body sizes, linear adjustment of AVA by BSA can be performed without, however, increasing predictive accuracy for clinical events in patients with mild to moderate aortic valve stenosis.
Key messages
What is already known on this subject?
There is very little information in the literature whether adjustment of parameters of aortic valve stenosis severity by measures of body size improves the comparability between individual patients or increases the predictive accuracy with respect to clinical events. In fact, recently it has been shown that adjustment of aortic valve area by body surface area with a cut-off of 0.6 cm2/m2 inadequately increases the prevalence of severe stenosis.
What this study adds?
First, it helps to broaden our understanding of the potentials (and pitfalls) of adjusting stenosis severity by measures of body size. Second, it might help to standardise assessment of stenosis severity by improving the comparability between individual patients and thereby improve patient care.
How might it impact clinical practice?
In patients with aortic valve stenosis the correct grading of stenosis severity is critical in clinical management.
In general, the current manuscript might help to standardize the assessment of stenosis severity by improving the comparability between individual patients.
More specifically, the manuscript supports the current practice of adjusting aortic valve area by body surface area, albeit with a new cut-off value for severe stenosis.
References
Supplementary materials
Supplementary Data
This web only file has been produced by the BMJ Publishing Group from an electronic file supplied by the author(s) and has not been edited for content.
Files in this Data Supplement:
- Data supplement 1 - Online supplement
Footnotes
-
Contributors JM as corresponding author acts as guarantor. NJ, CG-B and JM were involved in the study conception and design; acquisition, analysis and interpretation of data; drafted the article and gave final approval of the manuscript. BAK, EB, EG, KB, JBC, CAN, RW, KW, IH, TRP and F-JN were involved in interpretation of data, revising the article and final approval of the manuscript.
-
Competing interests None.
-
Provenance and peer review Not commissioned; externally peer reviewed.