Article Text

Abstract
Introduction During the COVID-19 pandemic, excess mortality has been reported, while hospitalisations for acute cardiovascular events reduced. Brazil is the second country with more deaths due to COVID-19. We aimed to evaluate excess cardiovascular mortality during COVID-19 pandemic in 6 Brazilian capital cities.
Methods Using the Civil Registry public database, we evaluated total and cardiovascular excess deaths, further stratified in specified cardiovascular deaths (acute coronary syndromes and stroke) and unspecified cardiovascular deaths in the 6 Brazilian cities with greater number of COVID-19 deaths (São Paulo, Rio de Janeiro, Fortaleza, Recife, Belém, Manaus). We compared observed with expected deaths from epidemiological weeks 12–22 of 2020. We also compared the number of hospital and home deaths during the period.
Results There were 65 449 deaths and 17 877 COVID-19 deaths in the studied period and cities for 2020. Cardiovascular mortality increased in most cities, with greater magnitude in the Northern capitals. However, while there was a reduction in specified cardiovascular deaths in the most cities, the Northern capitals showed an increase of these events. For unspecified cardiovascular deaths, there was a marked increase in all cities, which strongly correlated to the rise in home deaths (r=0.86, p=0.01).
Conclusion Excess cardiovascular mortality was greater in the less developed cities, possibly associated with healthcare collapse. Specified cardiovascular deaths decreased in the most developed cities, in parallel with an increase in unspecified cardiovascular and home deaths, presumably as a result of misdiagnosis. Conversely, specified cardiovascular deaths increased in cities with a healthcare collapse.
- acute coronary syndromes
- health care delivery
- stroke
- coronary artery disease
This article is made freely available for use in accordance with BMJ’s website terms and conditions for the duration of the covid-19 pandemic or until otherwise determined by BMJ. You may use, download and print the article for any lawful, non-commercial purpose (including text and data mining) provided that all copyright notices and trade marks are retained.
https://bmj.com/coronavirus/usageStatistics from Altmetric.com
Introduction
The COVID-19 pandemic was decreed by WHO on 11 March 2020. Since the first case was notified in Brazil in 26 February, the epidemic has evolved rapidly, and in 23 June, >1 136 470 cases have been reported in the country, with almost 51 271 deaths.1
Beyond deaths due to confirmed COVID-19, previous reports have also emphasised an increase in the number of total deaths during the pandemic compared with the same period of previous years: the excess mortality. From March to May 2020, the excess of deaths in Italy was 49%, reaching 277% in New York City.2 Of note, excess of all-cause deaths in this period may have occurred due to identified or non-identified COVID-19 or other causes, being an objective and comparable metric for evaluating the true impact of the pandemic in the mortality of a location.3
Concomitantly, there has been a decrease in hospital admissions associated with acute cardiovascular diseases, markedly acute coronary syndromes (ACS), in high-income countries (HIC). In Northern Italy, a significant decrease in hospital daily admissions due to ACS during the pandemic was reported.4 In parallel, a 58% increase in out-of-hospital cardiac arrest, strongly associated with cumulative COVID-19 incidence, was also observed.5 In the USA, an estimated 38% reduction in cardiac catheterisation laboratories activations due to ST-elevation myocardial infarction was described,6 similar to the 40% reduction in Spain.7 This behaviour may be associated with avoidance of medical care due to social distancing and concerns of contracting COVID-19, and misdiagnosis. Moreover, in regions where healthcare resources became scarce during the pandemic, excess deaths may have occurred due to healthcare collapse, reinforcing social disparities in the death tolls.
The pandemic has been delayed in low-income and middle-income countries (LMICs), and how cardiovascular diseases will behave in LMIC is a matter of debate. Brazil, a middle-income country, is ranked second in the number of deaths due to COVID-19.1 However, deaths are heterogeneously distributed across the country and numbers are underestimated due to the low rate of COVID-19 diagnostic tests performed.1 Using data from the civil registry database, we aimed to evaluate excess cardiovascular mortality during the COVID-19 pandemic in six Brazilian capital cities from 15 March to 22 May 2020.
Methods
Data sources
Data analytic methods and study materials will be made available to other researchers for purposes of reproducing the results or replicating the procedure, from the corresponding author on reasonable request.
We conducted an observational retrospective study using the Civil Registry public database (Transparency Portal)8 from ARPEN-Brasil for mortality data. ARPEN (Associação dos Registradores de Pessoas Naturais, National Association of Natural Persons Registrars) represents the class of Civil Registry Officers in the country, and performs the certifications of civil life of all Brazilian citizens, including death certificates (DC). We used registers from the six Brazilian capitals with more COVID-19 deaths: São Paulo, Rio de Janeiro, Fortaleza, Recife, Belém and Manaus, from the epidemiological week of the first documented death due to COVID-19 in Brazil (17 March) to 22 May 2020 (12–22 epidemiological weeks), and compared observed with expected deaths.
Data were not compared with the Brazilian Mortality Information System (SIM), which is officially used by the government, because it is only publicly available in the following year.
Table 1 shows the region of Brazil, population, health resources and human development index (HDI) for the six capital cities. The HDI for each city was extracted from Atlas de Desenvolvimento Humano no Brasil (Atlas of Human Development in Brazil),9 being a summary measure of socioeconomic development, which uses life expectancy, years of schooling and gross national income per capita; and is expressed on a scale of 0–1, being better if closer to 1.10 The number of intensive care unit (ICU) beds of each capital city was extracted from the most updated Geography and Statistics Brazilian Institute (Instituto Brasileiro de Geografia e Estatística) database, and the numbers of physicians and nurses per 100 000 inhabitants derived from the Public Health System database (DataSUS).11 These variables were used to provide context regarding socioeconomic development and health resources.
Sociodemographic characteristics and total deaths in six selected Brazilian capital cities during epidemiological weeks 12–22, in 2019 and 2020
Our data are based on the DC registered in notaries, with only one cause presented for each death. In a regular DC, the cause(s) of death is(are) declared in part I (lines a, b, c, d), with the underlying cause in the last line, according to the 10th revision of the International Statistical Classification of Diseases rules. Part II records other significant causes that may have contributed to death. In the present analysis, in addition to COVID-19 reported as a suspected or confirmed cause of death, we also assessed other causes related to COVID-19 (table 2).
Hierarchical data mining procedure to assess natural causes of death in the death certificate to define one cause per death, and other related conditions
We classified deaths associated with conditions reported in table 2 according to: a) date of death; b) location (by state and city declared in the DC) and c) place of death (hospital or home). SARS was the second condition, because SARS is usually reported in DC when COVID-19 was not confirmed by testing. The Transparency Portal8 is frequently updated by the Civil Registry Offices following legal deadlines: the family has 24 hours to register the death in the notary, which has 5 days to perform the official registration, and 10 days to send the act to the information centre, which updates the public database. As civil registration is required for all legal procedures following death, including burial, it is expected that the majority of deaths are registered, particularly in capital cities. Of note, data are only publicly available for 2019 and 2020, precluding comparison with previous years.
Patient involvement
Patients and public were not involved in the design and conduct of this research.
Statistical analysis
A hierarchical procedure was applied to the raw database8 on 19 June 2020, and data were mined according to the dictionary of search terms detailed in online supplemental table 1. The search terms were grouped based on a standardised dictionary and treated based on the IRIS software12 and text mining methods were additionally applied to search for terms that identify the final diseases. A hierarchical procedure was then carried out to assess all natural causes declared in the DC and select only one cause per death, and other related conditions, as detailed in table 2.
Supplemental material
The following variables regarding mortality were used for each city: total number of deaths in 2019 and 2020; excess mortality calculated using the difference between observed deaths and expected deaths in 2020, given the death rate in 2019 and the size of the population in 2020, and excess mortality of non-COVID deaths in 2020 as a percentage of the total expected number of non-COVID deaths in 2020. Proportional excess mortality, and their respective 95% CIs, were estimated using Poisson regression models. Moreover, we report number of deaths and excess mortality for ACS (condition 3), stroke (condition 4), specified cardiovascular deaths (sum of conditions 3 and 4), unspecified cardiovascular disease (sum of conditions 6, 7 and 8) and total cardiovascular deaths (sum of conditions 3, 4, 6, 7 and 8). Deaths were classified by place of death (hospital and home). Mortality rates per 100 000 inhabitants were calculated dividing the number of deaths of a specific condition by the estimated population of each capital in the same year.13 14 Mortality rates herein reported were not age-standardised.
Lastly, we evaluated the Pearson’s correlation coefficient for unspecified cardiovascular deaths and home deaths. A bicaudal p value<0.05 was considered statistically significant.
Results
Table 1 shows demographic, health resources data and the number of total and excess all-cause deaths in the six selected capital cities. Capital cities in the Southeast region (São Paulo and Rio de Janeiro) are more developed, compared with cities in the Northeast (Fortaleza and Recife) and North (Belém and Manaus) regions, as denoted by the HDI. Comparing with expected deaths in 2020, there was an excess in total deaths for all capital cities, with greater magnitude in the cities with lower HDI. However, when excess mortality of non-COVID deaths were evaluated, it was only relevant in the capital cities in the North region and Recife. Figure 1 depicts that the number of excess deaths in São Paulo, Rio de Janeiro and Fortaleza are mostly explained by COVID-19 deaths, while in Belém and Manaus, there was a further excess. In Recife, there was a high number of SARS deaths what, together with COVID-19 deaths, explained the excess mortality. As such, excess mortality by causes other than COVID-19 and SARS were more relevant in Belém and Manaus (North).

Horizontal bar graphs with mortality per predefined causes (from the data mining algorithm, including cardiovascular causes), per selected Brazilian capital city, in 2019 and 2020.
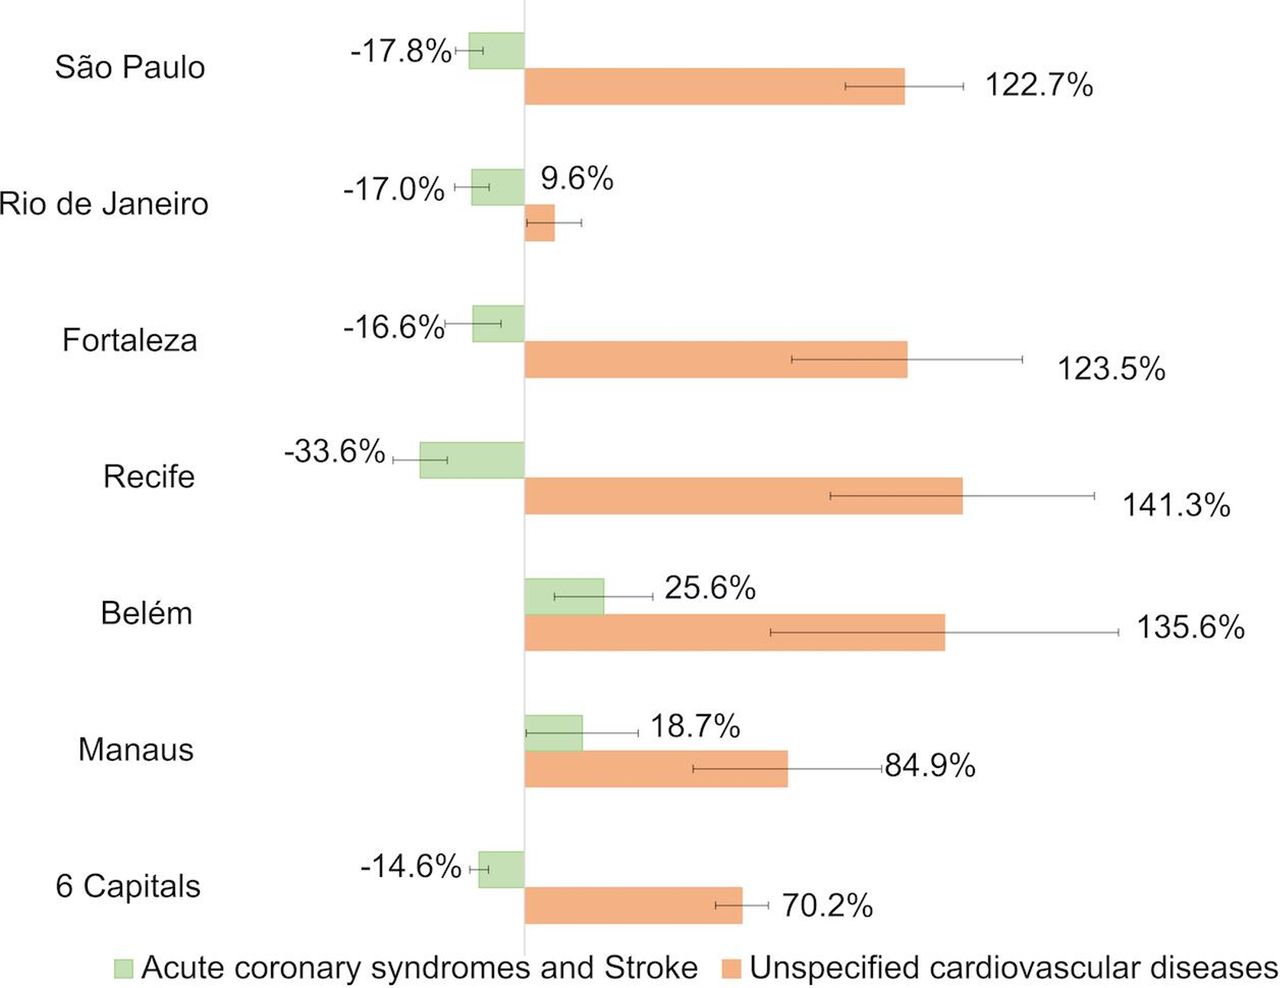
As the contribution of other causes to total deaths changed from 2019 to 2020, we evaluated the trends in cardiovascular deaths. Table 3 reveals that, except for Rio de Janeiro and Recife, there was an excess in total cardiovascular deaths in the other cities, again with greater magnitude in the Northern cities. When considering specific causes, there was a reduction in specified cardiovascular deaths, except in the Northern capitals, where there was an increase. For unspecified cardiovascular deaths, there was a substantial increase in all capital cities. Online supplemental figure 1 shows these changes along the studied period, revealing that the rise in unspecified cardiovascular deaths occurred in parallel with the reduction of ACS. Figure 2 illustrates the above data, showing the per cent change in deaths per capital city caused by specified cardiovascular deaths (ACS plus stroke) and unspecified cardiovascular causes and figure 3 summarises the findings.
Supplemental material
Cardiovascular (CV), acute coronary syndromes (ACS), stroke and unspecified CV deaths in six selected Brazilian capital cities during epidemiological weeks 12–22, in 2019 and 2020

Per cent change with 95% CIs between the observed and expected number of deaths in 2020 for specified cardiovascular deaths (acute coronary syndromes and stroke) and unspecified cardiovascular diseases per selected six capital cities.

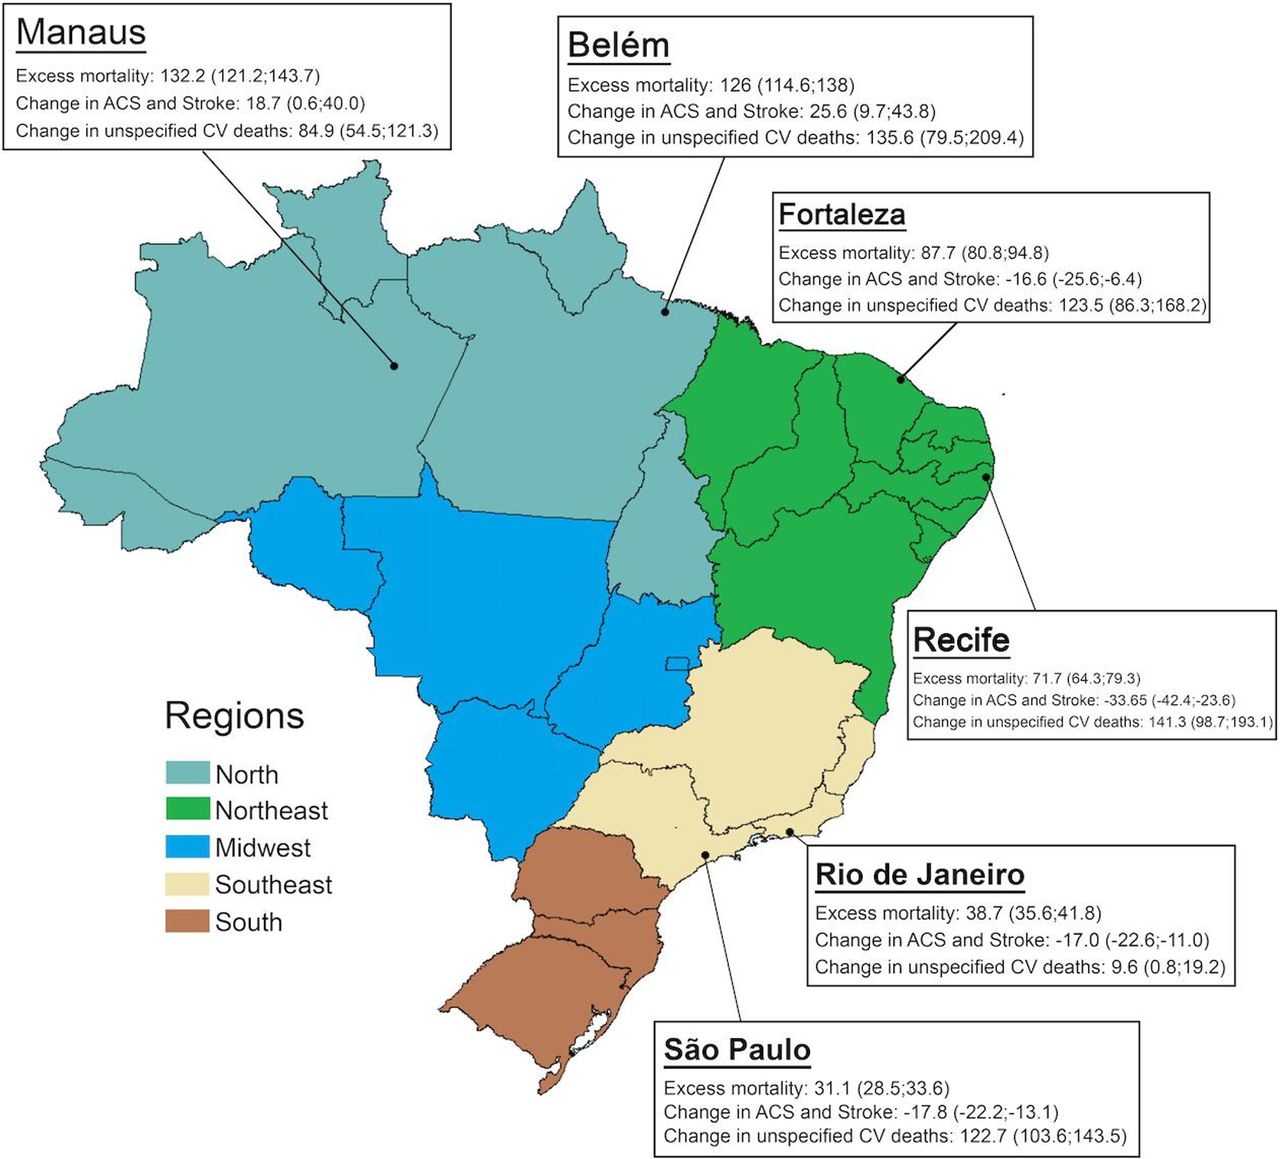
Map of Brazil showing the six capital cities with higher number of COVID-19 deaths from epidemiological weeks 12–22 in 2020. The boxes summarise the main findings for each capital city comparing observed with expected deaths in 2020, in the period cited above: excess mortality, change in specified cardiovascular (CV) deaths (acute coronary syndromes (ACS) plus stroke), and change in unspecified CV deaths. Data are reported as % and 95% CIs.
Regarding place of death, figure 4A,B demonstrates the observed number of hospital and home deaths along the studied period in 2020 compared with expected deaths. Although the increase in deaths is seen in both settings, in hospitals it was mainly explained by COVID-19 and SARS, while the same did not happen for home deaths.
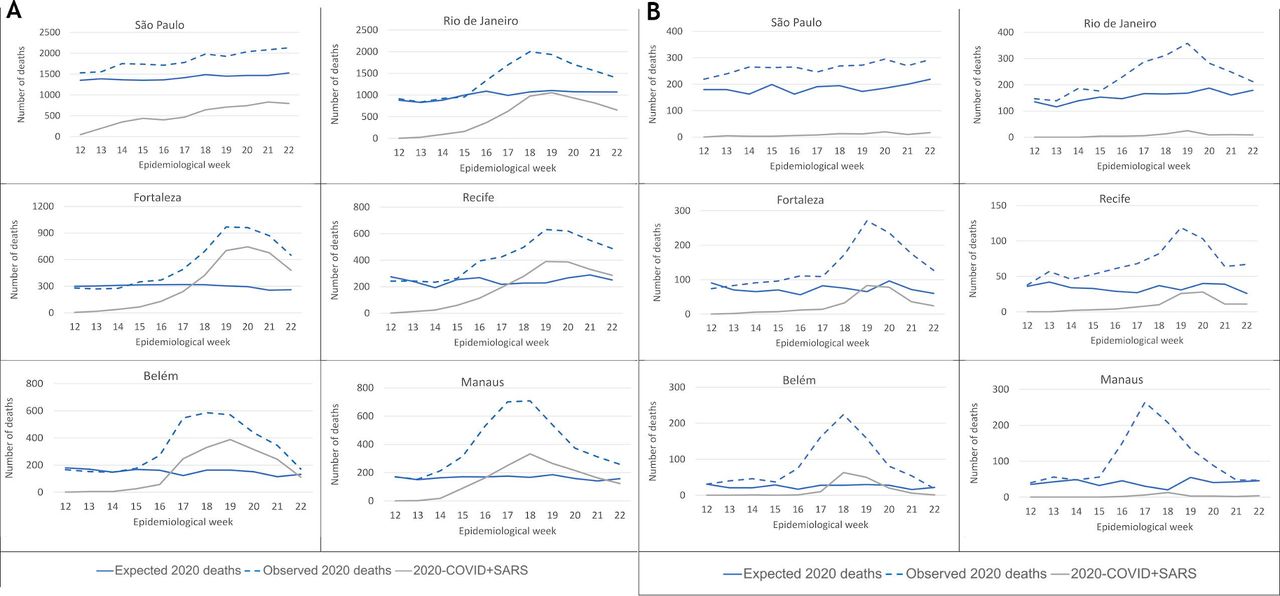
(A) Total number of observed and expected hospital deaths in 2020 and deaths associated with COVID-19 and SARS in 2020. (B) Total number of observed and expected home deaths in 2020 and deaths associated with COVID-19 and SARS in 2020.
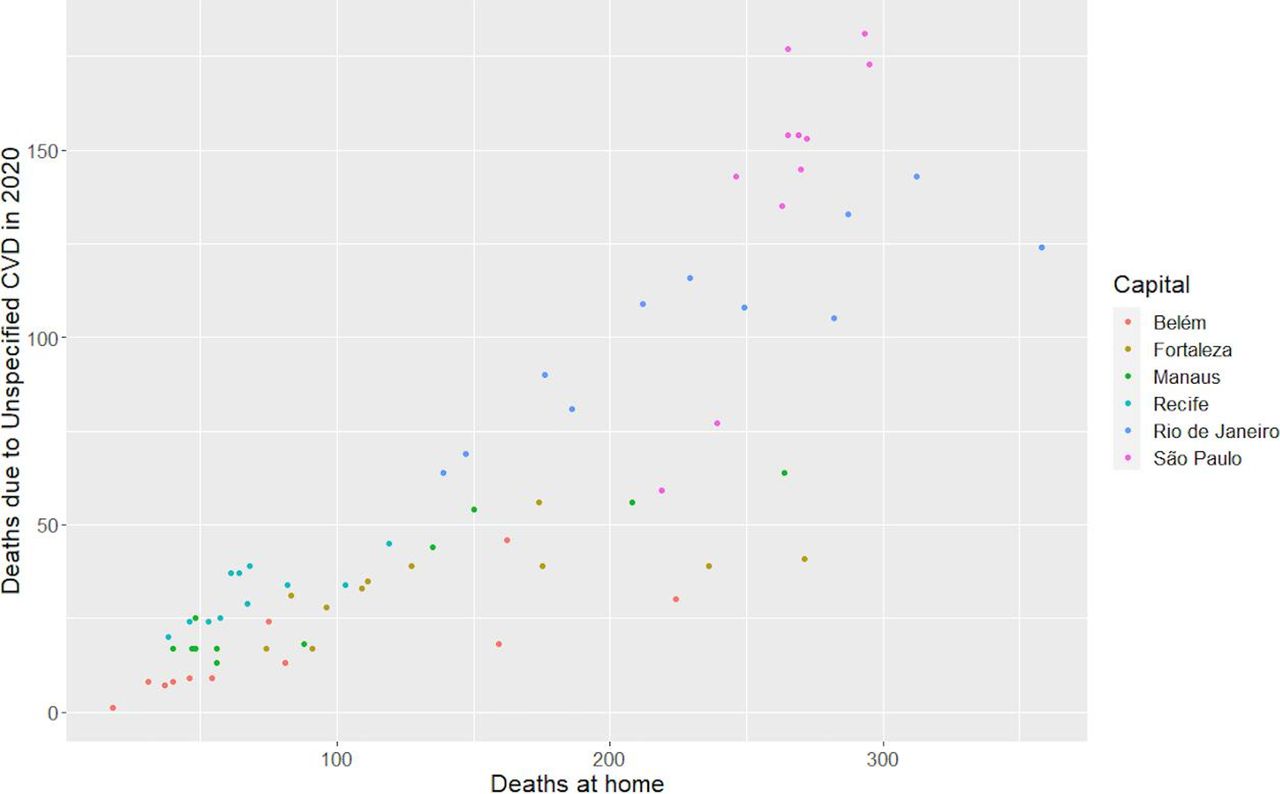
Lastly, figure 5 shows that the increase in unspecified cardiovascular deaths in 2020 during the studied period had a positive and strong correlation to the number of home deaths (r=0.86, p=0.01).
Correlation between home deaths and deaths from unspecified cardiovascular causes by epidemiological week (coloured dots) in six selected Brazilian capital cities in 2020.
Discussion
Our data—the first comprehensive analysis of the Brazilian civil registry looking for specific patterns of excess mortality during the COVID-19 pandemic—show an excess of total mortality in the six capital cities with highest numbers of COVID-19 deaths, markedly in the Northern capitals. Excess cardiovascular mortality occurred in most cities, due to a rise in unspecified cardiovascular causes, except in the Northern cities, where specified cardiovascular deaths, defined as ACS plus stroke, also increased significantly. In the other cities, there was a reduction of deaths due to specified cardiovascular deaths, which paralleled with increasing numbers of unspecified cardiovascular deaths, strongly correlated to the rise of home deaths. The increase in specified cardiovascular deaths in Northern cities differ from what has been described in HIC, and may anticipate the behaviour of ACS and stroke deaths in deprived regions, prone to collapse of health systems.
The Brazilian civil registry database has the advantage of being the only promptly available data source for mortality, with relatively short delays, important features during a pandemic. On the other hand, the records serve demographic—and not epidemiological—purposes, and are not the official source of mortality data for Brazil. Thus, there are no investigation, codification or redistribution of causes of deaths. Because of that, the official SIM data may diverge in the future, in relation to the Civil Registry. However, the direct analysis of DC may partially overcome the risks of using official data, especially in countries lacking transparency for death reports. To minimise the delays in notifications, we opted to include only capital cities in the present analysis. Furthermore, as we aimed to investigate the impact of COVID-19 on excess mortality, the choice for locations with highest numbers of deaths from the disease (>1000) may provide better insights about health system overload and effects on deaths from other causes, as COVID-19 may have direct or indirect effects on key physiologic systems, such as pulmonary, renal and cardiovascular.15
There are several issues in the distribution of health resources in Brazil, which are concentrated in the more developed locations.16 From the cities included in this analysis, it is possible to infer a clear gradient between HDI—a measure of socioeconomic development—and excess mortality, especially in the two Northern cities of the lower socioeconomic bound. This is possibly associated with the baseline preparedness of local health systems, regarding hospital infrastructure and availability of high-level staff,17 as well as access to healthcare and emergency transport systems. Medical workforce is unequally distributed in Brazil, and the lowest numbers of nurses, physicians and specialists per inhabitant are in the North region.17 Interestingly, the number of ICU beds per 100 000 inhabitants was not a proxy for healthcare status in this analysis, although collapse of intensive care resources was reported as a marker of disastrous epidemiological scenarios.18 19 This finding may be explained by the fact that healthcare resources in less developed Brazilian states, particularly in the North region, are concentrated in capital cities, which therefore suffer the impact of the pandemic in the whole state.11 Furthermore, the territories of the Amazonas and Pará states, in the Amazon region, are vast and lack paved roads and transport infrastructure, what certainly potentialised the impacts of COVID-19. This suggests that the relation of socioeconomic conditions and excess mortality is beyond the disparity in health resources.20
Besides local infrastructure, the availability of COVID-19 tests differed widely between Brazilian regions—even within the same region1—and this might have contributed to the heterogeneity of death reports. Presumably, there was underreporting in the whole country, considering the estimated number of tests per million inhabitants.1 Also, the cities included in this analysis had different approaches for regulatory measures21: while government decrees for social distancing policies were adopted from 17 March in some capitals—especially in the South and Southeast—there was a considerable delay in others, noticeably in the North.21 Thus, our analysis reflects different stages of the pandemic, and numbers may have a dynamic behaviour over time.
Our results, with a significant reduction of specified cardiovascular deaths in four capital cities, may look counterintuitive, considering the reported cardiovascular effects of COVID-19 that may occur through: direct myocardial invasion by the virus, increased metabolic demand and systemic inflammatory response contributing to an induced prothrombotic state.22–24 Moreover, an increase in risk factors for cardiovascular disease—such as tobacco use and reduced physical activity—has also been reported during the pandemic.25 From our data, thrombotic causes of death (specified cardiovascular deaths: ACS plus stroke) increased only in the two Northern capitals experiencing healthcare collapse. However, the reduction observed in the other cities paralleled with the increasing occurrence of home deaths and deaths with unspecified cardiovascular cause. This may be explained by four factors: limited access to hospitals in locations where an overload was being experienced, avoidance of medical care due to social distancing or concerns of contracting COVID-19 in the hospital, and isolation that impairs the detection of cardiovascular symptoms by others,5 7 and even misuse of drugs, such as hydroxychloroquine, which can precipitate arrhythmias and has been recommended by the Brazilian government.11 26 The strong positive correlation between the rise in unspecified cardiovascular and home deaths corroborates these explanations, as it may suggest that at least some of the missed ACS and stroke deaths occurred at home, precluding correct diagnosis. Conversely, specified cardiovascular deaths may have decreased in some locations due to competing risks, and reduced exposure to secondary triggers of acute cardiovascular events, such as air pollution.27 In fact, ambient air pollution and climate changes may be implicated in the incidence of both, cardiovascular events and COVID-19.28 29
Besides patient-based factors, reorganisation of acute care systems, such as: deactivation of services to meet urgent needs of emergency or intensive care, delimitation of COVID-specific hospitals and implementation of alternative therapeutic pathways, which aim to mitigate the effects of the pandemic may further prevent patient presentation to medical care.4–7 Thus, public campaigns are warranted to raise awareness about the importance of cardiovascular care, even during this challenging period. Of note, the deleterious effects on cardiovascular events may last longer than the pandemic itself, as primary and secondary preventions are being delayed in this context.30
Limitations and strengths
Our study has several limitations. At first, we used raw data extracted from the Civil Registry, without epidemiological adjustments. Thus, there was no investigation, codification or reclassification of deaths declared, nor a specific methodology for redistribution of garbage codes. Second, the data mining algorithm considered all causes reported in the DC, without hierarchical classification or identification of the underlying cause of death. This is a technical limitation of the ARPEN database, and might lead to misidentification of causes. Moreover, the delays in reporting may be differential across locations, and that is why capital cities—which are less prone to delays—were chosen for our analysis. Fourth, the ARPEN portal was only available for 2019 and 2020, limiting the comparison with the historic series. Lastly, the availability of COVID-19 tests is heterogeneous between Brazilian regions, what may further impact case reporting. However, despite these limitations, this is the most promptly available data source in Brazil on excess mortality in the COVID-19 pandemic, allowing for important epidemiological insights. The release of SIM data, in the near future, will certainly provide more accurate data, considering its different methodology for reporting deaths, including active investigation and standardised classification of causes of death.
Conclusion
In the six Brazilian capital cities with higher numbers of deaths due to COVID-19, there was an excess mortality, with greater magnitude in the more deprived cities regarding socioeconomic development and health resources. In general, cardiovascular deaths increased mainly as a result of unspecified cardiovascular causes, which correlated with the rise in home deaths, presumably as a result of impaired access to healthcare leading to misdiagnosis of specific cardiovascular causes, such as ACS and stroke. In the Northern cities, however, excess deaths occurred for specified cardiovascular deaths, in addition to unspecified cardiovascular causes, what differs from reports of HIC and is possibly associated with worse health infrastructure. As the pandemic advances to LMIC, investments in health resources, prioritising socioeconomically disadvantaged locations and public awareness campaigns focused on acute cardiovascular care are of utmost importance to mitigate the pandemic impact.
Key messages
What is already known on this subject?
During the pandemic, beyond deaths due to confirmed COVID-19, there seems to be an increase in the total number of deaths compared with previous years in Brazil.
Excess mortality may have occurred due to identified or not COVID-19 or other causes, being an objective and comparable metric for healthcare evaluation.
What might this study add?
In the six Brazilian capitals with higher numbers of deaths due to COVID-19, the impact of the pandemic in the excess all-cause and cardiovascular deaths was noticeable, especially in regions where health systems collapsed, which are the most socioeconomically deprived.
In the other capital cities, the decreasing number of deaths associated with specified cardiovascular events (acute coronary syndromes plus stroke) paralleled with more frequent unspecified cardiovascular and home deaths.
How might this impact on clinical practice?
Investments should be prioritised to areas where the pandemic resulted in health system collapse.
During periods of social distancing, campaigns and strategies to increase the population’s awareness of cardiovascular care, health promotion practices, seeking services in the case of acute signs and symptoms, should be prioritised by governments.
References
Supplementary materials
Supplementary Data
This web only file has been produced by the BMJ Publishing Group from an electronic file supplied by the author(s) and has not been edited for content.
Footnotes
Twitter @ramosnas
GMMO and ALPR contributed equally.
Contributors Conception and design of the research: MAQL, GMMO, ALPR, LCCB, BRN. Acquisition of data: ALPR, MAQL, GMMO and DCM. Analysis and interpretation of data: LCCB, BRN, RAT, GMMO, DCM, ALPR. Statistical analysis: RAT. Obtaining financing: N/A. Writing of the manuscript: LCCB, BRN. Critical revision of the manuscript for intellectual content: all authors. Authors responsible for the overall content as guarantors: LCB, BN, TR.
Funding ALPR was supported in part by CNPq (Bolsa de produtividade em pesquisa, 310679/2016–8) and by FAPEMIG (Programa Pesquisador Mineiro, PPM-00 428-17). BRN was supported in part by CNPq (Bolsa de produtividade em pesquisa, 312382/2019-7), and by the Edwards Lifesciences Foundation (Every Heartbeat Matters Program 2020); DCM was supported in part by CNPq (Bolsa de produtividade em pesquisa, 308250/2017–6), and by FAPEMIG (Programa Pesquisador Mineiro).
Competing interests None declared.
Patient consent for publication Not required.
Ethics approval This study was approved by the Universidade Federal de Minas Gerais Institutional Review Board.
Provenance and peer review Not commissioned; externally peer reviewed.
Data availability statement Data analytic methods and study materials will be made available to other researchers for purposes of reproducing the results or replicating the procedure, from the corresponding author on reasonable request.
Supplemental material This content has been supplied by the author(s). It has not been vetted by BMJ Publishing Group Limited (BMJ) and may not have been peer-reviewed. Any opinions or recommendations discussed are solely those of the author(s) and are not endorsed by BMJ. BMJ disclaims all liability and responsibility arising from any reliance placed on the content. Where the content includes any translated material, BMJ does not warrant the accuracy and reliability of the translations (including but not limited to local regulations, clinical guidelines, terminology, drug names and drug dosages), and is not responsible for any error and/or omissions arising from translation and adaptation or otherwise.