Article Text

Abstract
Objectives Current estimates of aortic stenosis (AS) frequency have mostly relied on cross-sectional echocardiographic or longitudinal administrative data, making understanding of AS burden incomplete. We performed case adjudications to evaluate the frequency of AS and assess differences by age, sex and race in an older cohort with long-term follow-up.
Methods We developed case-capture methods using study echocardiograms, procedure and diagnosis codes, heart failure events and deaths for targeted review of medical records in the Cardiovascular Health Study to identify moderate or severe AS and related procedures or hospitalisations. The primary outcome was clinically significant AS (severe AS or procedure). Assessment of incident AS burden was based on subdistribution survival methods, while associations with age, sex and race relied on cause-specific survival methods.
Results The cohort comprised 5795 participants (age 73±6, 42.2% male, 14.3% Black). Cumulative frequency of clinically significant AS at maximal 25-year follow-up was 3.69% (probable/definite) to 4.67% (possible/probable/definite), while the corresponding 20-year cumulative incidence was 2.88% to 3.71%. Of incident cases, about 85% had a hospitalisation for severe AS, but roughly half did not undergo valve intervention. The adjusted incidence of clinically significant AS was higher in men (HR 1.62 [95% CI 1.21 to 2.17]) and increased with age (HR 1.08 [95% CI 1.04 to 1.11]), but was lower in Blacks (HR 0.43 [95% CI 0.23 to 0.81]).
Conclusions In this community-based study, we identified a higher burden of clinically significant AS than reported previously, with differences by age, sex and race. These findings have important implications for public health resource planning, although the lower burden in Blacks merits further study.
- epidemiology
- aortic valve stenosis
Data availability statement
Data are available from the authors on reasonable request.
Statistics from Altmetric.com
Introduction
Calcific aortic valve disease (CAVD) is a biologically active disorder that can progress to severe aortic stenosis (AS).1 Onset of symptoms heralds a poor prognosis2 unless outflow obstruction is relieved by aortic valve replacement (AVR).3 There are as yet no proven medical therapies for CAVD.2
There remain notable gaps in our understanding of the population burden of severe AS. Epidemiological studies have provided information on the frequency of CAVD, but have relied principally on echocardiographic screens4–8 or administrative data,9–11 often reporting point prevalences of disease. Such cross-sectional estimates are apt to underestimate the burden of disease, while hospitalisation-related administrative data can lead to misclassification.10 11 Moreover, much of the available information on prevalence and incidence drawn from administrative data captures both moderate and severe AS,9–11 aggregates AS of any severity,12 or combines AS and aortic regurgitation,13 such that specific figures for severe AS are lacking. Such features also limit exisiting studies of race differences in CAVD.14 15
We addressed these gaps in a racially mixed study of older adults that performed standardised echocardiography and subsequent surveillance for cardiovascular events by validating all administrative or clinically suspected cases of important AS over long-term follow-up.
Methods
Study population
The Cardiovascular Health Study (CHS) is a longitudinal investigation of cardiovascular disease in community-dwelling adults ≥65 recruited from random age-stratified and sex-stratified Medicare eligibility lists at four U.S. centres.16 In 1989–1990, a first cohort (n=5201) was enrolled, followed in 1992–1993 by a second cohort (n=687) to increase Black representation.17 Visits included history, physical and laboratory assessments. Participants were not involved in the design, conduct, reporting, or dissemination of this research.
Echocardiography was performed in 1989–199918 (first cohort) and 1994–199919 (first and second cohorts). Ninety-three participants from the second cohort did not return in 1994–1995, leaving 5795 for the current analysis.
Participants were followed for cardiovascular events using semi-annual contacts to identify interim hospitalisations.20 Discharge summaries from all hospitalisations were obtained, de-identified and stored (>99% success). Additional medical records were obtained for cardiovascular hospitalisations, including echocardiography and procedure reports.
Echocardiography
Methods for the 1989–199918 and 1994–199919 echocardiograms have been described. Grading of AS at the 1989–1990 echocardiograms relied on peak transaortic gradient, with moderate stenosis defined by a peak gradient=40–59 mm Hg (peak velocity=3.16–3.84 m/s) and severe by a peak gradient ≥60 mm Hg (peak velocity ≥3.87 m/s). In the 1994–1995 echocardiograms, grading was based on peak transaortic velocities and semi-quantitative assessment of leaflet opening. Moderate AS was defined as peak velocity=3.0–3.9 m/s or moderately reduced leaflet opening, while severe AS required a peak velocity ≥4.0 m/s or severely reduced leaflet opening.
Case capture
We defined five screening methods to identify participants most likely to have AS during follow-up: procedure screen, diagnosis screen, heart failure screen, echocardiography screen and cause-of-death screen (online supplemental table S1). For participants selected, three investigators performed serial review of all available hospitalisation records through June 2014. Inter-reviewer agreement for clinically significant AS was excellent (kappa=1.0). Onset of AS was defined as the date of earliest clinical recognition. The yield of the screening methods is given in online supplemental file 1.
Supplemental material
Sensitivity analyses explored the extent of AS underdetection by these case-capture methods. Hospital records from selected participants not meeting any of the screening criteria were reviewed. These reviews targeted 50 participants each having the following AS-related features, identified by ICD-9 codes: syncope (780.2), angina (413.9), myocardial infarction (410.xx) and echocardiography (88.72). Of the 200 selected, 6 had two of the above features, leaving 194 participants for sensitivity reviews.
Endpoints
The severity of AS was determined using quantitative parameters from clinical echocardiography or catheterisation. For moderate AS, this included peak transaortic velocity=3.0–3.9 m/s, mean gradient=25–39 mm Hg and estimated aortic valve area (AVA)=1.1–1.5 cm2. For severe AS, corresponding values were peak velocity ≥4.0 m/s, mean gradient ≥40 mm Hg and AVA ≤1.0 cm2. Each case of moderate or severe AS was categorised as ‘definite’ if all 3 quantitative parameters were met, ‘probable’ if 2/3 and ‘possible’ if 1/3 was met. If detected by standardised CHS echocardiograms, AS was classified as ‘probable’. When quantitative data were not available, assessments of AS severity by clinical providers were used instead, and AS categorised as ‘probable’ or ‘possible’ based on clinical information.
The primary endpoint was ‘clinically significant AS’, defined as severe AS (with or without symptoms) or AS-related procedure. Secondary endpoints comprised AS procedures, AS hospitalisations, and moderate or severe AS. We considered probable/definite and possible/probable/definite cases of AS.
Deaths were ascertained by contacts with next-of-kin, medical records and/or death certificates.
Covariates
Self-reported race was categorised as Non-Black (97% White) versus Black; 0.01% were Hispanic. Hypertension was defined as systolic blood pressure ≥140 mm Hg, diastolic ≥90 mm Hg or antihypertensive therapy; diabetes as fasting glucose ≥126 mg/dL, non-fasting glucose ≥200 mg/dL or antihyperglycemic therapy; hypercholesterolemia as LDL ≥128 mg/dL (median) or statin therapy; and chronic kidney disease (CKD) as glomerular filtration rate <60 mL/min/1.73 m2.21 Covariate missingness was 6.5% for income and <5% otherwise.
Statistical analysis
We calculated cumulative frequency of AS endpoints by combining prevalent and incident cases over the entire follow-up period in the numerator and all eligible participants at baseline in the denominator. Given the high competing risk of death, cumulative incidence was calculated by subdistribution survival methods to give estimates of AS-related burden.22 This approach assumes that participants who die remain in the risk set throughout follow-up, even though such individuals can no longer develop the outcome of interest.23 Because this can have a substantial downward influence on event rates over long-term follow-up, we present cumulative incidence at 10, 15 and 20 years. We also determined cumulative incidence using cause-specific methods because these calculate risk in individuals who are alive, allowing better assessment of risk factor associations.22 In addition, we used cause-specific methods to calculate incidence rates for comparison with prior studies, censoring individuals at the earliest date of incident event, death or last follow-up. We computed 95% CIs for frequency and incidence estimates using a quasi-Poisson model. Cumulative frequencies, cumulative incidences and incidence rates were stratified by demographic factors. We additionally stratified cumulative incidences by cardiovascular risk factors. To compare time to event by demographic factors, we fitted Cox models using both subdistribution and cause-specific methods, relying on the latter to evaluate associations. An initial model adjusted for age, sex and race. A subsequent model additionally adjusted for income, education, hypertension, diabetes, smoking, hypercholesterolemia and CKD. Statistical significance was defined by p value <0.05. Analyses were performed in R, V.3.6.3 (Vienna, Austria).
Results
Baseline characteristics and cumulative frequency
Baseline characteristics are presented in table 1. For the analysis of cumulative frequency, there were 14/26 participants with AVR at baseline echocardiography for unknown indication, and another 3 with missing data for AS classification, leaving 5778 eligible participants. Cumulative frequency estimates of probable/definite AS are detailed in table 2. The proportion with any occurrence of clinically significant AS was 3.69%; among severe AS cases, 90.9% were adjudicated using quantitative diagnostic data. For secondary outcomes, the proportions for AS procedures and moderate or severe AS were 1.63% and 6.02%, respectively. Overall, 87.99% of the cohort died during follow-up; numbers were higher for men than women, and non-Blacks than Blacks. Results incorporating possible outcomes are provided in online supplemental table S2. The cumulative frequency for possible/probable/definite clinically significant AS was 4.67% (91% adjudicated with quantitative data), whereas that for moderate or severe AS was 7.04%. Similar sex and race patterns were observed as for probable/definite outcomes.
Clinical characteristics* of the cohort
Cumulative frequency* of probable or definite aortic stenosis overall and by sex and race
Among probable/definite cumulative AS cases, 19 (8.9%) with clinically significant AS and 40 (11.5%) with moderate or severe AS were detected at baseline echocardiography. Of the seven participants (six from the first cohort) with severe AS at baseline echocardiography, presumed asymptomatic, two had a subsequent AS hospitalisation, another two underwent AVR and three died of non-AS causes. Another 2 participants from the first cohort had severe AS, and 33 moderate AS, newly detected at the 1994–1995 echocardiogram. Both participants with severe AS subsequently had an AS hospitalisation.
Cumulative incidence and incidence rates
Median follow-up for clinically significant AS was 13 (maximum 25) years. For this analysis, exclusions consisted of 120 individuals with missing AS information in baseline echocardiograms, 26 with AVR at baseline and 2 with missing files for incident events. This left 5647 participants for analysis of incident AS procedure or hospitalisation. After excluding prevalent cases, there were 5640 and 5620 participants available for analysis of clinically significant AS and moderate or severe AS, respectively.
Cumulative incidence plots of death and probable/definite AS outcomes are shown in figure 1. For each AS outcome, cumulative incidence was substantially lower for the subdistribution than cause-specific method, reflecting the much higher competing risk of mortality.

Cumulative incidence plots of AS events and death. Subdistribution and cause-specific AS refer to the plot for each aortic stenosis outcome calculated by subdistribution survival methods and cause specific survival methods, respectively. AS, aortic stenosis.
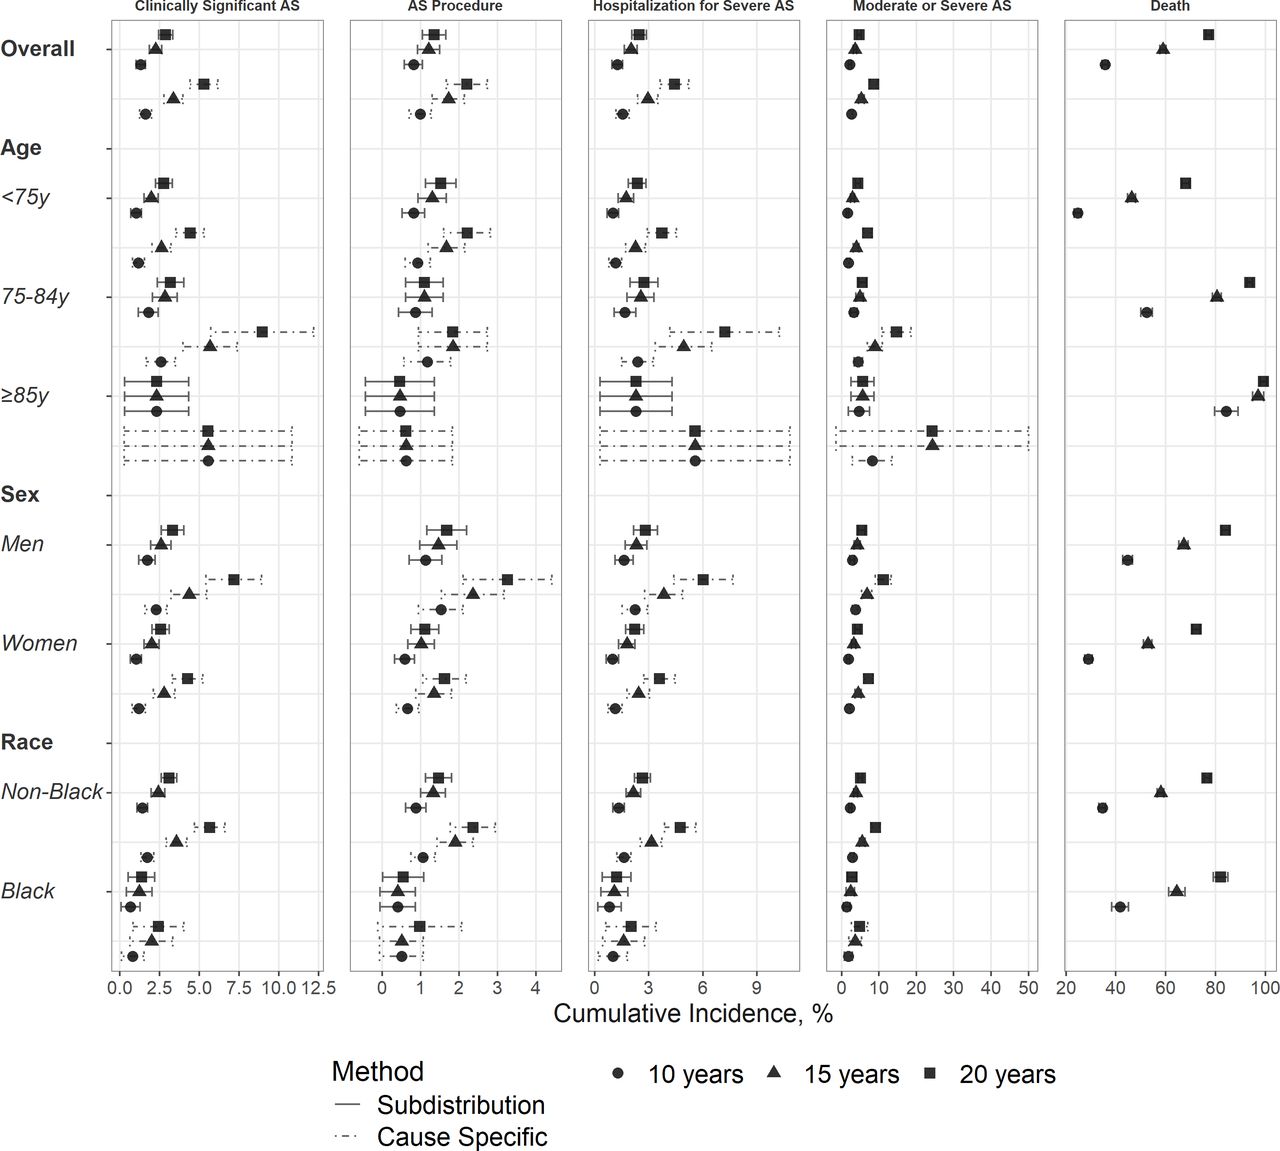
The cumulative-incidence proportions for probable/definite AS events and death at 10, 15 and 20 years of follow-up, both overall and by demographic strata, are given in tables 3 and 4, and figure 2. The focus is on calculating the burden on the entire risk set (subdistribution method) rather than in those alive (cause-specific method), but both are presented to illustrate differences. At 20 years, overall subdistribution cumulative incidence was 2.88% for clinically significant AS and 4.71% for moderate or severe AS. Corresponding proportions for AS procedures and hospitalisations were 1.35% and 2.47%, respectively. Excepting AS procedures, cumulative incidences of AS outcomes across increasing age categories at 20 years were numerically higher in the 75–84 than the <75-year-old group, but not the ≥85-year-old group. By contrast, death increased progressively across age categories. Men showed numerically higher cumulative incidences of AS outcomes than women, as did non-Black than Black participants. For death, men and Blacks showed higher proportions. The corresponding cumulative incidences for possible/probable/definite AS events are provided in online supplemental tables S3 and S4. Overall cumulative incidence of clinically significant AS at 20 years was 3.71%. Demographic patterns were mostly similar to probable/definite AS outcomes.

Cumulative incidence of AS events and death at 10, 15 and 20 years of follow-up. AS, aortic stenosis; y, years.
Cumulative incidence of probable or definite aortic stenosis and death, overall and by age categories
Cumulative incidence of probable or definite aortic stenosis and death by sex and race
As shown in online supplemental tables S5–S7, we explored cumulative incidences of AS outcomes by cardiovascular risk factors. Using subdistribution methods, cumulative-incidence proportions of clinically significant AS at 20 years were numerically higher for participants with hypertension (3.33 vs 2.50%), diabetes (3.35 vs 2.93%) and hypercholesterolemia (3.15 vs 2.58%), but not current/former smoking (2.80 vs 2.99%) and CKD (2.76 vs 2.97%), than their counterparts. Largely comparable patterns were observed for secondary AS outcomes. Findings were broadly similar using cause-specific methods, although proportions were higher, particulary with longer follow-up.
We also calculated cause-specific incidence rates, shown for probable/definite AS outcomes in online supplemental table S8. The overall incidence rate of clinically significant AS was 2.48 per 1000 person-years, and for moderate or severe AS 4.05 per 1000 person-years. Incidence rates showed numerically higher values for men, non-Blacks and increasing age categories. Corresponding incidence rates for possible/probable/definite AS outcomes are provided in online supplemental table S9.
In adjusted comparisons using subdistribution methods, Black race was associated with lower risk of clinically significant AS after accounting for demographic factors (HR 0.40; 95% CI 0.21 to 0.75; p=0.004), but age (HR 0.99; 95% CI 0.97 to 1.02; p=0.36) and male sex (HR 1.24; 95% CI 0.93 to 1.65; p=0.15) were not. Additional adjustment for socioeconomic status and cardiovascular risk factors did not materially change the findings. By contrast, cause-specific methods showed that, in addition to an inverse association for Black race (HR 0.43; 95% CI 0.23 to 0.81; p=0.010), both age (HR 1.08; 95% CI 1.04 to 1.11; p<0.001) and male sex (HR 1.62; 95% CI 1.21 to 2.17; p<0.001) were associated with higher risk of clinically significant AS. These associations were similar after further adjustment.
Sensitivity analysis
Review of a sample of participants at increased risk found just one previously undetected case of clinically significant AS (0.5%).
Discussion
Main findings
In this study, we combined baseline echocardiography with targeted chart-review to identify advanced AS, related procedures and hospitalisations, and determine their respective cumulative frequency and/or incidence. Our case-capture method was highly successful, failing to identify <0.5% of clinically significant AS cases. This ascertainment yielded a cumulative frequency of probable/definite clinically significant AS of 3.69%, increasing to 4.67% when possible cases were included. The corresponding 20-year cumulative incidence of clinically significant AS ranged from 2.88% to 3.71%. After adjustment, the risk of new-onset probable/definite clinically significant AS was 8% higher per year of age, 1.6-fold greater in men than women, and less than half as high in Black as non-Black participants.
Prior studies
To our knowledge, this is the largest population-based study to undertake validation of prevalent and incident AS cases. It is also the first to do so in a racially mixed cohort or over 25-year follow-up, and to account for competing risk of mortality. Most prior studies assessing prevalence of AS have employed one-time echocardiography to estimate cross-sectional proportions of disease. Meanwhile, existing studies of AS incidence have primarily relied on administrative data, which can lead to misclassification.9–11 Only one prior study from Norway combined serial echocardiograms with medical records to arrive at point prevalences and incidence rates, but only aggregate figures for any AS were reported.24
The cumulative frequency of clinically significant AS determined here, 3.69% to 4.67% overall (4.00% to 5.11% in non-Blacks), exceeds prior cross-sectional estimates mostly among people of European descent. A meta-analysis of echocardiographic studies reported a prevalence of severe AS of 3.38% in individuals ≥75 years.25 This contrasts with cross-sectional echocardiographic prevalences ranging from 0.7% for moderate or severe AS in ARIC (mean age 76)26 to 3.8% for severe AS in AGES–Reykjavik, where the breakdown was 0.92% (<70 years), 2.4% (70–79) and 7.3% (≥80).6
Our cumulative frequencies give a more accurate estimate of the true population burden of disease than do cross-sectional estimates. Given that most advanced AS develops in older adults, that our study was open to community-dwelling individuals, and that 88% of the cohort was deceased by follow-up end, these cumulative frequencies may approximate lifetime prevalence of AS.
The present cause-specific incident rates of clinically significant AS are also higher than previously reported in regional or national populations based on administrative data, even though such data tend to capture both moderate and severe AS.9 11 12 Although these ecological comparisons must be interpreted with caution, they do suggest that our case-capture methods achieved more complete AS identification than possible with administrative data alone.
Our assessment of cumulative incidence using subdistribution and cause-specific survival methods highlights the impact of mortality on the corresponding estimates. The subdistribution method gives preferred estimates of AS burden in this older cohort.22 But because this technique keeps deceased individuals in the risk set throughout follow-up, it drives down the risk of AS among groups at high likelihood of mortality.23 Hence, apart from the higher cumulative-incidence proportions generally obtained for the cause-specific compared with subdistribution method, groups susceptible to higher mortality often showed less marked numerical differences in AS incidence than their counterparts in subdistribution than cause-specific estimates. This is illustrated by the clinically significant AS proportions documented for the group <75 versus 75–84 years old or men versus women, including at 10-year follow-up.
In determining risk-factor associations with AS outcomes, cause-specific methods are preferred.22 Our cause-specific, but not subdistribution, Cox regression analyses support previous observations of higher AS incidence with age or male sex.10 11 The present results, both from subdistribution and cause-specific analyses, also show marked race differences in the burden of AS. These are consistent with findings from prior echocardiographic studies, including CHS, noting lower prevalence of AS26 27 or its development19 in Blacks, and from administrative data showing reduced incidence of aortic valve disorders in this racial group.15 Our results newly show that this also applies for adjudicated AS outcomes. The basis for this lower burden of AS is not well defined, but Blacks have been documented to have sharply lower frequency of bicuspid aortic valve and to be less susceptible to vascular calcification.27 Because presence of bicuspid valve was not systematically assessed in CHS echocardiograms, we cannot evaluate its contribution to race or sex differences documented here. Notwithstanding that all CHS participants were Medicare eligible and had standardised semi-annual contacts, it is also possible that lower access to care may have led to underdetection of AS in Black participants. Further research is necessary to determine the true extent of these racial differences in AS susceptibility and their underlying mechanisms.
Implications
Among newly diagnosed clinically significant AS cases in our study, about 85% had a hospitalisation for this condition, yet approximately half of these symptomatic participants did not undergo a procedure. Given that the study period largely predates transcatheter AVR, this reflects recognised barriers or ineligibility for surgical AVR in elders.28
With transcatheter AVR now approved for patients at low surgical risk, our estimates of cumulative frequency may be applied to project the broader need for this resource-intensive procedure.29 The current number of Americans ≥65 of 46 million is forecast to reach ≥98 million by 2060.30 If the cumulative frequency ranges from 3.69% to 4.67%, and 75% are symptomatic,25 this means that currently ~1.3 to 1.6 million Americans would merit consideration for AVR. By 2060, these figures will increase to 2.7 to 3.4 million.
Limitations
The burden of AS documented in this sample may have been reduced by decreased study participation of people with prevalent disease, particularly those not living independently. Although determination of AS at study baseline or, for the first cohort, the early follow-up period, made use of standardised echocardiograms, identification of incident AS from hospital records depended on participants coming to medical evaluation. Our study would therefore fail to capture participants with asymptomatic AS or no access to care. Yet the Medicare eligibility of this population and its high rate of hospitalisations, together with the fact that over long-term follow-up severe AS frequently becomes symptomatic, would limit such instances. Similarly, a proportion of cases of advanced AS may have been missed or not fully classified because of deaths or serious comorbidities. Last, the present estimates derived from chart review were based on available information. Incomplete information, including lack of quantitative measures or their discordance, may have led to misclassification. On balance, however, the frequencies given here are likely underestimates of true AS burden.
Conclusions
In this cohort, application of case-capture methods over 25 years yielded higher cumultative frequency and incidence of clinically significant AS than reported elsewhere. Although Black participants showed less than half the risk as non-Black participants, these differences merit caution because of potential underdetection in the former group. The improved overall estimates of disease burden indicate, however, that the scope of interventional procedures required is more substantial than previously appreciated.
Key messages
What is already known on this subject?
Aortic stenosis has been documented to be common in older adults, but available prevalence and incidence estimates mainly come from cross-sectional echocardiographic surveys and longitudinal administrative data, predominantly among people of European descent.
What might this study add?
This is the first population-based study to apply case-capture methods to adjudicate cases of aortic stenosis over long-term follow-up, and to use both subdistribution and cause-specific survival methods to assess cumulative burden of aortic stenosis and associations for risk factors, including among African Americans. Accordingly, the present study identifies a higher burden of clinically significant aortic stenosis than previously reported, with Black individuals having less than half the incidence of non-Black individuals.
How might this impact on clinical practice?
These findings have important implications for public health resource planning since symptomatic severe aortic stenosis is at present only treatable with expensive surgical or transcatheter aortic valve replacement procedures. Although Black and non-Black participants in our study received regular contacts throughout the follow-up period, the lower estimated burden of aortic stenosis in Blacks requires additional investigation given the possible influence of differential access to care.
Data availability statement
Data are available from the authors on reasonable request.
Ethics statements
Ethics approval
This study complied with the Declaration of Helsinki. All participants provided written informed consent. CHS was approved by the Institutional Review Boards of the Coordinating Center (University of Washington) and field centres (University of Pittsburgh, Johns Hopkins University, Wake Forest University and UC Davis).
Acknowledgments
The authors wish to thank Mahim Naveed, MS, for her assistance with creating the figures.
References
Supplementary materials
Supplementary Data
This web only file has been produced by the BMJ Publishing Group from an electronic file supplied by the author(s) and has not been edited for content.
Footnotes
Twitter @danmassera
Contributors Planning for this research was conducted by DSO, BMP, JSG and JRK. The project was conducted by DSO, TMB, PB, DM, MLB, SDC, NS, BMP, JSG and JRK. All authors were involved in reporting the work. JRK serves as guarantor. The corresponding author has the right to grant on behalf of all authors and does grant on behalf of all authors, an exclusive license (or non-exclusive for government employees) on a worldwide basis to the BMJ Publishing Group Ltd and its Licensees to permit this article (if accepted) to be published in HEART editions and any other BMJPGL products to exploit all subsidiary rights.
Funding This research was supported by contracts HHSN268201200036C, HHSN268200800007C, HHSN268201800001C, N01HC55222, N01HC85079, N01HC85080, N01HC85081, N01HC85082, N01HC85083, N01HC85086, 75N92021D00006, and grants U01HL080295 and U01HL130114 from the National Heart, Lung, and Blood Institute (NHLBI), with additional contribution from the National Institute of Neurological Disorders and Stroke (NINDS). Additional support was provided by R01AG023629 from the National Institute on Aging. DSO was supported by a Mentored Clinical and Population Research Award from the American Heart Association’s Western States Affiliate. DM was supported by the Glorney-Raisbeck Fellowship Program, Corlette Glorney Foundation and the New York Academy of Medicine. JRK was supported by K24 HL135413 from the National Heart, Lung, and Blood Institute. A full list of principal CHS investigators and institutions can be found online (CHS-NHLBI.org).
Competing interests JRK discloses stock ownership in Abbott, Bristol-Myers Squibb, Johnson & Johnson, Medtronic, Merck and Pfizer.
Provenance and peer review Not commissioned; externally peer reviewed.
Supplemental material This content has been supplied by the author(s). It has not been vetted by BMJ Publishing Group Limited (BMJ) and may not have been peer-reviewed. Any opinions or recommendations discussed are solely those of the author(s) and are not endorsed by BMJ. BMJ disclaims all liability and responsibility arising from any reliance placed on the content. Where the content includes any translated material, BMJ does not warrant the accuracy and reliability of the translations (including but not limited to local regulations, clinical guidelines, terminology, drug names and drug dosages), and is not responsible for any error and/or omissions arising from translation and adaptation or otherwise.