Article Text

Abstract
Objective Biochemical and cytological pericardial fluid (PF) analysis is essentially based on the knowledge of pleural fluid composition. The aim of the present study is to identify reference intervals (RIs) for PF according to state-of-art methodological standards.
Methods We prospectively collected and analysed the PF and venous blood of consecutive subjects undergoing elective open-heart surgery from July 2017 to October 2018. Exclusion criteria for study enrolment were evidence of pericardial diseases at preoperatory workup or at intraoperatory assessment, or any other condition that could affect PF analysis.
Results The final study sample included 120 patients (median age 69 years, 83 men, 69.1%). The main findings were (1) High levels of proteins, albumin and lactate dehydrogenase (LDH), but not of glucose and cholesterol (2) High cellularity, mainly represented by mesothelial cells. RIs for pericardial biochemistry were: protein content 1.7–4.6 g/dL PF/serum protein ratio 0.29–0.83, albumin 1.19–3.06 g/dL, pericardium-to-serum albumin gradient 0.18–2.37 g/dL, LDH 141–2613 U/L, PF/serum LDH ratio 0.40–2.99, glucose 80–134 mg/dL, total cholesterol 12–69 mg/dL, PF/serum cholesterol ratio 0.07–0.51. RIs for pericardial cells by optic microscopy were: 278–5608 × 106 nucleated cells/L, 40–3790 × 106 mesothelial cells/L, 35–2210 × 106 leucocytes/L, 19–1634 × 106 lymphocytes/L.
Conclusions PF is rich in nucleated cells, protein, albumin, LDH, at levels consistent with inflammatory exudates in other biological fluids. Physicians should stop to interpret PF as exudate or transudate according to tools not validated for this setting.
- pericardial effusion
Data availability statement
Data are available upon reasonable request.
Statistics from Altmetric.com
Introduction
Biochemical and cytological analysis of pericardial fluid (PF) is essentially based on the knowledge of pleural fluid composition with limited original data on reference values for normal PF1–10 that should be the basis for clinical evaluation of pericardial diseases.
Typical assessment includes cellular and biochemical analysis with quantification of total protein, albumin, lactate dehydrogenase (LDH), glucose and total cholesterol.11 12 To date, results of PF analysis are interpreted according to the Light’s criteria,13 which have been developed to distinguish between transudates and exudates, especially in pleural fluid. Accordingly, an inflammatory exudate is diagnosed when at least one of the following criteria is satisfied: fluid/serum protein ratio >0.5, fluid/serum LDH ratio >0.6, and fluid LDH >2/3 of the upper limit for serum levels.11 13 14 However, the main limitation of the Light’s criteria is that they have been developed for pleural fluids and never validated for PF.
The aim of this study is to define the reference values of normal PF in accordance with state-of-the-art methodological standards.15
Methods
Study population
Current Clinical and Laboratory Standards Institute (CLSI) guidelines recommend a minimum of 120 subjects to obtain laboratory reference intervals (RIs) with 90% CI.15 Accordingly, we prospectively collected the PF and venous blood of subjects undergoing elective open-heart surgery at Papa Giovanni XXIII Hospital (Bergamo, Italy) from July 2017 to October 2018. The study was performed in accordance with the Helsinki declaration. All participants gave written informed consent.
All patients underwent routine preoperatory workup including full blood count and differential, routine blood biochemistry, chest radiography, echocardiography and coronary angiography prior to the surgery. Exclusion criteria for study enrolment were evidence of pericardial disease at preoperatory workup or at intraoperatory assessment, active acute or chronic inflammatory or infective conditions, heart failure at the time of surgery, liver cirrhosis or chronic liver failure of any severity, moderate-to-severe kidney failure (glomerular filtration rate <60 mL/min), active cancer in the previous 2 years, baseline transaminases elevation (>1.5 times the upper reference limit), myopathy or elevated baseline preoperative creatine kinase, any haematological or gastrointestinal disease, pregnant and lactating women, plasma protein levels <4.0 g/dL, emergency and urgent surgery, patients with diabetes treated with oral or injected medications (patients with diabetes were excluded to obtain the best proxy as possible of ‘normal’ PF). Samples with evidence of haemolysis were discarded.
PF analysis
PF was obtained as soon as the pericardial sac was opened after sternotomy. To minimise traumatic bleeding into the pericardial space an electric scalpel was used. Then two samples of pericardial liquid (2 mL each) were obtained by the cardiac surgeon using a syringe. The PF was transferred in two tubes: one containing K3-EDTA (for cell examination) and one with serum gel separator for biochemical analyses (Becton Dickinson, Franklin Lakes, New Jersey, USA). All samples collected in K3-EDTA tubes were gently mixed immediately after collection. At the same time as PF, peripheral blood was collected from a central venous line; the samples were immediately sent to the laboratory for analysis.
Within 2 hours from sampling the samples collected in K3-EDTA tubes were simultaneously assessed by optical microscopy and with an automated cell counter—the haematological analyser XN-20 (Sysmex, Kobe, Japan) equipped with a module specifically designed for cell analysis of body fluids.
Optical microscopy
Optical microscopy was carried out according to CLSI guidelines.11 Briefly, total cells count was performed using the Nageotte counting chamber. For differential cells count, PF samples were centrifuged at 100 × g for 5 min (Cytospin2, Thermo Scientific, Massachusetts, USA) and stained with May-Grunwald-Giemsa reagent (Carlo Erba Reagents, Italy). The slide review was carried out by two skilled operators as previously described.16 The morphological differentiation with optical microscopy allowed cell classification in one of the following groups: neutrophils, lymphocytes, monocytes, eosinophils, basophils, macrophages, mesothelial cells and other cells (also including ‘neoplastic cells’). Mononucleated cells were obtained by summing lymphocytes, monocytes, macrophages, mesothelial cells and other cells.
Automated cell counts
The Sysmex XN-20 body fluids module generates the following classification, evaluating size and complexity of cells and their intensity of fluorescence: total cells, leucocytes, polymorphonuclear cells, mononuclear cells and high fluorescence cells. The evaluation of total mononuclear cells obtained summing mononuclear cells and high fluorescence cells according to Buoro et al was also introduced.16 Using the XN-20 body fluids module, the number of cells classified as high fluorescence cells is significantly correlated with the presence of mesothelial and/or neoplastic cells.16 17
Biochemical analyses
Within 15–30 min from sampling, the aliquots for biochemical tests were centrifuged at 1200 × g for 10 min at room temperature. They were analysed within 2 hours from collection on ADVIA 2400 (Siemens Healthineers, Milan Italy) using Siemens reagents. Five tests were performed: total protein, albumin, LDH, glucose and total cholesterol.
Statistical analysis
Statistical analysis has been performed with Analyse-it software V.3.90.5 for Microsoft Excel (Analyse-it Software; Leeds, UK). Normality was assessed by the Shapiro-Wilk test and by the assessment of the distribution of frequencies of values: all PF variables had a non-normal distribution and were shown as median values and range (for PF variables) or IQR (for other variables). Dixon’s criterion was used to detect outliers,18 which were excluded from subsequent analysis. RIs were identified by the standard non-parametrical approach according to CLSI EP28 A3c15 for parameters with at least 118 valid measures. Briefly, RIs include 95% of the values (from the 2.5th to the 97.5th centiles), identified with 90% CI.
Missing data
For the majority of parameters (biochemical parameters and automated cell count) missing data are the outliers. For optical microscopy, due to technical reasons, it was not possible to perform microscopic examination of some PF, and for ratios and gradients serum samples were not available for all the patients. For these parameters with a lower number of values, RIs were identified by the robust method of Horn and Pesce, and the 90% CI was calculated with the bootstrap method (statistical technique uses random sampling with replacement repeated thousands of times).19
Patient and public involvement
This article was written without patient involvement. Patients were not invited to comment on the study design and were not consulted to develop patient-relevant outcomes or to interpret the results. Patients were not invited to contribute to the writing or editing of this document for readability or accuracy.
Results
Study population
We prospectively collected the PF and venous blood of 160 consecutive adult patients (median age 67 years, 109 men, 68.1%) undergoing elective open-heart surgery due to coronary disease, valvular disease, ascending aorta aneurysm and hypertrophic cardiomyopathy. Thirty-eight patients did not fulfil all inclusion criteria (10 subjects have concomitant pericardial disease, 10 were on antidiabetic medications, 2 had renal failure and 16 had serum total protein <4.0 g/dL). Two further eligible subjects were discarded due to suspicion of blood contamination and haemolysis of the sample (figure 1).

Study flow chart (eligible, excluded and included patients).
The final study sample included 120 patients (median age 69 years, 83 men, 69.1%), which is in line with the requirements of CLSI guidelines.15 Descriptive statistics of the enrolled cohort are summarised in table 1.
Descriptive statistics of the 120 valid subjects enrolled in the study
PF analysis
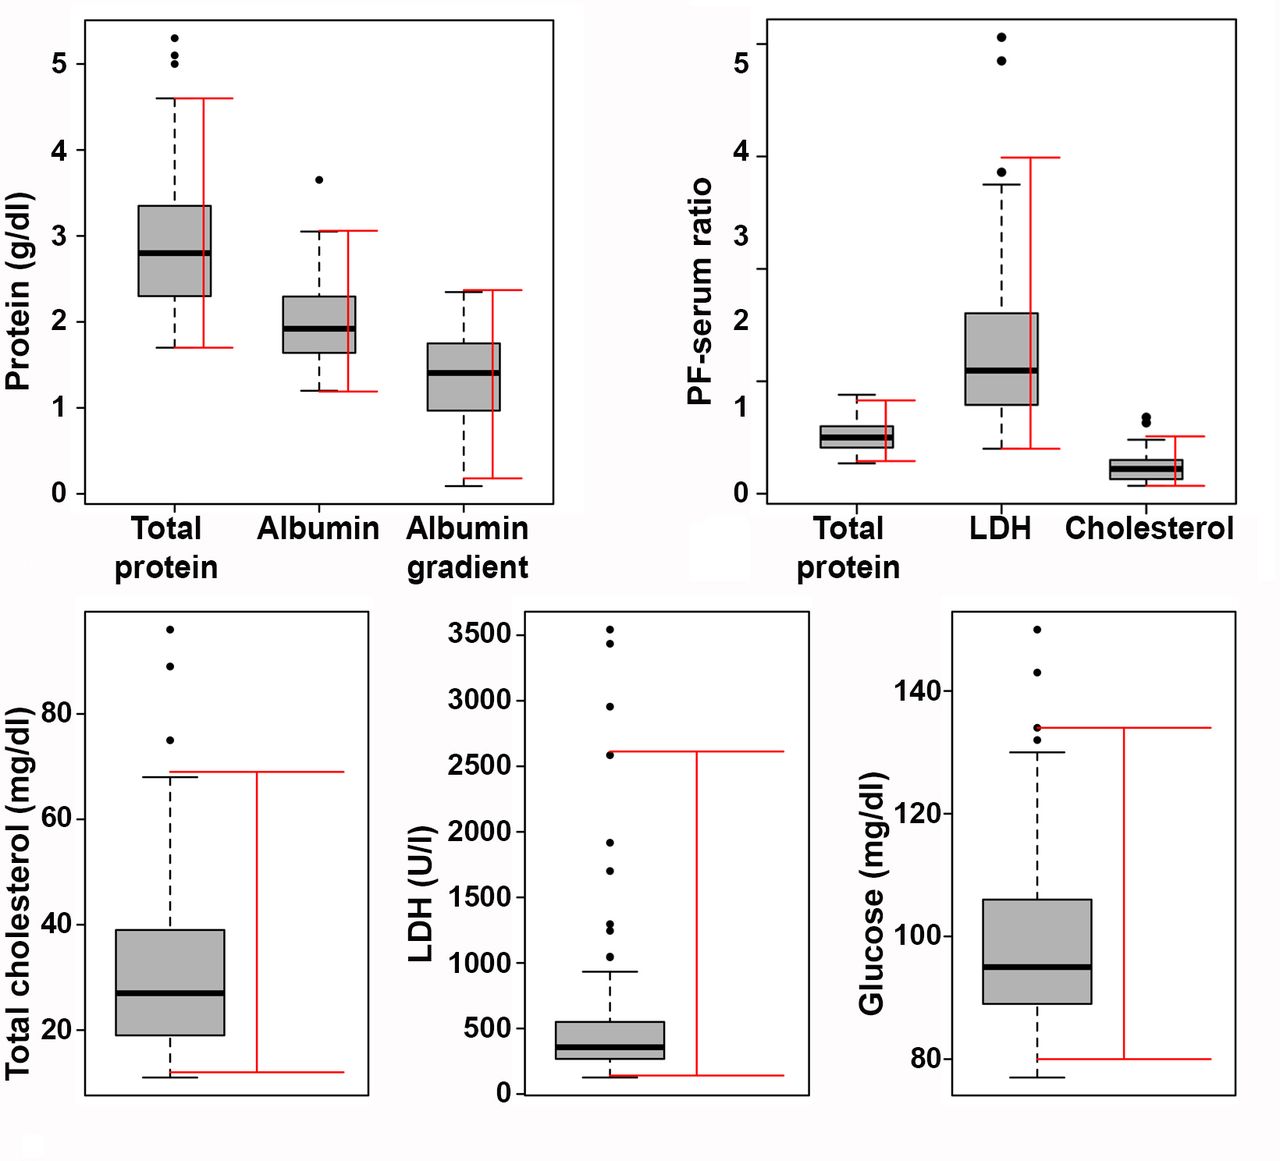
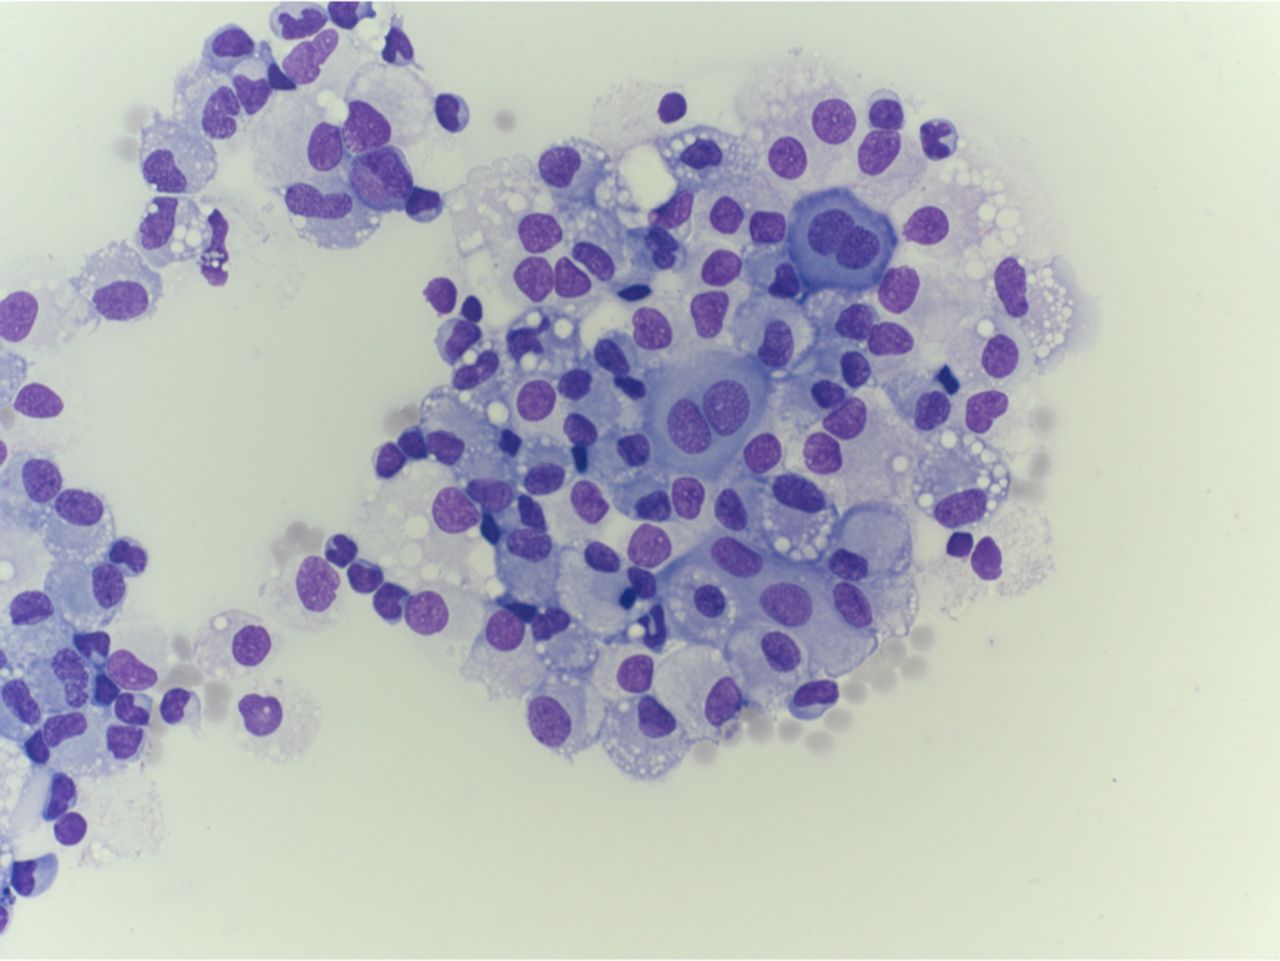
The analysis of PF revealed a non-normal distribution of all cellular and biochemical components studied. Table 2 shows the results of PF cellular and biochemical analysis by current reference techniques (ie, optical microscopy for cellular analysis); the key elements are condensed in figures 2 and 3. For all the variables analysed, the outliers identified by the Dixon’s criterion18 represented a strict minority of the sample, accounting for zero to seven subjects, thus allowing a robust identification of RIs. Median PF nucleated cells were 1977 (range 37–8453) × 106/L. Differential cell count by optical microscopy identified mononucleated cells as the most abundant population in the PF (median 1919, range 25–8115 × 106/L), mainly represented by mesothelial cells (median 1283, range 0–5579 × 106/L). These cells often appeared aggregated in groups, with bizarre shapes (figure 4).16 Leucocytes account only for a fraction of PF cells (median 503, range 22–4812 × 106/L), mainly represented by lymphocytes (median 304, range 8–2374 × 106/L). Biochemistry of the PF revealed a median protein content of 2.8 (range 1.7–5.3) g/L, albumin content of 1.92 (range 1.20–3.65) g/L, LDH values of 357 (range 126–3543) U/L, glucose levels of 95 (range 77–150) g/dL and total cholesterol levels of 27 (range 11–96) mg/dL. The median PF/serum ratio was 0.50 (range 0.27–0.88) for total protein and 1.1 (range 0.21–4.07) for LDH.

Box plot graphs for cellular analysis by optical microscopy in pericardial fluids in 120 subjects undergoing elective open-heart surgery. Reference intervals are shown as red bars.

Box plot graphs for total protein, albumin, albumin gradient (serum albumin-PF albumin), total cholesterol, lactate dehydrogenase (LDH) and glucose in pericardial fluids (PFs) in 120 subjects undergoing elective open-heart surgery. PF value/serum value ratio is also shown for total protein, LDH and cholesterol. Reference intervals are shown as red bars.

Morphological characteristics of cells in normal pericardial fluid by optical microscopy (400 × magnification) on cytospin stained with May-Grunwald-Giemsa reagent. Differential count shows neutrophils 4.5%, lymphocytes 45.5%, monocytes 7%, macrophages 1%, mesothelial cells 42%. Mesothelial cells are abundant and grouped together in aggregates.
Results of biochemical and cellular analysis of pericardial fluid by optical microscopy with estimated reference intervals
RIs were estimated with 90% CI according to a non-parametrical15 or parametrical19 method, as appropriate. Specifically, RIs for PF cells were 278–5608 × 10 total nucleated cells/L, 199–5219 × 106 mononucleated cells/L, 40–3790 × 106 mesothelial cells/L, 35–2210 × 106 leucocytes/L, 19–1634 × 106 lymphocytes/L, 0–426 × 106 monocytes/L, 0–118 × 106 polymorphonucleated cells/L and 0–214 × 106 macrophages/L. RIs for biochemistry were 1.7–4.6 g/L for total protein (with a PF/serum protein ratio of 0.29–0.83); 1.19–3.06 g/L for albumin (with a serum-PF albumin gradient of 0.18–0.2.37 g/L); 141–2613 U/L for LDH (with a PF/serum LDH ratio of 0.40–2.99); 80–134 mg/dL for glucose and 12–69 mg/dL for total cholesterol (with a PF/serum cholesterol ratio of 0.07–0.51).
Cell analysis was also performed by automated cell counting, in parallel to optical microscopy (table 3), that represents the first-line technique for PF cell assessment in the majority of laboratories. As previously observed, we found that automated cell counting yielded similar total nucleated cell counts to that obtained by optical microscopy, but dissimilar cellular discrimination. Aiming to identify potential red flags at automated cell counting that might suggest a second-line assessment with optical microscopy, RIs were obtained for PF cell analysis by automated counting. Specifically, RIs for automated cell counting of PF were 216–4577 × 106 total nucleated cells/L, 162–4131 × 106 leucocytes/L, 120–3787 × 106 mononucleated cells/L, 4–412 × 106 polymorphonucleated cells/L and 4–1528 × 106 high fluorescence cells; in the context of normal PF, the number of high fluorescence cells significantly correlates with the presence of mesothelial cells.16 17
Results of pericardial fluid cellular analysis by automated cell counting with estimated reference intervals
By applying the traditional Light’s criteria, 111/120 (92.5%) subjects in our study would have been misclassified as exudates.
Discussion
This study reports for the first time reference values of normal PF according to standardised criteria and guidelines.11 15 In the last decade, multiple evidence has suggested that PF has a unique composition,8–10 highlighting the need to develop specific interpretation tools for PF analysis.
The main finding of this study is that PF is rich of nucleated cells, protein, albumin and LDH at levels consistent with inflammatory exudates in other biological fluids. On this basis, physicians should be cautious to interpret PF as exudate or transudate according to tools not validated for this setting.
As compared with pleural or peritoneal fluids, PFs are characterised by an elevated level of proteins and albumin, very high LDH and number of nucleated cells. The RIs of total protein PF/serum ratio were 0.29–0.83, while those of LDH PF/serum ratio were 0.40–2.99, in line with the median values recently observed in a cohort of 50 subjects by Imazio et al in Torino.10 As comparison, Light’s criteria for inflammatory pleural fluid use 0.5 and 0.6 as cut-off values for protein fluid/serum ratio and for LDH fluid/serum ratio, respectively, resulting in frequent misclassification of non-inflammatory PF. The mechanisms underlying high levels of PF protein and LDH remain to be elucidated. An increased permeability of the pericardial vasculature as compared with other serosal tissues can be hypothesised and might be related to the mechanical stress on the pericardium due to the high-speed movement of the heart. However, increased permeability is not sufficient to explain higher LDH levels in the PF than in the blood. LDH is a ubiquitous enzyme, present in all cell types including mesothelial cells. It could be speculated that LDH might be released by these cells, that are abundant in the PF. Alternatively, the lining mesothelial cells exposed to mechanical stress might be an important source of PF LDH. Interestingly, the blood-PF barrier appears to be selective and scarcely permeable to lipoproteins, as we observed only small amounts of cholesterol in PF (RIs 12–69 mg/dL), which is similar to that expected in the pleural fluid and in line with the findings of Imazio et al.10 The same group also observed scant triglycerides in the PF, further suggesting that blood lipoproteins do not have easy access to the PF.
Another specificity of PF is the abundance of cells (RI 278–5608 × 106 cells/L), in particular mesothelial cells. We found that mesothelial cells represent the most abundant population in the PF (RI: 40–3790 × 106 cells/L), and are often grouped together into bizarre aggregates (figure 4). The specific cellular composition of PF with abundant mesothelial cells is likely to contribute to the inaccuracy of automated cell counting in discriminating PF cells. For this reason, optical microscopy after cytospin is the technique of choice when reliable cell PF discrimination is required.16 A practical approach is to use automated cell counting as the first-line technique for PF cell analysis, leaving optical microscopy to specific clinical queries or abnormal findings at automated assessment. Accordingly, we have identified RIs for cell analysis performed by both automated cell counting (Sysmex XN-20 body fluid module) and optical microscopy. Thus, on the one hand the RIs for the automated cell counting allow to identify red flags to implement optical microscopy, while RIs for optical microscopy might help to identify an increase in a specific cellular population. However, this does not imply that optical microscopy should be performed only on PF samples whose automated differential cell counts fall outside the RIs identified in this study. Rather, we encourage the use of optical microscopy whenever an accurate differential cell count is required.
The majority of PF is acquired by pericardiocentesis, which often contains red blood cells. Also open surgical extraction may result in contamination of red cells, and actually we excluded two samples due to suspicion of blood contamination and haemolysis. Pericardiocentesis or surgical extraction are technically different, but no data exist comparing the two techniques; overall we think that PF samples obtained with the two techniques are comparable.
Future studies should address the composition of PF in conditions with active inflammation, such as acute pericarditis or pericardial tumours. It is expected that total protein, albumin and LDH might be higher than those observed in the present study, allowing to identify discriminative parameters between non-inflammatory (ie, transudates) and inflammatory (exudates) PFs. Although the composition of PF in pericardial diseases is out of the aim of the present paper, figure 5 depicts the median values of protein and LDH in PF, PF/serum protein ratio and PF/serum LDH ratio in the population we studied and for comparison in 10 consecutive patients with acute inflammatory pericarditis (retrieved from your hospital records) who underwent pericardiocentesis for cardiac tamponade and from an equal number of subjects treated with pericardiocentesis for chronic idiopathic CRP-negative (non-inflammatory) pericardial effusion: total protein seems similarly higher in either patients with pericarditis or non-inflammatory pericardial effusions as compared with our 120 subjects undergoing heart surgery, while LDH is strikingly elevated in patients with pericarditis.

Median values of total protein and lactate dehydrogenase (LDH) in pericardial fluid (PF), PF/serum protein ratio and PF/serum LDH ratio in the sample we studied (120 subjects undergoing elective open-heart surgery) and for comparison in 10 consecutive patients with acute inflammatory pericarditis who underwent pericardiocentesis for cardiac tamponade and from an equal number of subjects treated with pericardiocentesis for chronic idiopathic CRP-negative, non-inflammatory pericardial effusion.
Study limitations
The enrolled cohort has a median age of 69 years and was composed of patients undergoing cardiac surgery, which cannot be considered ‘healthy’ in absolute terms. However, it is ethically not acceptable to obtain PF from healthy individuals. To obtain the best proxy as possible of ‘normal’ PF, we selected only subjects that are expected to have non-inflammatory PF in the absence of associated conditions that might affect PF composition, including pericardial diseases, decompensated heart failure and relevant inflammatory or metabolic comorbidities. To limit the interference due to the concomitant surgical procedure, the PF was obtained as soon as the pericardial sac was opened after sternotomy and subjects whose PF was contaminated by blood on specimen collection were excluded from the study.
Conclusions
PF has a unique composition characterised by high number of nucleated cells, predominantly mesothelial cells, elevated total protein, albumin and very high LDH. PF-specific RIs for cellular and biochemical analyses are identified and made available for physician’s decision-making. Tools not specifically validated for this setting should not be used for interpreting PF analysis.
Key messages
What is already known on this subject?
Limited preliminary data suggest that pericardial fluid (PF) composition may differ from that reported for pleural fluid making questionable the application of Light’s criteria for differential diagnosis of pericardial exudates and transudates.
What might this study add?
At present, no studies have systematically evaluated reference values for normal PF according to standardised criteria and guidelines. This study reports reference intervals for biochemical and cytological study of PF to be implemented in clinical practice, for the first time.
How might this impact on clinical practice?
This study will allow the implementation of specific reference values for PF analysis in clinical practice.
Supplemental material
Data availability statement
Data are available upon reasonable request.
Ethics statements
Patient consent for publication
References
Supplementary materials
Supplementary Data
This web only file has been produced by the BMJ Publishing Group from an electronic file supplied by the author(s) and has not been edited for content.
Footnotes
Twitter @ImazioMassimo
SB, ET and FC contributed equally.
Contributors Study design, enrolment and data collection: SB, FC, CS, DC, MS, FI, SM, MdCBV, VM, GP, BM. Data management and statistical analysis: SB, AB, FC, ET. Manuscript draft, analysis of data and supervision: YA, MI, AB, SB, FC, ET. Manuscript revision and approval: all authors.
Funding The authors have not declared a specific grant for this research from any funding agency in the public, commercial or not-for-profit sectors.
Competing interests None declared.
Provenance and peer review Not commissioned; externally peer reviewed.
Supplemental material This content has been supplied by the author(s). It has not been vetted by BMJ Publishing Group Limited (BMJ) and may not have been peer-reviewed. Any opinions or recommendations discussed are solely those of the author(s) and are not endorsed by BMJ. BMJ disclaims all liability and responsibility arising from any reliance placed on the content. Where the content includes any translated material, BMJ does not warrant the accuracy and reliability of the translations (including but not limited to local regulations, clinical guidelines, terminology, drug names and drug dosages), and is not responsible for any error and/or omissions arising from translation and adaptation or otherwise.