Article Text

Abstract
Objective To construct an adjusted nomogram for the echocardiographic screening of aortic root diameter in children with possible Marfan disease.
Design In 91 children (42 boys, 49 girls, age range 3.2 to 18.4 years) undergoing Marfan screening from 1983 until 1996, the diagnosis Marfan syndrome and any other aortic pathology was definitely ruled out. These served as a control population to set appropriate reference standards.
Results Compared with a standard Dutch reference population, body surface area of the control subjects (mean (SD)) was above the 50th centile (boys 0.09 (0.20) m2, range −0.28 to 0.69 m2; girls 0.09 (0.17) m2, range −0.17 to 0.69 m2). Echocardiographically determined aortic root diameter and body surface area showed a linear relation and a greater variability of aortic root diameter in these relatively tall subjects (n = 91,R 2 = 0.62) than in the standard nomogram (n = 56, R 2 = 0.93). In 24% of cases (n = 22), the aortic root exceeded the upper limit of normal in the standard nomogram, by 2.2 (2.0) mm. An adjusted nomogram was constructed with a higher upper limit.
Conclusions A Marfan screening population differs from the unselected population in body surface area and aortic root size variability. An adjusted nomogram should therefore be used to detect a truly enlarged aortic root.
- Marfan syndrome
- aorta
- nomogram
- children
Statistics from Altmetric.com
Marfan syndrome is an autosomal dominant connective tissue disorder, associated with mutations in the fibrillin I gene,1 in which ocular, skeletal, cardiovascular, integumentary, pulmonary, and neurological features may be present.2 ,3 The prevalence has been estimated to be 1 in 3–5000,4 15–30% of whom are new mutations.3 ,5 ,6
Until recently, the diagnosis was based on fulfilment of diagnostic criteria established in Berlin in 1986.5 In 1995, these criteria were revised in Gent.7 The criteria are still based on a combination of major and minor clinical manifestations in different organ systems and on family history. The manifestations vary in onset and in severity, and show a variable rate, particularly in children.2 ,3 ,8 Usually signs are not clearly present at birth but develop during childhood and adolescence. Therefore, diagnosis of Marfan syndrome in children is often difficult and long term follow up examinations are necessary before a definite diagnosis can be made.8
Because aortic root dilatation is one of the major criteria for the diagnosis of Marfan syndrome, screening and follow up of the cardiovascular system relies on accurate measurement of aortic root size. M mode and cross sectional echocardiographic dimensions are related to height,9 ,10 weight,10 ,11 and body surface area.12-18 At present, body surface area is considered to be the most important independent determinant of aortic root diameter.14 ,16-22 Roman et al 14 proposed a nomogram based on cross sectional echocardiographic aortic root diameters of children and adults in the normal population. However, a remarkably large number of subjects in whom Marfan syndrome or any other aortic disease was definitely ruled out after screening by a multidisciplinary team in our institution showed aortic root diameters exceeding the upper limit of this standard nomogram with M mode echocardiography. Subjects referred for screening for Marfan syndrome are not usually entirely comparable in body size with gender and age matched subjects from the unselected population. Usually these children are taller and thinner, and have a relatively larger body surface area. There is, however, a possibility that systematic differences between M mode and cross sectional echocardiography are responsible for the deviation from the standard nomogram. Therefore a comparison between the two methods was made in Marfan patients and controls, in whom both M mode and cross sectional echocardiographic aortic root measurements were performed simultaneously.
The aim of our study was to develop a nomogram adjusted to the actual control population to screen children and adolescents for Marfan disease.
Methods
From 1983 until 1996, 250 children had been referred to the multidisciplinary Marfan team of the Academic Medical Centre of Amsterdam. Indications for screening included family history, excessive height, chest or spine anomalies, hypermobile joints, and lens subluxation.5 None of these subjects was referred for aortic root enlargement. The diagnosis of Marfan syndrome was made according to the Berlin criteria.5
Of the 250 children, 69 had a definite diagnosis of Marfan syndrome, while in a further 79 the diagnosis remained uncertain despite follow up; in the remaining 102 children the diagnosis could definitely be ruled out. From among these 102 subjects, 91 complete echocardiographic and anthropometric datasets from 42 boys and 49 girls without any aortic pathology were evaluable (table 1). Body surface area was calculated from the formula:
Population characteristics
log(BSA) = log(W) • 0.425 + log(H) • 0.7 25 + 1.8564
where BSA is body surface area in cm2 ,W is weight in kg, and H is height in cm.23 It was correlated with age and subsequently compared with body surface area growth curves of the Dutch population in the years 1989 to 1992.24
Echocardiographic measurements of the aortic root diameter were made by M mode echocardiography at the level of the sinuses of Valsalva, according to the recommendations of the American Society of Echocardiography (ASE)25 and guided by cross sectional echocardiography. Only the most recent measurement of aortic root diameter per subject was used.
Body surface area and aortic root diameter were correlated by linear regression analysis. The 95% prediction intervals were calculated as:
yc ± (2 • SD • R) + SQRT[1 + 1/91 + (BSA − BSAm)2 /Σ (BSA − BSAm)2],
in which yc is aortic root diameter predicted from the linear regression, SD is standard deviation of aortic root diameters, R is square root from the correlation’s least squares fit, BSA is body surface area, and BSAm is mean BSA.
For comparison of the M mode and cross sectional echocardiographic measurements of the aortic root, Bland-Altman analysis26was applied to 56 Marfan patients and 58 control subjects. In these subjects cross sectional and M mode echocardiographic measurements were made during the same imaging procedure. One randomly chosen aortic root diameter per subject measured by both modes was used for this analysis. The characteristics in range and mean (SD) of the patients and control subjects are shown in table 2.
Population characteristics for Bland-Altman analysis
STATISTICAL ANALYSIS
All data are represented as mean (SD) and range, unless otherwise reported. Linear regression analysis was performed on all growth curves. Differences between body surface area growth curves were calculated from the linear regression lines. The 95% prediction intervals for the aortic root nomogram were calculated according to standard statistical methods for linear regression analysis.27 Bland–Altman analysis26 was used in the comparison between M mode and cross sectional echocardiography. Differences of mean values were compared with the Student unpairedt test. p < 0.05 was considered significant.
Results
GROWTH
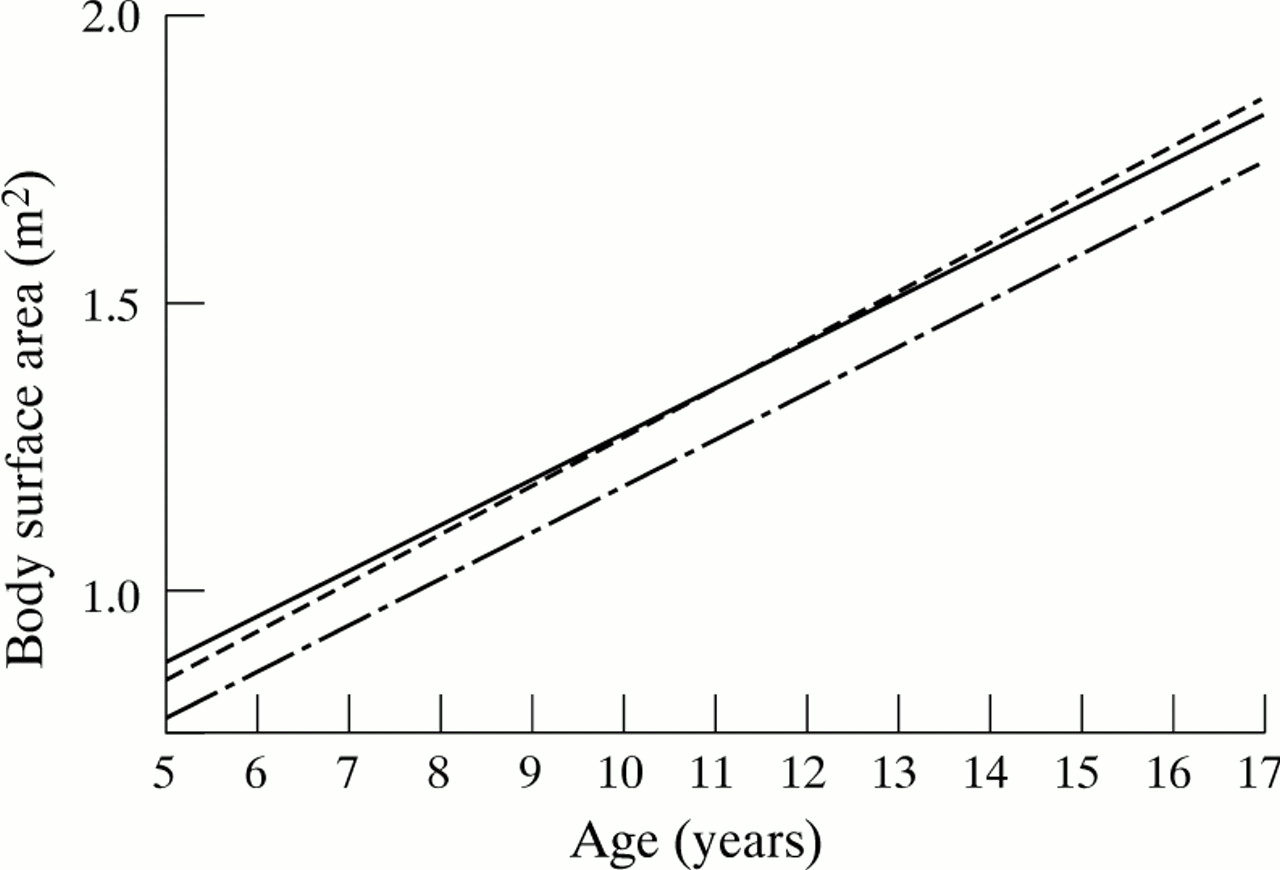
There were strong linear correlations between age and body surface area in this age group (boys: y = 0.09x + 0.35,R 2 = 0.80; girls: y = 0.08x + 0.48,R 2 = 0.69). The regression line roughly followed the 75th growth centile of a standard Dutch population (boys: y = 0.09x + 0.39; girls: y = 0.08x + 0.41) both for boys (fig1) and for girls (fig 2).24 (Fig 2) Mean differences between the 50th centile were 0.09 (0.20) (range −0.28 to 0.69) m2 for boys and 0.09 (0.17) (range −0.17 to 0.69) m2 for girls.
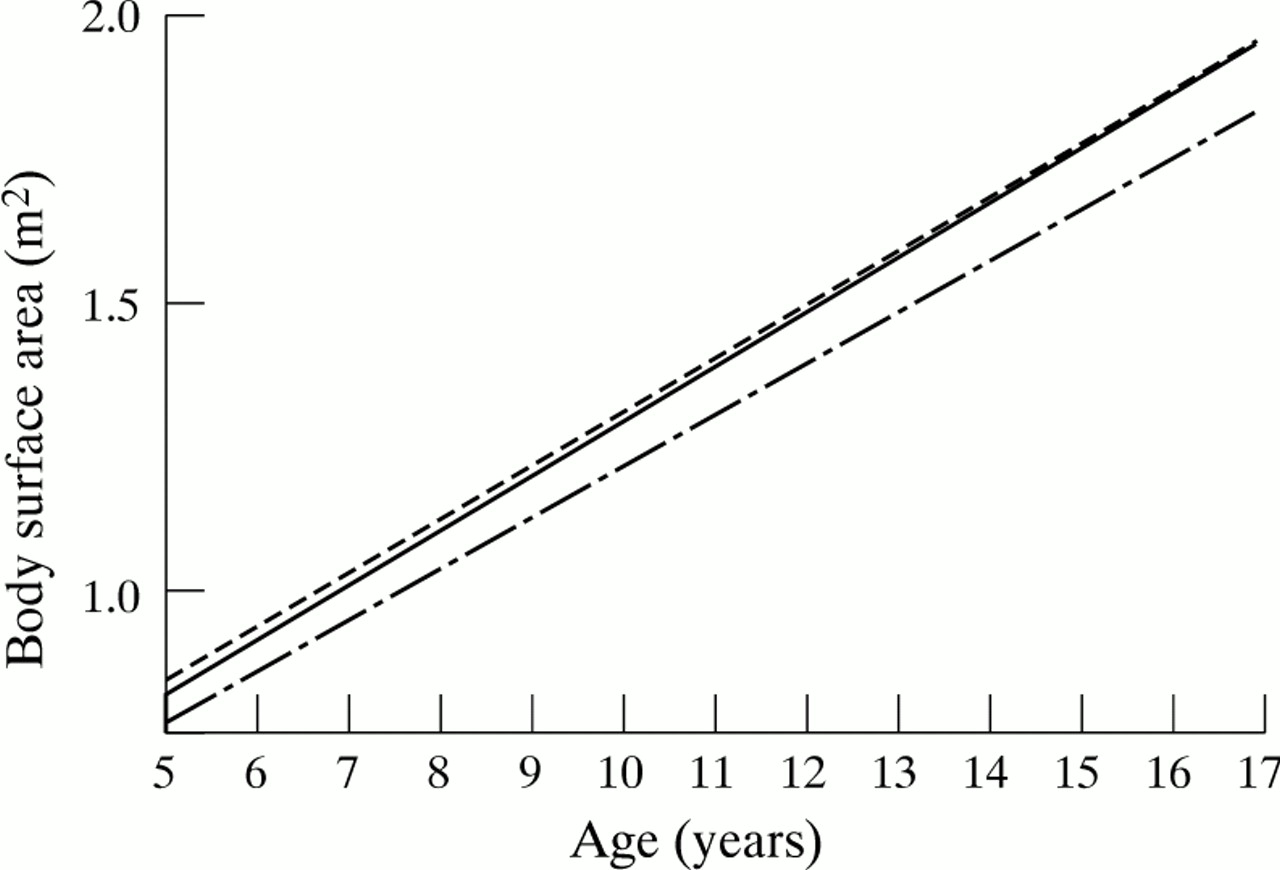
Body surface area growth for boys. Solid line: present population; dotted line: 50th centile of a standard Dutch population; dashed line: 75th centile of a standard Dutch population.

Body surface area growth for girls. Solid line: present population; dotted line: 50th centile of a standard Dutch population; dashed line: 75th centile of a standard Dutch population.
AORTIC ROOT DIAMETER
Although our data showed roughly the same linear regression (y = 9.9x + 11.6) as the standard body surface area nomogram (y = 9.8x + 10.2), we found a weaker correlation (R 2 = 0.62 v 0.93), although more subjects were studied. In 22 of 91 children (24%), the aortic root diameter exceeded the upper limit of the standard body surface area nomogram by 0.1 to 6.8 mm (mean 2.4 (2.2) mm). The adjusted nomogram, based on our data, showed wider prediction intervals, allowing for a greater variability in aortic root size, especially on the upper limit (fig 3).
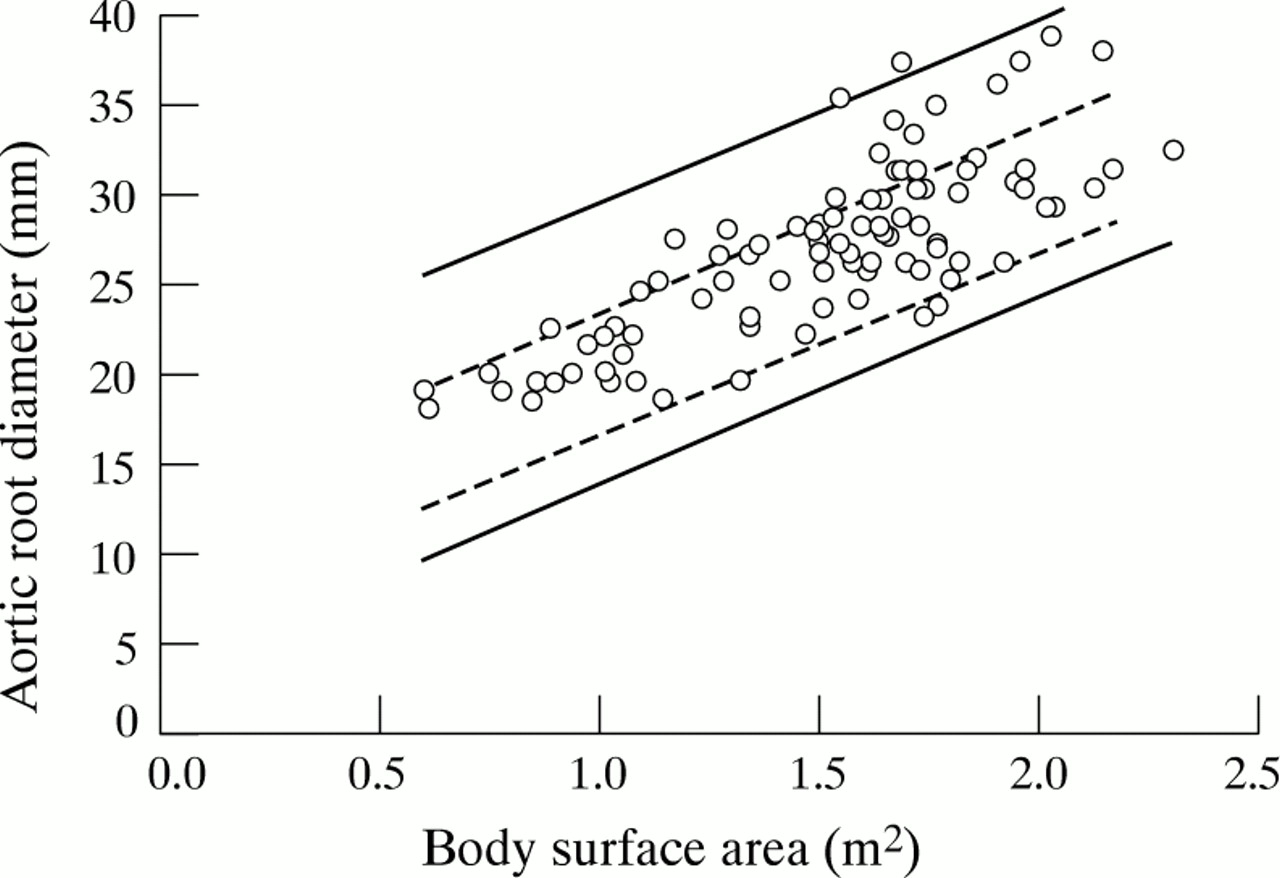
Relation between aortic root diameter and body surface area (BSA) (empty circles) and 95% reference limits for aortic root diameter in relation to BSA (solid lines), in subjects aged 3.2 to 18.4 years. Upper limit of normal: y = a + 7.58 + SQRT[1.01 + (b − 1.50)2/12.99]; lower limit of normal: y = a + 7.58 + SQRT[1.01 + (b − 1.50)2/12.99], in which b = BSA and a = expected aortic root diameter from the linear regression function (y = 9.9x + 11.6, see Results) for a given value of b. The upper and lower limits of normal of the standard nomogram (Roman et al14 ) are shown in dashed lines.
COMPARISON OF M MODE AND CROSS SECTIONAL ECHOCARDIOGRAPHY
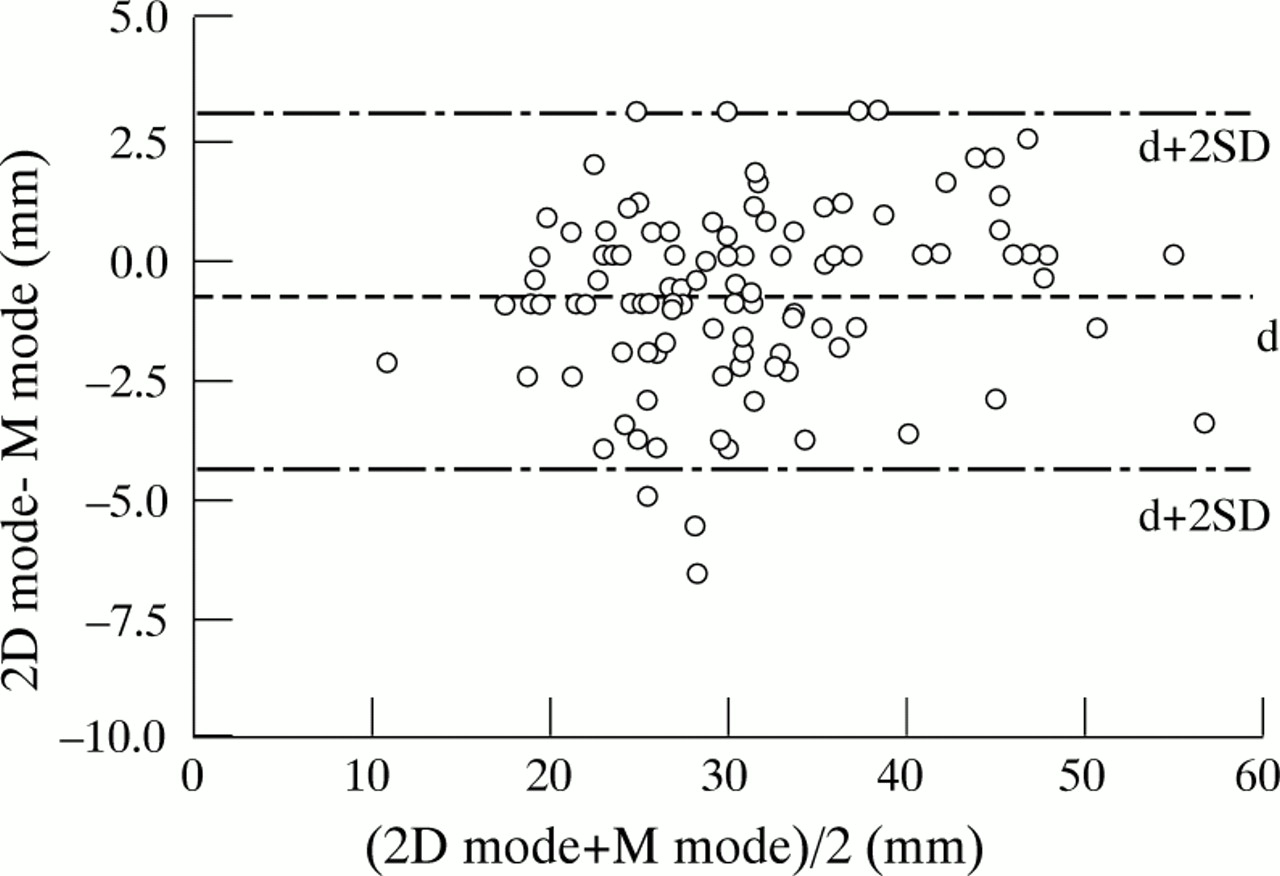
Bland–Altman analysis (fig 4) revealed an average difference of −0.8 (1.8) mm, with slightly larger values from M mode echocardiography; 95% prediction intervals ranged from −4.4 to 2.8. The observed differences in the 114 measurements were not dependent on the aortic root diameter.
Differences between measurements of aortic root diameter by M mode and cross sectional echocardiography against their means; n = 114, mean difference (d) = −0.8 mm, p < 0.0001, SD = 1.8 mm; 95% reference limits: d+2SD = 2.8 mm, d−2SD = −4.4 mm; 95% confidence interval of d: −1.1 to −0.5 mm.
Discussion
MARFAN SYNDROME
Aortic root dilatation is one of the major criteria for assessing the diagnosis of Marfan syndrome.2 ,3 Patients with Marfan syndrome are at risk of sudden death from aortic dissection or rupture. Marfan patients with non-enlarged aortic roots are thought to be at low risk of these complications.3 ,28 Hence, both for accurate assessment of the diagnosis of Marfan syndrome and for recognition of a group of Marfan patients with low risk of severe aortic problems, it is critical to define whether the aortic root is really enlarged.
ECHOCARDIOGRAPHY
Echocardiographic measurements of the aortic root in our population did not show complete agreement with the nomogram used as the standard for children proposed by Roman et al.14 Our data, however, were obtained from M mode echocardiography, whereas Roman’s nomogram was based on cross sectional echocardiography. Information about differences in the diameter of the aortic root between the two modes is limited, though Roman et al, who studied 52 normal children with both echocardiographic approaches, observed that the aortic root diameters at the level of the sinuses of Valsalva were systematically larger when assessed by cross sectional echocardiography than by M mode, by a mean of 2 mm.14 Of 58 available cross sectional measurements of our population, however, 11 aortic root diameters (19%) also exceeded the upper limit of the standard nomogram. We also compared M mode and cross sectional echocardiographic aortic root measurements in our own population using Bland–Altman analysis. No systematic clinically relevant difference between the two methods was found. The prediction interval presented in fig 4 indicates that 95% of all differences will be between −4.4 mm and 2.8 mm. Factors such as two different technicians, intraobserver and interobserver variability, the use of different recorders and transducers, and different patient positioning largely account for the distribution of these differences in measurement results.13 ,29 Consequently, the two modes can be used interchangeably. Two different nomograms for either cross sectional or M mode echocardiography do not appear to be necessary.
POPULATION AND BODY SURFACE AREA
Several investigators have proposed nomograms for standardisation of aortic root size in relation to body surface area.11 ,14 ,16 ,17 ,19-21 ,30 The nomogram proposed by Roman et al 14 is currently the most widely used and is recommended by de Paepe et al 7 in the revised diagnostic criteria for Marfan syndrome. Our study population consisted of subjects referred for screening for Marfan syndrome in whom the diagnosis was definitely excluded on the basis of repeated evaluation of the diagnostic criteria for all organ systems. These children may have a deviant body surface area, excessive growth, and marfanoid body appearance, which are important reasons why subjects are referred for Marfan screening. A possible explanation for the upward scatter of our data could be the selection of a tall subgroup in a standard population, in which aortic root dimensions are larger than expected. Reed et al 19 constructed a body surface area nomogram for aortic root dimensions in tall adults (exceeding the 95th centile for height) between 17 and 26 years of age. There was a much weaker linear correlation (n = 182,R 2 = 0.54) between body surface area and aortic root diameter (showing a larger scatter, as in the present study) than in the population of Roman et al.14 To our knowledge, a nomogram for tall children has not yet been reported. Although we do not have full details of the body size measurements done in the population reported by Roman et al, the mean body surface area at nine years of age was 1.1 m2, which is 0.5 m2 below the regression line of our data in fig 1. Therefore it seems likely that, in relation to age, there are differences in body surface area between our population and that of Roman et al. This can only partially be explained by possible geographical differences in body surface area at a particular age between The Netherlands and the USA, because comparisons using a standard Dutch reference population still show an upward shift of the correlation, roughly following the 75th centile of body surface area.
So, as in tall adults, a wider range of aortic root diameter should be considered normal in tall children compared to an average unselected population.
CONCLUSIONS
We conclude that a Marfan screening population differs from an unselected echocardiography population in aortic root size variability. This is probably due to differences in anthropometric measurements in this specific population. The use of an adjusted nomogram rather than a standard nomogram seems appropriate for routine clinical screening in this specific group of patients with deviant body surface areas. There were no clinically relevant differences between M mode and cross sectional echocardiography in the assessment of aortic root diameters.