Article Text

Abstract
OBJECTIVE Several methods exist for estimating the risk of perioperative mortality based on preoperative risk factors; graphical methods such as the variable life adjusted display (VLAD) can be used to examine how an individual surgeon's performance for a series of operations fares against what would be expected, given the case mix. This study aimed to devise a method for assessing the natural variation in outcome in order to assist with making judgements about individual performance, in particular whether seemingly poor performance could have occurred by chance.
METHOD The risk scoring system has been derived and validated locally for cardiac surgery. A method is described for calculating the probability that an observed number of deaths occurs within a sequence of operations if perioperative mortality is regarded as a chance event with an expected value derived from the risk score. To illustrate this method, nested prediction intervals are superimposed onto VLAD plots for a series of 393 isolated coronary artery bypass and isolated valve operations performed by a single surgeon.
RESULTS Using the locally derived risk score, the VLAD plot for the individual surgeon shows a net life gain of about 6 over the predicted number of survivors, which is observed to be within the 90% prediction interval. If the Parsonnet scoring system is used instead of the locally derived risk score, the net life gain is considerably overestimated.
CONCLUSIONS The nested prediction intervals are straightforward to generate and can be integrated into a visually informative display. As an indication of the inherent variability in outcome, they have a valuable role in the monitoring of surgical performance.
- perioperative mortality
- variable life adjusted display
- locally derived risk score
- Parsonnet score
Statistics from Altmetric.com
It has been stressed that comparison of inpatient mortality rates has little meaning unless adjustments are made for the severity of illness.1 It is self evident that a surgeon whose practice includes a higher proportion of patients with risk factors for perioperative deaths will report higher mortality than one with low risk cases. To address this, Parsonnet derived a system of scoring each cardiac surgical case on the basis of readily available preoperative risk factors which are weighted and summed to produce an estimate of preoperative risk.2 For a given case mix, a cumulative expected mortality can be derived, which would represent “par for the course”. Parsonnet's system has proved robust in that it has consistently been shown to predict risk strata that correlate with the observed mortality, but equally consistently the scores overestimate risk of contemporary coronary surgery by up to 100%.3 ,4Other systems have been derived to predict perioperative risk of death more accurately.5-10 In this paper we have used a locally derived scoring system that accurately reflects the risk of death in our own practice.9
Using such risk scoring systems, methods already exist for observing how the performance of individual cardiac surgeons or surgical units fare against what would be expected. The authors have previously described one such method that can be used to monitor a surgeon's mortality data over time to assist in the process of audit.11 This graphical technique known as the variable life adjusted display (VLAD) is an extension of the cumulative sum (cusum) method which was introduced to cardiac surgeons by de Leval and colleagues.12 ,13 In cusum charts, successive cases are recorded on the horizontal axis, and the plot moves up by one unit for each death, to represent the cumulative sum of deaths. As a refinement of the cusum technique, VLAD incorporates information about both success and failure, with due account being taken of prior estimated risks in each case. The plot shows the difference between the cumulative predicted mortality and the deaths that actually occurred. It thus gives a running tally of how far a surgeon's cumulative survival figures are above or below par. An unresolved problem, however, is the criteria that should be employed to judge when performance falls outside the expected range of variability and is a cause for concern.14
Here we discuss a method for combining preoperative assessments of risk in order to estimate the variability in mortality that might be expected for a given series of cases. This is not a formal statistical test, but an indication of the inherent variability of mortality which, for a given case mix, assists the process of interpretation.14 Given a spell of apparently poor surgical performance, it is important to judge whether it truly represents substandard performance, or whether it reflects an unfortunate series of chance events.
Of course, such a judgement can rarely be made with absolute certainty. Most would mistrust dice that show six the first five times they are cast; however, such a series of sixes is as likely to occur as any other series with unbiased dice and the possibility exists that the series occurred as a coincidence. Judgements about apparent poor surgical performance present a similar dilemma. The methods described here cannot resolve this matter, but they can be used to assess how likely it is that a given perioperative mortality rate could have occurred by chance.
Methods
The analysis method that is used is based on mathematical modelling techniques. Here we will describe the principal features of the analysis and how this leads to a useful way of displaying information.
The first part of the process is to gain a preoperative assessment of each patient's risk of perioperative death. Although Parsonnet's system has been adopted widely and has a number of useful features,2 it actually reflects contemporary UK practice rather poorly. In this analysis we use a risk forecasting method based on the analysis of all patients who underwent isolated coronary artery bypass surgery (CABG) or isolated valve surgery at St George's Hospital, London, during the four year period from 1 January 1992 to 31 December 1995. Using these data, forecasting formulae were developed based on the following factors: operation type, patient age, left ventricular function, whether or not the patient was in extremis, and whether or not the procedure was a reoperation.9
For a given series of operations, this risk forecasting formula gives an associated series of perioperative death probabilities, each of which could be different. The analysis presented here describes a method for combining these to calculate the probability that a given overall mortality would result, if the outcome of each operation is regarded as a chance event. In terms of the earlier dice throwing analogy, this corresponds to calculating the probability of a given number of sixes arising from a sequence of throws—a standard problem in probability theory whose analysis is well known.15However, in the context of a series of operations, calculating the probability of a given level of mortality is rather more difficult to analyse since the individual death probabilities differ. Exact calculation requires the enumeration of all possible combinations of deaths resulting in a given total overall mortality, and the calculation of the probability of each combination occurring. If there are numerous operations, these calculations rapidly become cumbersome.
Fortunately, a simple method is available that gives a good approximation to the required probabilities. This uses the fact that the overall mortality for a sizeable sequence of operations, if repeated for identical series of patients, is approximately normally distributed. The smallest length of such a sequence for the normal approximation to be valid will depend on the distribution of the individual mortality rates. Nevertheless, it should be valid for sequences of over 100 operations.16 Both the mean and standard deviation of this normal distribution can be calculated in terms of the individual perioperative mortality rates. Mathematical details of the calculation of the mean mortality and the standard deviation are given in the . This normal distribution can be used to construct a 95% prediction interval which is a range in which the number of deaths would be expected to fall on 95% of occasions, were the series of operations repeated with an identical mix of preoperative risks. Prediction intervals for other percentile ranges are also straightforward to calculate.
Results
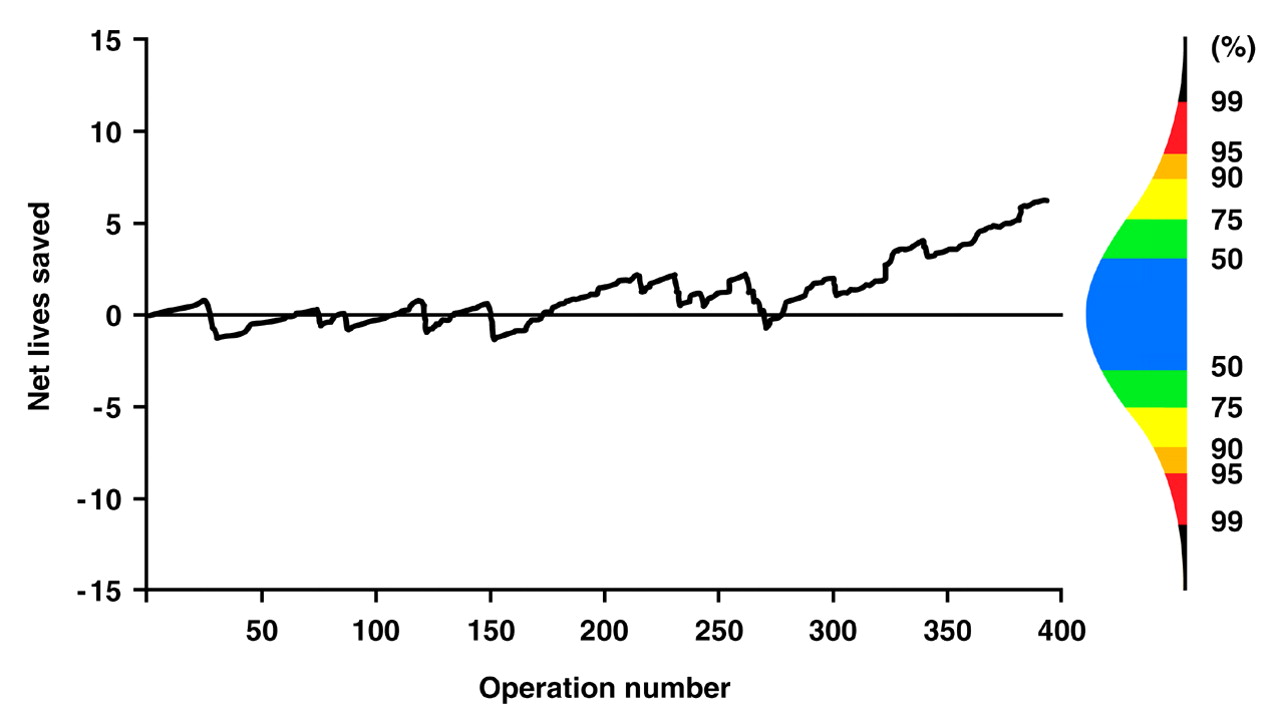
Using this analysis, it is possible to superimpose nested prediction intervals on VLAD charts to indicate the likely variability associated with a given series of operations. This is illustrated in figs 1 and 2 which show outcome summaries for a mixture of 273 isolated CABG and 120 isolated valve operations performed by a single cardiac surgeon. The prediction intervals are displayed to the right of each graph in colours that echo increases in temperature from blue (50% interval) to red (95–99% interval).

Variable life adjusted display for a series of 393 operations performed by a single surgeon with a prediction interval for the likely variation in performance of an “average” surgeon after the same number of operations. Predicted mortality calculated by locally derived risk score.

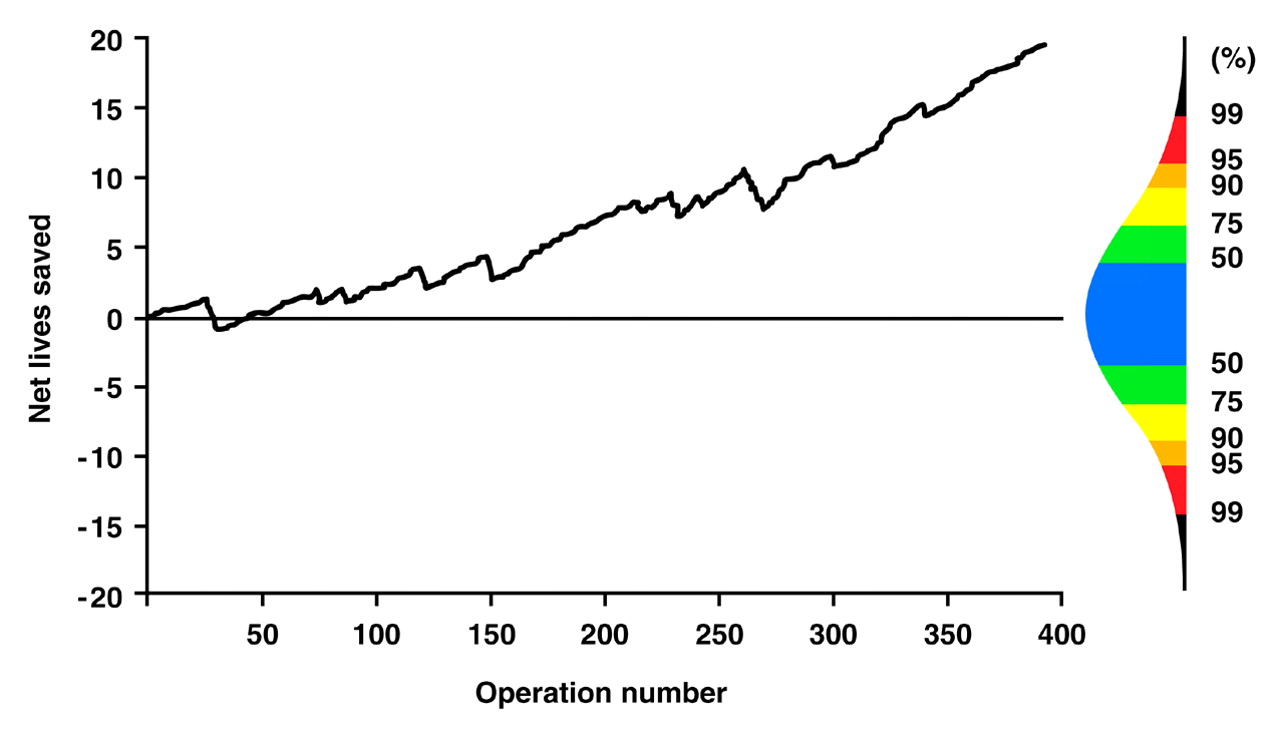
Variable life adjusted display for a series of 393 operations performed by a single surgeon with a prediction interval for the likely variation in performance of an “average” surgeon after the same number of operations. Predicted mortality calculated by Parsonnet risk score.
Figure 1 shows a VLAD chart using the locally derived risk scoring system to generate expected mortalities. The horizontal axis indicates expected performance for the case mix. At the end of the series, despite fluctuations in performance, the VLAD shows a net life gain of about 6 over predicted. Performance is therefore just above what would be expected for the case mix, but is within the 90% prediction interval, which indicates what would be expected of the 90% of surgeons spanning the average performance. Figure 2 shows the same data based on Parsonnet risk prediction. It can be seen to give a misleadingly optimistic view of the surgeon's performance, overestimating the net life gain but also remote from the range of discrimination of the risk stratification.
Discussion
The prediction intervals presented here are those of an average surgeon, in that they are centred on the midpoint of the range of likely performances. This concept is not an easy one for the lay public to grasp since the word “average” has become devalued in every day parlance, while performance to the desired standard is described by ever escalating superlatives until even “excellence” has little meaning. For that reason, the Parsonnet system, which allows the majority of cardiac surgeons to do better than its predicted mortality, has provided a pragmatic form of lower tolerance level.17
We have developed a method for deriving prediction intervals that takes account of the heterogeneous nature of preoperative risk estimates. A previous study investigating control limits for monitoring outcome has assumed all such risks are identical18 in which case the statistical analysis would be somewhat easier, reducing to a routine application of binomial distribution methods. Unfortunately this will lead to overestimates of the variance, making the prediction intervals wider and “more forgiving” than they should be.19 This effect is particularly pronounced for a caseload largely composed of low risk cases with a small number of very high risk cases, which is not unusual in surgery.
Because we are investigating overall performance for an individual surgeon or group of surgeons, we have combined outcomes from more than one type of operation, although different risk prediction models are used for the different types. In this analysis, we have only generated prediction intervals for the combination of isolated CABG and isolated valve operations. For other cardiac surgery, much smaller quantities of data were available for each procedure resulting in an inaccurate prediction model. When we included these, they were found to have a large impact on the resulting prediction intervals, losing the more accurate information we had about isolated CABG and valve operations.
We have superimposed the nested prediction intervals onto VLAD charts giving an indication of the inherent variability of mortality data. We deliberately avoid charting prediction intervals in a continuous fashion since doing so would run the danger of encouraging gross misinterpretation owing to “multiple testing” errors. Although all the previous information displayed in the VLAD chart is used to derive the prediction intervals, the intervals themselves only represent the likely variability in performance at one moment in the surgical history and not throughout the period. We avoid the notion of a single prediction interval derived using a single probability level. Displaying nested prediction levels using colour coding to indicate increasing departures from expected mortality assists interpretation and helps to alert the clinician to potential problems. A surgeon should certainly not be complacent if mortality figures are poor but manage just to stay within the 95% limit.
Appendix
This appendix presents mathematical details for the method used to calculate the prediction intervals for the difference between cumulative expected and cumulative actual mortality as plotted in the VLAD charts.
Suppose a surgeon operates on n patients and that, for the ith patient the estimated preoperative risk of death is denoted by ŷi .
Define random variables {Xi } as

If we define:

then for a series of n patients,Sn is the cumulative actual mortality and Ŷn the cumulative expected mortality estimated by the model.
The difference between the cumulative expected and actual mortality (the net life gain) as plotted in the VLAD charts is defined by

By the central limit theorem (due to Liapounov) for a large enough set of independent, but not necessarily identically distributed, random variables, the quantity

is a standard normal variate.20
If the model used to derive the expected mortalities is valid for the series of n patients, we can assume thatE[Vn ] = 0 and that, as an approximation:

so that

is a standard normal variate and a prediction interval can be calculated as:

where the value of z = 1.960 for 95% limits and 2.576 for 99% limits. Detailed reasons as to why these approximations are valid are too long and complex to be presented here and can be obtained from the authors.