Article Text

Abstract
Objective Atrial fibrillation (AF) is the most common cardiac arrhythmia and an important risk factor for stroke. Treatment with anticoagulants substantially reduces risk of stroke. Current prevalence and treatment rates of AF in the UK as well as changes in recent years are not known. The aim of this analysis was to determine trends in age–sex specific prevalence and treatment of AF in the UK from 2000 to 2016.
Methods 17 sequential cross-sectional analyses were carried out between 2000 and 2016 using a large database of electronic primary care records of patients registered with UK general practitioners. These determined the prevalence of patients diagnosed with AF, the stroke risk of those with AF and the proportion of AF patients currently receiving anticoagulants. Stroke risk was assessed using CHA2DS2-VASc score.
Results Age–sex standardised AF prevalence increased from 2.14% (95% CI 2.11% to 2.17%) in 2000 to 3.29% (95% CI 3.27% to 3.32%) in 2016. Between 2000 and 2016, the proportion of patients with AF prescribed anticoagulants increased from 35.4% (95% CI 34.7% to 36.1%) to 75.5% (95% CI 75.1% to 75.8%) in those with high stroke risk (p for change over time <0.001) and from 32.8% (95% CI 30.5% to 35.2%) to 47.1% (95% CI 45.4% to 48.7%) in those with moderate stroke risk (p<0.001). In patients with low risk of stroke, the proportion decreased from 19.9% (95% CI 17.8% to 22.2%) to 9.7% (95% CI 8.4% to 11.1%) (p<0.001). Anticoagulant prescribing performance varied between practices; in 2016, the proportion of eligible patients treated was 82.9% (95% CI 82.2% to 83.7%) and 62.0% (95% CI 61.0% to 63.0%) in the highest-performing and lowest-performing practice quintiles, respectively. There was poor agreement in individual practice performance over time from 2006 to 2016: linear-weighted κ=0.10 (95% CI 0.02 to 0.19).
Conclusions From 2000 to 2016, the prevalence of recorded AF has increased in all age groups and both sexes. Anticoagulant treatment of eligible patients with AF has more than doubled, with marked improvements since 2011, alongside a reduction in the use of anticoagulants in ineligible patients with AF.
- atrial fibrillation
- epidemiology
- stroke
Statistics from Altmetric.com
Introduction
Atrial fibrillation (AF) is the most common sustained cardiac arrhythmia and is associated with a fivefold increase in risk of stroke.1 Stroke risk is reduced by approximately two-thirds by warfarin or novel oral anticoagulants (NOACs); aspirin is considerably less effective but has a similar risk of major bleeding.2–4 AF accounts for 14% of all strokes, and strokes associated with AF are associated with higher mortality.5
Anticoagulant prophylaxis has been recommended for patients with AF at elevated risk of stroke since 2006.6–8 Current UK and European guidelines recommend anticoagulants for all patients with AF with a CHA2DS2-VASc score ≥2, and recommend considering them for men with a CHA2DS2-VASc score of 1.7 9 Earlier guidelines recommended anticoagulants for patients with a CHADS2 score ≥2, anticoagulants or aspirin for those with a CHADS2 score of 1 and aspirin for those with a CHADS2 score of 0.1 10 This includes all AF types (paroxysmal, persistent or permanent) and atrial flutter, since all groups are at increased risk of stroke.11 12
There is substantial evidence demonstrating both undertreatment of moderate-risk to high-risk patients and overtreatment of low-risk patients in the UK over the past decade.13 14 Both may be associated with increased risk of stroke15. Low AF treatment rates have also been found internationally16 17; however, studies in Germany and Switzerland have reported anticoagulant use in ≥80% of eligible patients, in both primary and secondary care settings, suggesting that higher rates of anticoagulant use are possible.18 19
Current prevalence of diagnosed AF and recent AF treatment patterns are unknown. The purpose of this study was to provide a broader understanding of the prevalence and treatment of AF in the UK over the past 17 years. The primary objectives were to determine age–sex specific prevalence of diagnosed AF in the UK each year from 2000 to 2016; to determine the proportions of patients with AF prescribed anticoagulant treatment, antiplatelets only or no treatment, stratifying patients according to stroke risk; to investigate trends in prevalence and treatment over the 17 years and to investigate variations in AF diagnosis and anticoagulant prescribing between general practices.
Methods
See online supplementary appendix for further detail.20
Supplementary file 1
Data source
Analysis was performed using patient data from The Health Improvement Network (THIN), an anonymised database of electronic primary care records from UK general practices which use Vision software. THIN includes coded data on patient characteristics, prescriptions, consultations, diagnoses and primary care investigations.
Practices were eligible for inclusion in the study from the latest of the practice acceptable mortality recording date,21 Vision installation date and study start date (1 year prior to the first census date). All analyses were conducted using Stata IC version 14.2.
Study design
Seventeen sequential cross-sectional analyses were performed on 1 December each year from 2000 to 2016 (census dates). To determine the prevalence of AF, all patients aged ≥35 years and registered at least 1 year prior to the census date were eligible for inclusion in the denominator; exposure was a record of AF prior to the census date with no clinical code indicating ‘AF resolved’ recorded after the last recorded AF code and prior to the census date. To investigate treatment rates, patients aged ≥35 years, with a recorded diagnosis of AF and registered at least 1 year prior to the census date were eligible for inclusion; patients with a clinical code indicating ‘AF resolved’ recorded after the last recorded AF code and prior to the census date were excluded.
Analysis
Crude age–sex specific prevalence of diagnosed AF was calculated on each of the 17 census dates. 95% CI for proportions were calculated using the exact binomial method. χ2 tests were used to calculate p-values for trends over time. Prevalence in each year was directly age–sex standardised using the 2016 age–sex distribution as the standard.
Proportions of patients prescribed anticoagulants, antiplatelets only, and neither were calculated with 95% CIs for proportions on each of the 17 census dates. Patients were stratified according to stroke risk. In primary analysis, stroke risk and eligibility for treatment were defined in accordance with current guidelines using CHA2DS2-VASc score; male patients with a CHA2DS2-VASc score ≥1 and female patients with a CHA2DS2-VASc score ≥2 were eligible for anticoagulant treatment.7 9 In sensitivity analysis, stroke risk/eligibility was defined using CHADS2 score (those with a score ≥1 were eligible for treatment), as the CHADS2 score has been in use for a greater proportion of the study period than CHA2DS2-VASc score.1 7 22 In a further sensitivity analysis, eligibility for treatment was determined by CHA2DS2-VASc score, but patients with contraindications to anticoagulants were considered ineligible. Trends over time were plotted and χ2 tests used to determine if any observed trends were statistically significant.
Practice-level variation
Variation in diagnosis of AF between practices was assessed by determining the IQR for age–sex standardised practice-level prevalence of AF (directly standardised to the 2016 THIN age–sex distribution).
To investigate interpractice variation in anticoagulant prescribing to eligible patients over time, the performance of practices in the highest and lowest quintiles of anticoagulant prescribing were plotted for each year from 2000 to 2016; all practices contributing to the dataset were included.
Prescribing performance of individual general practices was assessed over the period 2006 to 2016; only practices contributing data on each of the 11 census dates were included. Linear-weighted kappa coefficients for ordered categories were calculated to ascertain whether practice performance remained constant over the period.
Results
Prevalence of AF
A total of 37,987,313 patient records belonging to 5,058,699 unique patients from 744 general practices were included in the analysis across the 17 census dates from 2000 to 2016: a median of 2,394,593 (IQR 1,881,881–2,698,834) patients per year (patient characteristics are shown in online supplementary table 1).
Supplementary file 2
Crude prevalence of recorded AF in adults aged ≥35 years increased 63%, from 2.02% (95% CI 1.99% to 2.04%) in 2000 to 3.29% (95% CI 3.27% to 3.32%) in 2016 (figure 1, online supplementary table 2). Directly standardised prevalence increased by 50% from 2.14% (95% CI 2.11% to 2.17%) in 2000.

Prevalence of diagnosed atrial fibrillation in men and women aged ≥35 years, 2000–2016.
Between 2000 and 2016, prevalence of diagnosed AF increased in all age categories and in both sexes; it increased exponentially with age and was higher in men than women at all ages (figure 2). The most significant increase in prevalence from 2000 to 2016 was observed in patients aged ≥85 years: doubling in men from 11.6% (95% CI 10.4% to 11.6%) to 22.1% (95% CI 21.6% to 22.6%), p<0.001, and increasing by almost three-quarters in women from 9.6% (95% CI 9.2% to 9.9%) to 16.5% (95% CI 16.2% to 16.9%), p<0.001. The age distribution of patients included in the ≥85 years age category did not change over this time period: the median age and IQR remained constant between 2000 and 2016 at 88 (IQR 86–91) years; the increase in prevalence was, therefore, not driven by an increase in age.
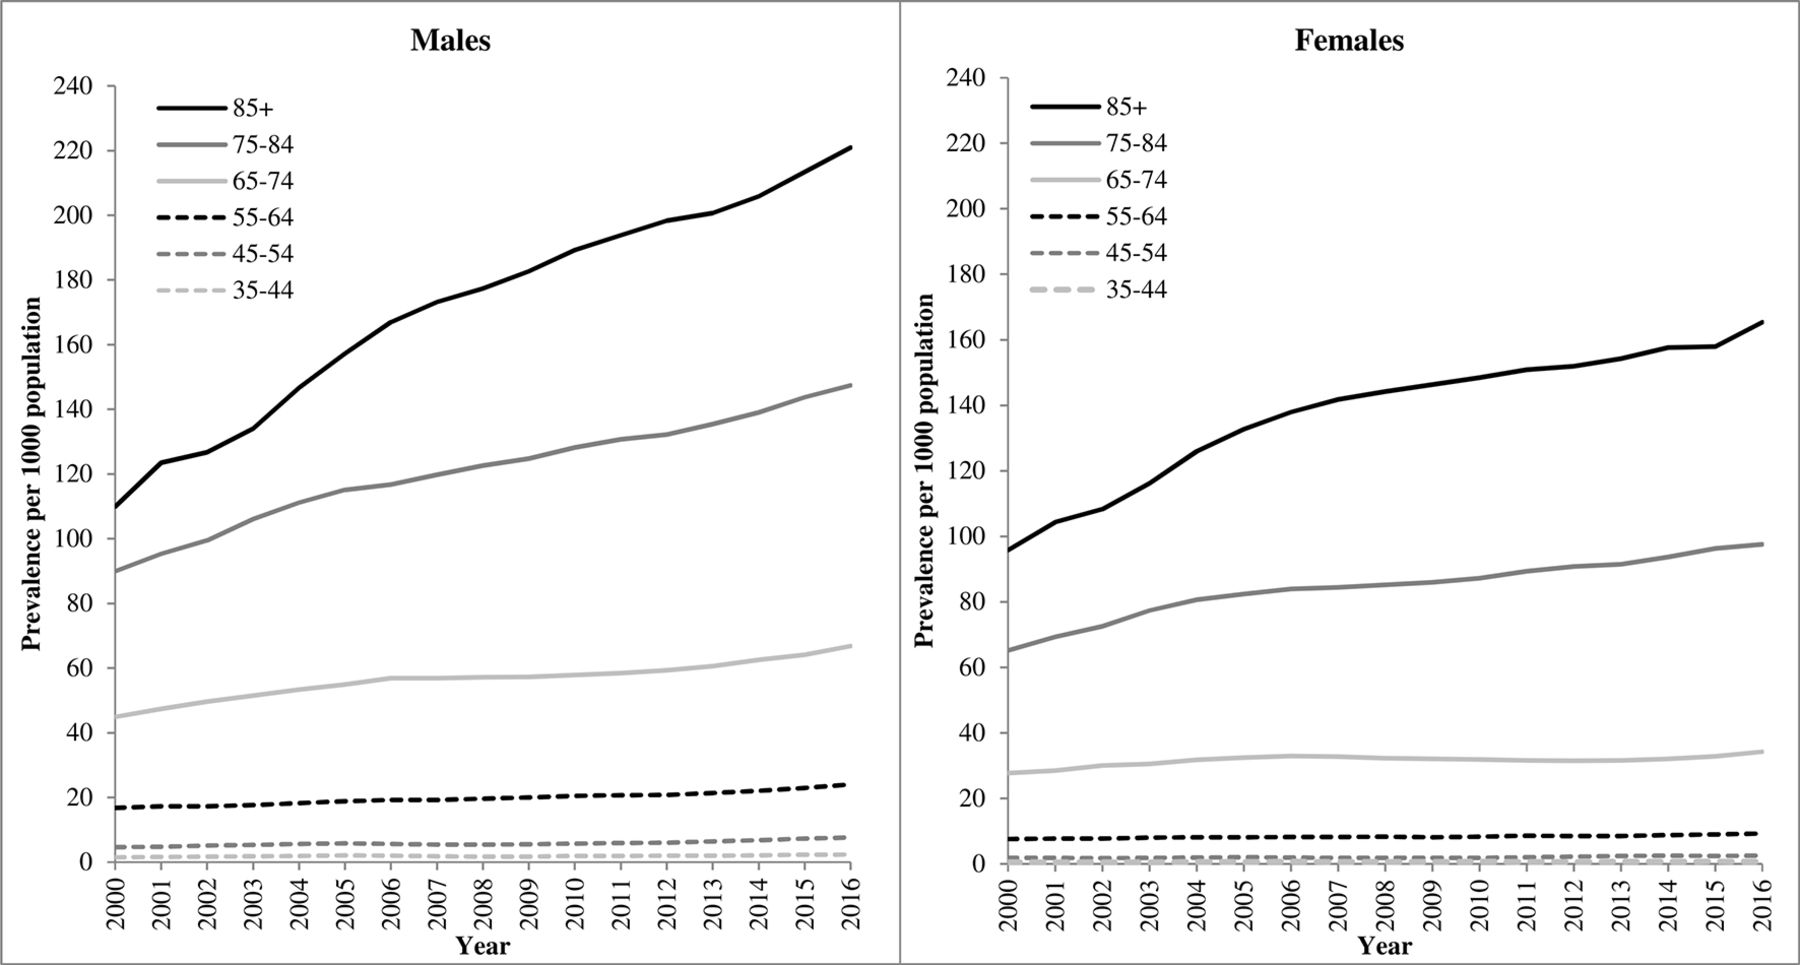
Age and sex stratified prevalence of diagnosed atrial fibrillation, 2000–2016.
Treatment of AF
1,031,122 records of patients with AF from 744 general practices were included in the treatment analysis across the 17 census dates, with a median of 64 080 (IQR 48 832–75, 255) patients per year. Demographic characteristics are presented in table 1. In 2000, the mean (SD) age of patients with AF was 74.5 (10.9) and 51.8% were male, and in 2016, the mean age was 75.5 (11.1) and 51.8% were male. A greater proportion of patients with AF were in the lowest (least deprived) Townsend quintiles than the highest (most deprived) quintiles; the distribution across the Townsend quintiles changed little between 2000 and 2016.
Demographic characteristics of patients with atrial fibrillation, 2000–2016
Between 2000 and 2016, the proportion of patients with AF prescribed anticoagulants increased from 34.3% (95% CI 33.7% to 34.9%) to 71.5% (95% CI 71.1% to 71.8%), p<0.001 for increase over time. The proportion of patients prescribed antiplatelet drugs only decreased from 32.4% (95% CI 31.8% to 33.0%) to 12.2% (95% CI 12.0% to 12.5%), p<0.001 for decrease over time. The proportion receiving no medication for stroke prevention decreased from 33.3% (95% CI 32.7% to 33.9%) to 16.3% (95% CI 16.0% to 16.6%), p<0.001 (figures 3–5). The case mix of patients with AF also changed over the 16-year period: the proportion of patients with CHA2DS2-VASc score ≥2 increased from 86.9% (95% CI 86.4% to 87.3%) in 2000 to 90.3% (95% CI 90.1% to 90.6%) in 2016 (p<0.001) (online supplementary table 3). This is probably in part due to the corresponding increase in the proportion of patients with AF aged ≥75 years (from 56.0% to 58.1%; p<0.001).

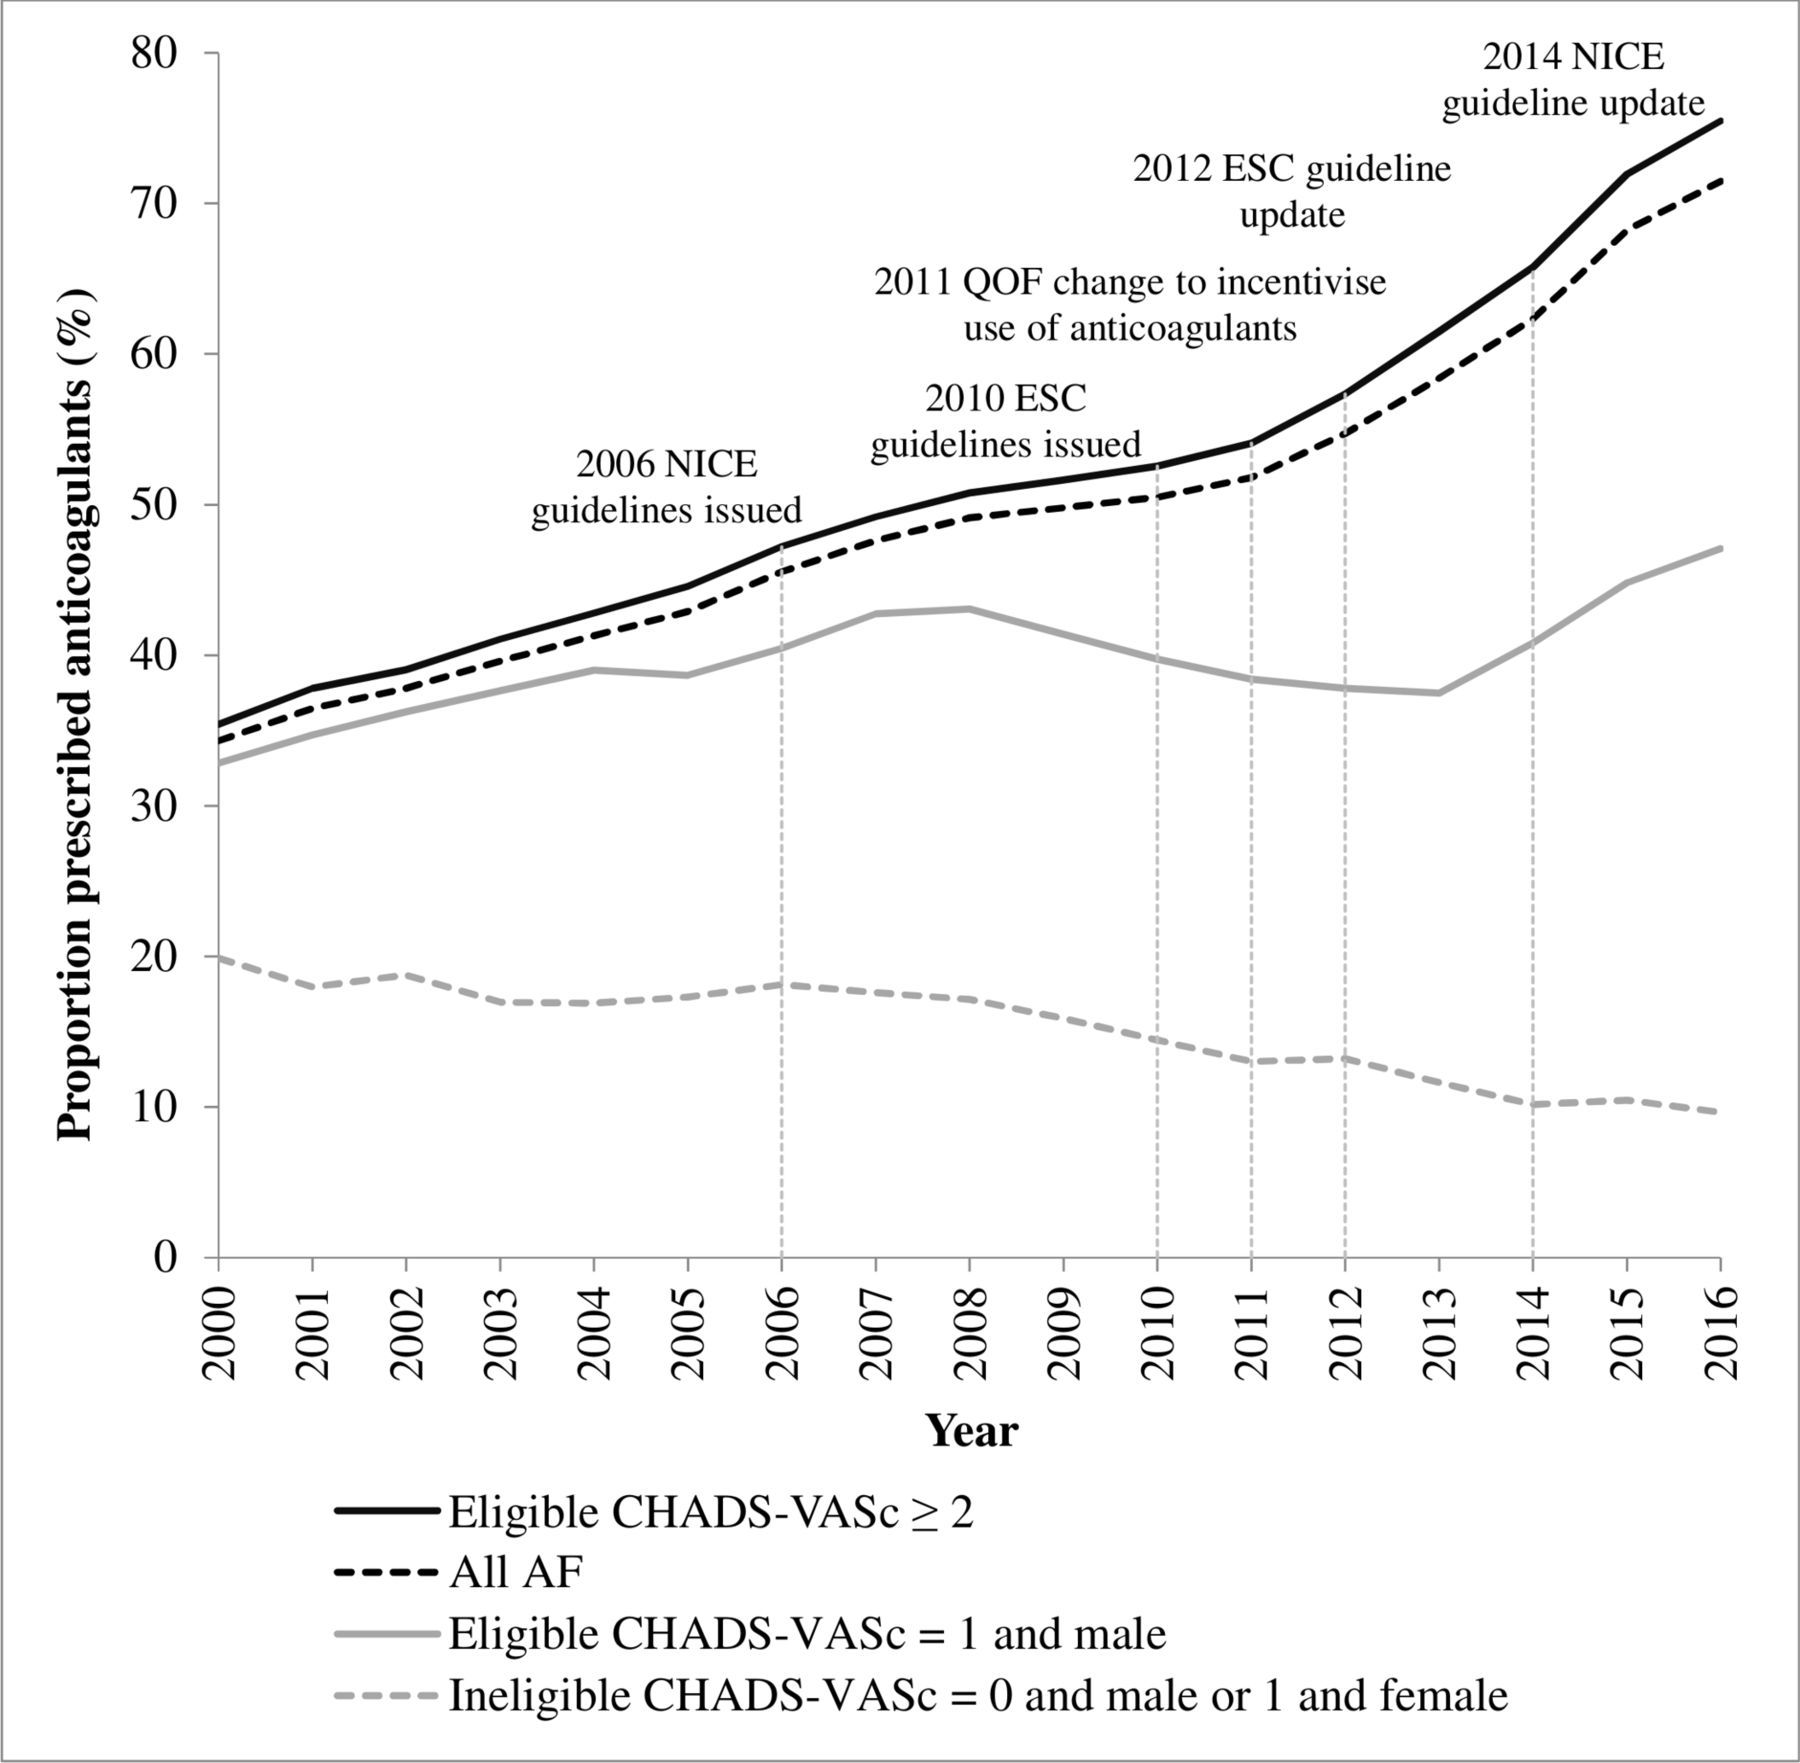
Proportion of patients with AF prescribed anticoagulants stratified by CHA2DS2-VASc score, 2000–2016. AF, atrial fibrillation; ESC, European Society of Cardiology; NICE, National Institute for Health and Care Excellence; QOF, Quality and Outcomes Framework.

Proportion of patients with AF prescribed antiplatelets stratified by CHA2DS2-VASc score, 2000–2016. AF, atrial fibrillation; ESC, European Society of Cardiology; NICE, National Institute for Health and Care Excellence; QOF, Quality and Outcomes Framework.

Proportion of patients with AF prescribed neither anticoagulants nor antiplatelets stratified by CHA2DS2-VASc score, 2000–2016. AF, atrial fibrillation; ESC, European Society of Cardiology; NICE, National Institute for Health and Care Excellence; QOF, Quality and Outcomes Framework.
Among high stroke risk patients with AF (CHA2DS2-VASc≥2), the proportion prescribed anticoagulants increased steadily from 35.4% (95% CI 34.7% to 36.1%) in 2000 to 75.5% (95% CI 75.1% to 75.8%) in 2016, p<0.001. In moderate stroke risk patients with AF (CHA2DS2-VASc=1 and male), it increased from 32.8% (95% CI 30.5% to 35.2%) to 47.1% (95% CI 45.4% to 48.7%), p<0.001. In low stroke risk patients with AF (CHA2DS2-VASc=0 for males or 1 for females), the proportion prescribed anticoagulants decreased from 19.9% (95% CI 17.8% to 22.2%) to 9.7% (95% CI 8.4% to 11.1%), p<0.001 (figure 3, online supplementary table 3).
In high-risk patients, lone antiplatelet prescribing remained relatively constant at over 35% between 2000 and 2007, decreased modestly to 2011 and then steadily dropped to 12.3% (95% CI 12.1% to 12.6%) in 2016, p<0.001. In moderate-risk patients, lone antiplatelet prescribing increased from 20.7% (95% CI 18.8% to 22.8%) in 2000 to a high of 38.4% (95% CI 37.1% to 39.8%) in 2011 and then dropped to 14.9% (95% CI 13.8% to 16.1%) in 2016, p<0.001. In low-risk patients, it increased from 9.2% (95% CI 7.8% to 10.9%) in 2000 to 25.5% (95% CI 23.9% to 27.3%) in 2010 and then decreased to 4.9% (95% CI 4.0% to 5.9%) in 2016, p<0.001 (figure 4). In all patients with AF, lone antiplatelet prescribing has decreased substantially since 2011.
The proportion of patients with AF receiving neither anticoagulant nor antiplatelet treatment decreased in high-risk patients from 29.6% (95% CI 29.0% to 30.3%) in 2000 to 12.2% (95% CI 11.9% to 12.5%) in 2016, p<0.001. In moderate-risk patients, it decreased from 46.5% (95% CI 44.0% to 48.9%) to 38.0% (95% CI 36.5% to 39.6%), p<0.001. In low-risk patients, it increased from 70.9% (95% CI 68.3% to 73.3%) to 85.5% (95% CI 83.8% to 87.0%) in 2016, p<0.001 (figure 5).
Defining stroke risk by CHADS2 score made little difference to the proportion of patients with high risk who were prescribed anticoagulants or to trends over time: the proportion treated increased from 37.0% (95% CI 36.2% to 37.9%) in 2000 to 78.3% (95% CI 77.9% to 78.7%) in 2016 (p<0.001). A greater proportion of patients were defined as having moderate risk (CHADS2=1), with the proportion treated following a similar trend to that in high-risk patients, increasing from 32.2% (95% CI 31.1% to 33.4%) in 2000 to 63.4% (95% CI 62.6% to 64.2%) in 2016 (p<0.001). Similarly, a greater proportion of patients were designated as low risk (CHADS2=0), and of these more were treated, with the proportion remaining relatively constant over time: 25.4% (95% CI 23.7% to 27.1%) in 2000 and 25.2% (95% CI 23.8% to 26.7%) in 2016 (online supplementary figure 1, online supplementary table 4).
Defining treatment eligibility according to CHA2DS2-VASc score and presence or absence of contraindications to anticoagulants made no difference to the proportions of eligible patients with moderate or high stroke risk prescribed anticoagulants, or to trends over time. However, when ineligible patients include those with contraindications, the proportion of ineligible patients prescribed anticoagulants was greater and increased from 28.1% (95% CI 26.3% to 29.9%) in 2000 to 47.5% (95% CI 46.1 to 48.9) in 2016, p<0.001 (online supplementary figure 2, online supplementary table 5); this is driven by treatment of patients with AF with contraindications.23
NOACs first appear in the study population in 2009, at which time less than 1 patient in 10 000 receiving anticoagulant treatment was prescribed NOACs; the proportion has increased substantially since, reaching 38.1% in 2016. There has been a corresponding drop in the proportion of anticoagulated patients with AF prescribed warfarin, from 99.3% in 2009 to 64.0% in 2016. (The sum of percentages in 2016 is greater than 100% as some patients were prescribed both types of anticoagulant.)
Variation in diagnosis and treatment of AF between general practices and performance over time
The IQR for age–sex standardised AF prevalence at individual practice level was 1.6%–2.5% in 2000 and 2.9%–3.6% in 2016, in patients aged ≥35 years.
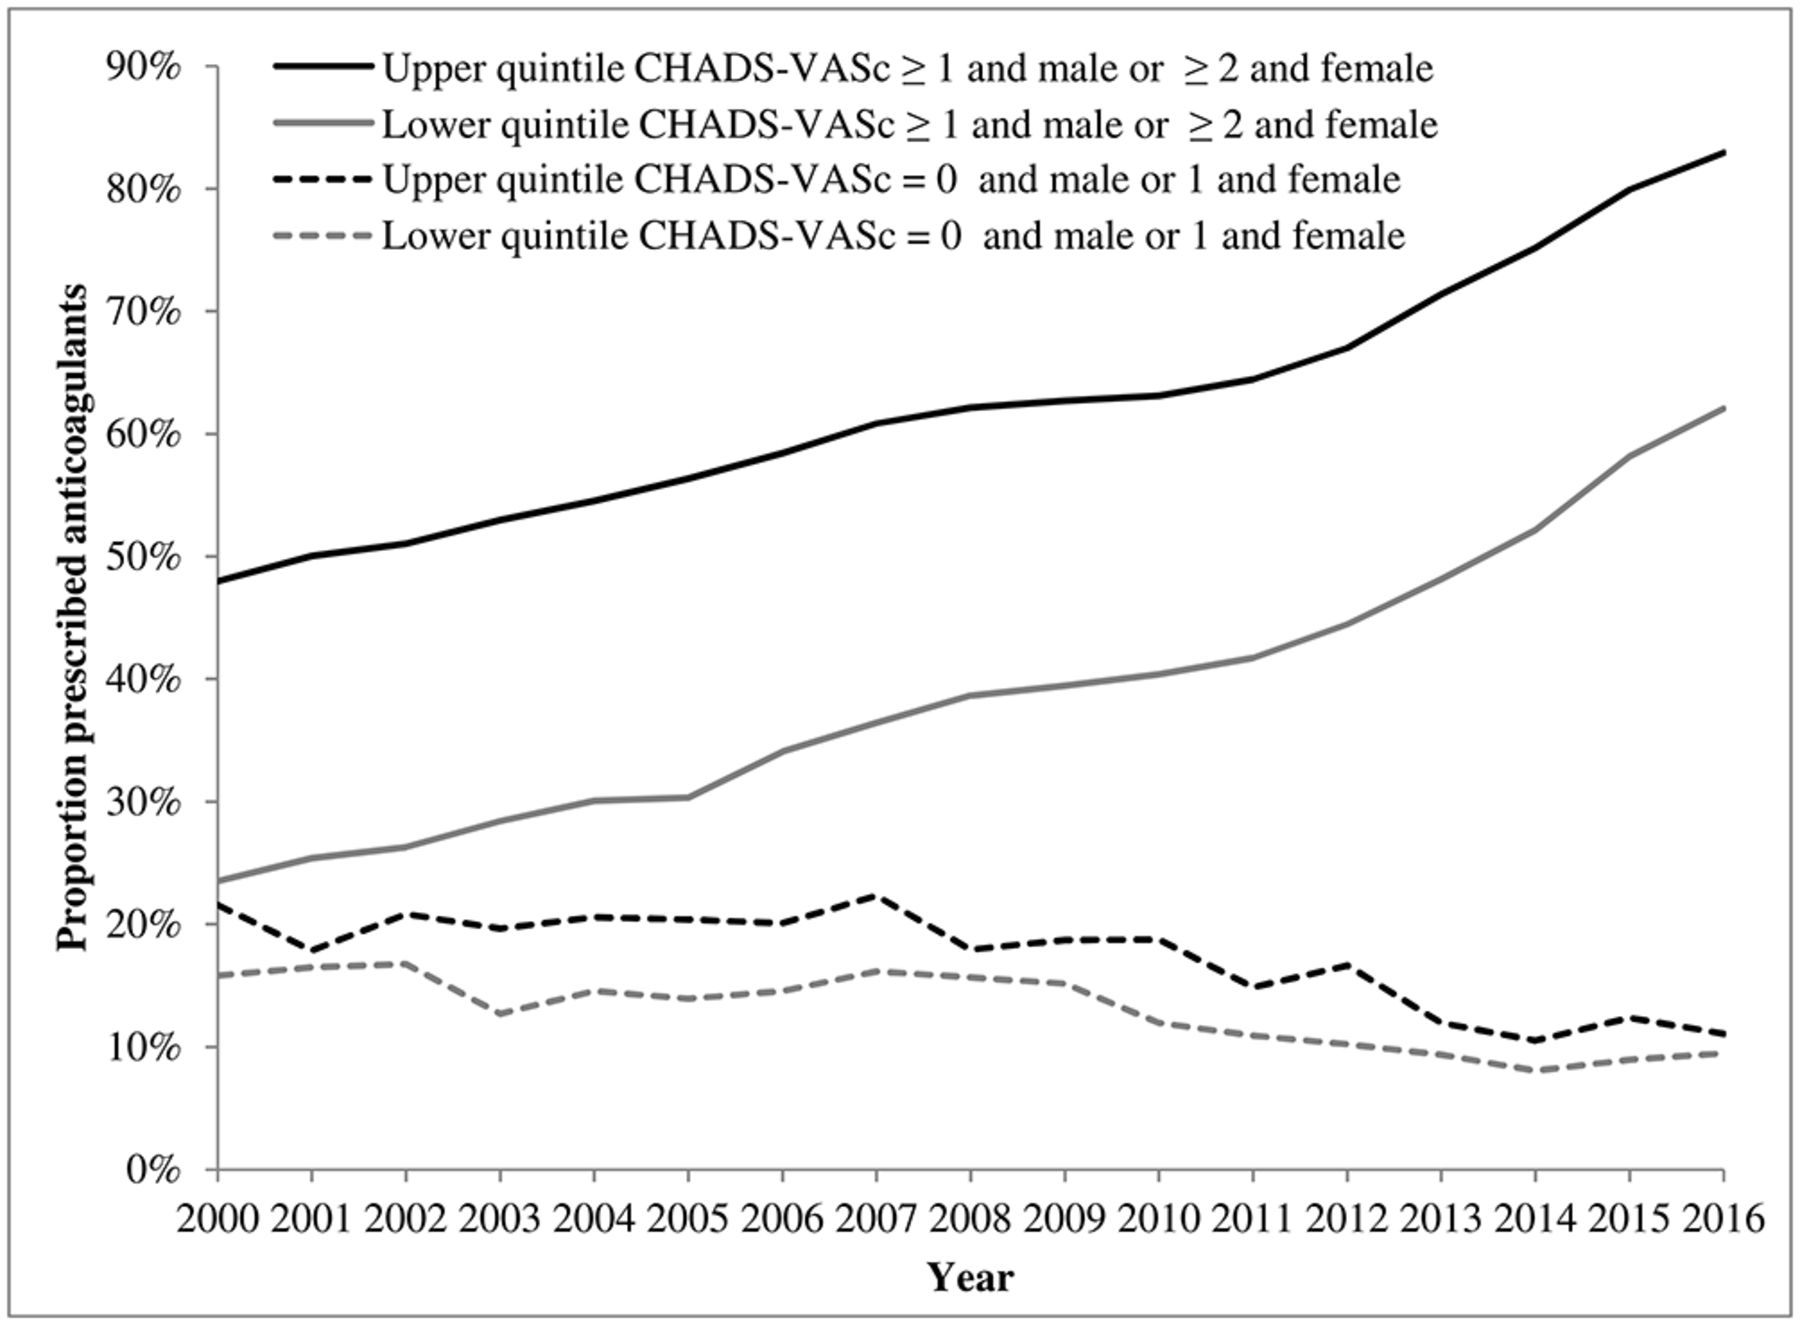
In 2000, the proportion of eligible patients (CHA2DS2-VASc≥1 and male or ≥2 and female) with AF prescribed anticoagulants in the highest-performing practice quintile was 48.0% (95% CI 46.2% to 49.7%), compared with 23.5% (95% CI 22.2% to 24.9%) in the lowest-performing quintile. By 2016, this had increased to 82.9% (95% CI 82.2% to 83.7%) and 62.0% (95% CI 61.0% to 63.0%) in the highest-performing and lowest-performing quintiles, respectively. The proportion of eligible patients with AF prescribed anticoagulants increased at a similar rate in the top and bottom practice-level prescribing quintiles (defined according to the proportion of eligible patients with AF prescribed anticoagulants). The gap in anticoagulant prescribing to eligible patients with AF has therefore remained relatively constant, decreasing slightly from 24% in 2000 to 21% in 2016 (figure 6).
Proportion of patients with atrial fibrillation prescribed anticoagulants by eligibility (CHA2DS2-VASc≥1 and male or ≥2 and female) and practice prescribing quintile over time, 2000–2016.
276 practices contributed data in every year from 2006 to 2016 (equivalent to 38% of the 734 practices included in the analysis from 2006 to 2016, and 70% of the 398 practices contributing data in 2016). Over this period, 22.5% of practices remained in the same anticoagulant prescribing quintile; 59.1% remained in the same or adjacent quintile (online supplementary figure 3). Linear-weighted κ=0.10 (95% CI 0.02 to 0.19), indicating poor agreement in practice prescribing performance over time.
Discussion
Age–sex standardised prevalence of diagnosed AF increased by 50% between 2000 and 2016 to 3.3% in those aged ≥35 years. AF prevalence recorded in 2015/2016 Quality and Outcomes Framework (QOF, a scheme to financially incentivise chronic disease management) data is around 3.1%i of adults aged ≥35 years.24 25 As this study use a wider range of clinical codes for AF, a slightly higher prevalence in the study data is to be expected.26 The increase in recorded prevalence may be partially due to improved identification and increased survival of patients with AF. There may also be an increased incidence of diagnosed AF over the study period, particularly patients aged ≥75 years.27
The proportion of eligible patients with AF (CHA2DS2-VASc≥1 and male or ≥2 and female) treated with anticoagulants has doubled over 17 years with an increase in the rate of change after 2011. This corresponds to a change in European guidelines to recommend the treatment of moderate-risk to high-risk AF patients with anticoagulants rather than antiplatelets10 as well as a change in QOF to incentivise prescribing of anticoagulants.28 29 Changes in the guidelines and QOF may also explain the substantial drop in antiplatelet prescribing observed after 2011. There is a further slight increase in prescribing rate between 2013 and 2015, most likely due to the recent introduction of CHA2DS2-VASc as the scoring system in QOF.8 22 It is possible that the continuing increase in prescribing rates may also be influenced by the introduction of a wider range of anticoagulant medication options (NOACs).
The proportions treated in the 2007 to 2010 THIN data are very similar to those reported in an analysis of QResearch primary care data, comprising data from practices using EMIS software, from 2007 to 2010.13
In 2016, over three-quarters of high-risk patients were prescribed anticoagulants, although less than half of patients with moderate stroke risk were treated. Anticoagulation rates in high-risk patients are approaching the highest rates reported in European studies.18 19 The proportion of ineligible patients (CHA2DS2-VASc=0 in males or 1 in females) prescribed anticoagulants halved over the study period to around 10%; much higher proportions have been reported internationally, although these studies are now several years old and rates are likely to have changed.18 19 30 31
There is substantial variation in prescribing performance between practices, suggesting that in any future interventions aimed at improving treatment rates, it may be beneficial to target more poorly performing practices. However, there is some evidence of inconsistency in individual practice prescribing performance over time: three-fifths of practices maintained similar performance levels between 2006 and 2016, while two-fifths showed a marked decline or improvement relative to other practices.
Strengths and limitations
This analysis was performed in a large general practice dataset which is generalisable to the UK population; it is routine clinical data and is therefore the information which general practitioners use for clinical decision-making. AF diagnosis was often corroborated in the patient records, although it was not possible to confirm all AF diagnoses; however, in a sample of 131 patients with AF diagnosed in UK primary care in 2006, 84% were found to have either a primary or secondary care ECG confirmation of their diagnosis.32 Care was taken to exclude patients with ‘AF resolved’. Paroxysmal, persistent and permanent AF were not distinguished, which may have led to a slight overestimate of the point prevalence of AF.
Some anticoagulated patients may be omitted if they are managed entirely in hospital, and treatment rates may therefore be underestimated. However, this is attenuated by the inclusion of clinical codes for anticoagulant/international normalised ratio monitoring, in addition to prescription information, in the definition of anticoagulant use; furthermore, most anticoagulants are prescribed in primary care, and any underestimation is therefore likely to be small. Similarly, some patients may obtain over-the-counter aspirin without this being recorded in their medical records, although a clinical code for over-the-counter aspirin use exists and was included in the analysis.
The study is a cross-sectional analysis investigating treatment rates at specific time points, and does not, therefore, include information on treatment adherence or persistence. However, of the patients who had a prescription for anticoagulants within 90 days prior to the census date, 90.0% (increasing from 85.3% in 2000 to 92.5% in 2016) also had a prescription 91 to 180 days prior to the census date (two or more consecutive prescriptions).
Most variables were defined by the presence of relevant clinical codes in the primary care record. Diagnoses which are part of the QOF assessment are likely to be well recorded for most/all of the study period; clinically significant conditions, such as major bleed, which have important implications for prescribing of drugs other than anticoagulants are also likely to be well recorded; however, recording of other medical conditions may be incomplete.
Contraindications were defined in accordance with Medicines and Healthcare products Regulatory Agency and NICE guidance33 34; however, in some conditions, there is evidence to suggest that the reduced stroke risk associated with anticoagulation may offset the risk of adverse events such as bleeding.35 36
Conclusions
Prevalence of diagnosed AF in the UK is increasing, in all age groups and in both sexes. The use of anticoagulants in patients with AF has improved greatly over the past 17 years, with a doubling in the proportion of eligible patients treated alongside a halving of treatment of ineligible patients. There remains scope for improvement in patients at moderate risk, particularly in the general practices with the lowest prescribing rates.
Key messages
What is already known on this subject?
Atrial fibrillation (AF) is associated with a substantial increase in risk of stroke, but anticoagulant prophylaxis reduces this risk by about two-thirds.
Current prevalence and treatment rates of AF in the UK as well as changes in recent years are not known.
What might this study add?
Between 2000 and 2016, age–sex standardised AF prevalence increased from 2.02% to 3.29%.
Over the same period, the proportion of patients with AF prescribed anticoagulants increased from 35.4% to 75.5% in those with high stroke risk and from 32.8% to 47.1% in those with moderate stroke risk. In patients with low stroke risk, the proportion decreased from 19.9% to 9.7%.
How might this impact on clinical practice?
There remains scope for improvement in the treatment of patients with AF, in particular those with moderate risk of stroke.
References
Footnotes
↵i Age-specific prevalence data were not available in QOF. In Office for National Statistics data for England, 56% of the population are aged 35 years and above; almost all AF cases will be in this population. Therefore, approximate AF prevalence in those aged 35 and above=overall AF prevalence/56% = 1.71/0.56=3.1%.
Contributors TM had the original idea for the study. NJA, RR and TM designed the study. RR undertook data extraction. NJA designed and performed the analysis. KN validated the data extraction and analysis. NJA wrote the first draft of the paper, which was revised in collaboration with TM, KN and RR.
Funding NJA and TM are funded by the NIHR Collaborations for Leadership in Applied Health Research and Care West Midlands initiative.
Disclaimer This paper presents independent research and the views expressed are those of the author(s) and not necessarily those of the NHS, the NIHR or the Department of Health.
Competing interests KN has received personal fees from Sanofi and a grant from AstraZeneca outside the submitted work.
Patient consent Not required.
Ethics approval Research carried out using THIN data was approved by the NHS South-East Multicentre Research Ethics Committee (MREC) in 2003, subject to independent scientific approval. Approval for this analysis was granted by the Scientific Review Committee (for the use of THIN data), SRC reference number 15THIN021.
Provenance and peer review Not commissioned; externally peer reviewed.