Article Text

Abstract
Objective To compare prospectively the prognostic accuracy of a 50% decrease in ST segment elevation on standard 12-lead electrocardiograms (ECGs) recorded at 60, 90, and 180 minutes after thrombolysis initiation in acute myocardial infarction.
Design Consecutive sample prospective cohort study.
Setting A single coronary care unit in the north of England.
Patients 190 consecutive patients receiving thrombolysis for first acute myocardial infarction.
Interventions Thrombolysis at baseline.
Main outcome measures Cardiac mortality and left ventricular size and function assessed 36 days later.
Results Failure of ST segment elevation to resolve by 50% in the single lead of maximum ST elevation or the sum ST elevation of all infarct related ECG leads at each of the times studied was associated with a significantly higher mortality, larger left ventricular volume, and lower ejection fraction. There was some variation according to infarct site with only the 60 minute ECG predicting mortality after inferior myocardial infarction and only in anterior myocardial infarction was persistent ST elevation associated with worse left ventricular function. The analysis of the lead of maximum ST elevation at 60 minutes from thrombolysis performed as well as later ECGs in receiver operating characteristic curves for predicting clinical outcome.
Conclusion The standard 12-lead ECG at 60 minutes predicts clinical outcome as accurately as later ECGs after thrombolysis for first acute myocardial infarction.
- myocardial infarction
- thrombolysis
- ST segment elevation
Statistics from Altmetric.com
The aim of thrombolysis in acute myocardial infarction (AMI) is early and complete myocardial reperfusion.1 Incomplete or delayed reperfusion is associated with an increased risk of death and left ventricular dysfunction.1 TIMI grade 3 flow in the infarct related coronary artery is only achieved in 54% of patients by 90 minutes with front loaded tPA and in 31% of patients receiving streptokinase.2 While the choice of thrombolytic may change the outcome many patients have suboptimal reperfusion after standard thrombolytic regimens. While there is no proved advantage in routine post-thrombolytic coronary angiography after thrombolysis3 rescue therapy may benefit a proportion of patients with suboptimal reperfusion4 ,5 provided they can be identified sufficiently early for myocardial salvage to take place. Immediate post-thrombolytic coronary angiography to identify high risk patients is not a practical option for most district general hospitals, nor is it desirable for all patients.6Therefore a practical non-invasive marker of reperfusion is required to identify those patients who might benefit from rescue strategies.
The post-thrombolytic electrocardiogram (ECG) has shown promise as a non-invasive marker of reperfusion. Previous studies have shown an association between early resolution of ST elevation after thrombolysis and improved coronary patency7-10 and clinical outcome9 11–13 but its practical value as a prognostic marker remains controversial. Data are lacking regarding the predictive value of ECGs recorded within 90 minutes of thrombolysis, which is the period when early prognosis is largely determined.2 Continuous ST segment monitoring is useful in predicting coronary artery patency 60 to 90 minutes after initiation of thrombolysis10 ,14 but its application in clinical practice is restricted by its technical complexity8 ,15(up to 40% of recordings may be unsatisfactory) and it is of unconfirmed value predicting clinical outcome. Early angiographic studies of thrombolysis suggested that most successful reperfusions occur within 60 minutes of thrombolysis,16 which, in combination with data from continuous ST monitoring, strongly suggests that the 12-lead ECG at 60 minutes could be used to predict clinical outcome. We therefore compared the accuracy of the 60 minute ECG with 90 minute and 180 minute ECGs for predicting 30–36 day clinical outcome.
Methods
PATIENTS
Eligible patients received thrombolysis within 12 hours of a first AMI. All had chest pain for 30 minutes or greater and ST elevation in two or more leads on a standard 12-lead ECG (0.1 mV limb leads, 0.2 mV chest leads). There was no age limit and the conventional contraindications to thrombolysis were observed.17 Streptokinase (1.5 MU intravenously over 60 minutes) was given unless the patient was hypotensive on presentation (systolic blood pressure < 90 mm Hg) or where streptokinase intolerance or allergy was possible. Intravenous front loaded tPA17 was given in these circumstances. Patients whose ECG had an uninterpretable ST segment were excluded. Conventional post-infarction care was given in all cases and was not influenced by any additional ECGs recorded.
ELECTROCARDIOGRAPHIC ANALYSIS AND COAGULATION STATUS
A baseline 12-lead ECG was recorded immediately before initiation of thrombolysis and at 60, 90, and 180 minutes thereafter. The ST segment was measured by calliper at 80 ms beyond the J point. The lead of maximum ST elevation was determined from the baseline ECG and used for subsequent measurements. ST segment deflection at 60, 90, and 180 minutes was compared with the baseline ECG. Sum ST elevation was also calculated by adding together the ST elevation for all leads other than aVr. Satisfactory standard 12-lead ECG data were obtained in 93% of patients in this study. AMI were categorised as anterior if maximum ST elevation occurred in leads V1 to V4; inferior if maximum ST elevation occurred in II, III or aVF; lateral if maximum ST elevation occurred in I, aV1, V5 or V6. The key values for analysis were 50% reductions in ST segment elevation in the chosen lead or in sum ST elevation compared with baseline. A 50% fall in ST segment elevation is a well validated marker of coronary patency8 ,10 ,18 ,19 and, particularly for single lead, is simple to measure. Plasma fibrinogen was estimated 60 minutes after initiating thrombolysis.
OUTCOMES
Patients were followed up for 36 days and the cause of any death was sought from hospital records or the general practitioner record. Patients were excluded if they suffered non-cardiac death or the cause of death was unknown. Follow up was complete for all patients.
LEFT VENTRICULAR (LV) SIZE AND FUNCTION
LV size and function was determined using quantitative two dimensional echocardiography,20 which has previously been used to quantify LV size and function after myocardial infarction.21 ,22 ECGs were performed by two experienced operators (IFP, MF) using a Hewlett-Packard Sonos 1500 echocardiography machine. Two mutually perpendicular long-axis planes through the left ventricle were obtained from a single apical position. The end-systolic and end-diastolic endocardial borders were traced and measured. The volumes were calculated using a method of disks algorithm and averaged for the two views over three consecutive three cardiac cycles. LV volume indices were derived using estimated body surface areas. The LV ejection fraction (LVEF) was calculated from these volumes. An LVEF of < 0.4 was chosen to indicate poor LV systolic function.
STATISTICS
Categorical data were compared by the χ2 test. Continuous data were log10 transformed to provide a normal distribution, presented as geometric mean (geometric SD) and compared by Student’s t test. Receiver operating characteristic (ROC) curves were constructed for ECGs at each of the study times against the dichotomous variables cardiac death and LVEF < 0.4. Areas under ROC curves were calculated using the trapezoidal method and compared using the method of Hanley and McNeill,23 which takes account of intrasubject correlation of repeated ECG data.
Results
BASELINE CHARACTERISTICS
Of the 332 consecutive patients with AMI, 262 (79%) underwent thrombolysis. Forty seven had previous AMI and were not enrolled in this trial. Two hundred and fifteen patients were screened and 20 were excluded: 14 because the baseline ECG or all subsequent ECGs had uninterpretable ST segments because of conduction abnormalities. Five patients were excluded because of non-cardiac death (one cerebral infarction, two cerebral haemorrhage, one peripheral embolism, one pulmonary tuberculosis), one because of death of unknown cause. Five otherwise suitable patients did not have appropriately timed ECGs recorded and could not be enrolled, including one who died before the 60 minute ECG. One hundred and ninety patients who received thrombolysis for first AMI were therefore studied. Table 1 summarises their baseline characteristics.
Patient characteristics
CLINICAL OUTCOME
Echocardiography was carried out at a median time of 36 days after AMI (range 25–51). Twenty two patients (11.6%) suffered cardiac death within 36 days. Of the 168 patients alive at follow up 167 (99.4%) attended for echocardiographic examination and satisfactory images were obtained in 160. Table 2 gives the geometric means for LV dimensions and LVEF. Nearly 41% of those with a satisfactory echo image had an LVEF below 0.4. Mortality was; 11% for men v 12.5% for women (p = NS); 20.8% for patients > 75 years v10.2% for patients ⩽ 75 year (p = 0.13); 13.1% for anterior MIv 10.2% for inferior MI (p = NS); 42.9% for patients with diabetes mellitus v 9.2% for patients without (p < 0.002); 15.6% for patients with hypertension v10.9% for patients without (p = NS). Smokers were at lower risk: smoker mortality (3.4%) v previous smokers (11.4%)v non-smokers (24.2%; p = 0.001). Although deaths that could not be attributed to a cardiac cause were excluded inclusion of these deaths in the analysis did not affect the statistically significant association between ST segment change and clinical outcome.
Clinical outcome up to 36 days
ST SEGMENT RESOLUTION
Figure 1 shows the proportion of patients with anterior and inferior MI who achieved a 50% fall in single lead or sum ST segment elevation at each time after thrombolytic initiation. Forty one per cent of all patients achieved a 50% fall in maximal lead ST elevation within 60 minutes and 66% by 180 minutes. For sum ST the proportion achieving a 50% fall each time point was consistently smaller. Analysis of these data by infarct site shows that a significantly lower proportion of patients with anterior MI achieve a 50% decrease in ST elevation compared with inferior MI at 60 minutes and 90 minutes but not at 180 minutes. The pattern was the same for sum ST elevation.
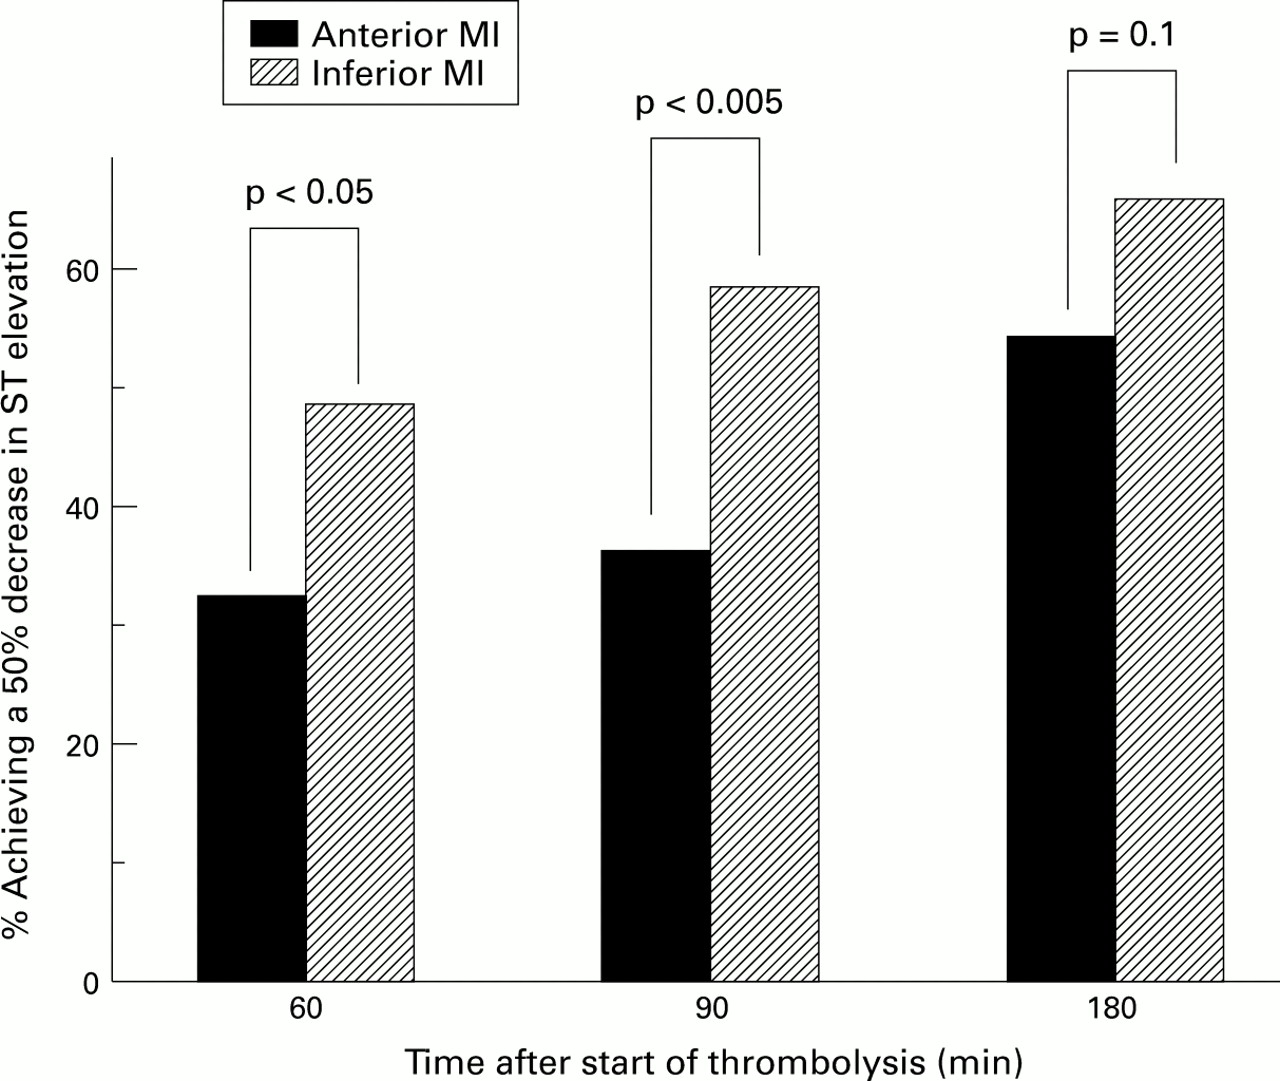
Resolution of ST elevation in anterior and inferior MI within 180 minutes of initiating thrombolysis.
CLINICAL OUTCOME IN RELATION TO RESOLUTION OF ST ELEVATION
Table 3 shows the relation between 50% resolution of ST elevation and cardiac mortality and LVEF < 0.4. Patients with 50% resolution of ST segment in the lead of maximal ST elevation by 60, 90 or 180 minutes experienced lower cardiac mortality by 36 days than those with persistent ST elevation. This was also seen in sum ST analysis. The 60 minute maximal lead ECG predicted cardiac death with the highest sensitivity (95.2%) and negative predictive value (98.7%) but with low specificity (45.8%). Sum ST elevation predicted cardiac mortality but with lower sensitivity, specificity, positive and negative predictive values compared with the equivalent maximal lead measurement (data not shown). A 50% decrease in maximal lead ST elevation identified patients with a lower prevalence of LVEF < 0.4 at 36 days. The 60 minute ECG had the highest sensitivity for this clinical outcome. Sum ST and maximum lead ST data were essentially equivalent (60 minute sum ST data 78% sensitivity and 46% specificity for LVEF < 0.40).
Relation between achieving a 50% resolution in ST elevation and 36 day clinical outcome
A clear relation between the resolution of ST elevation and LV volume and function was seen (table 4). Resolution of ST elevation was associated with higher LVEF, smaller LVESVI, and smaller LVEDVI compared with persistent ST elevation. This suggests that greatest preservation of LV function is achieved by the earliest reperfusion.
Left ventricular size and function according to resolution of ST segment elevation and infarct site
ANALYSIS ACCORDING TO INFARCT SITE
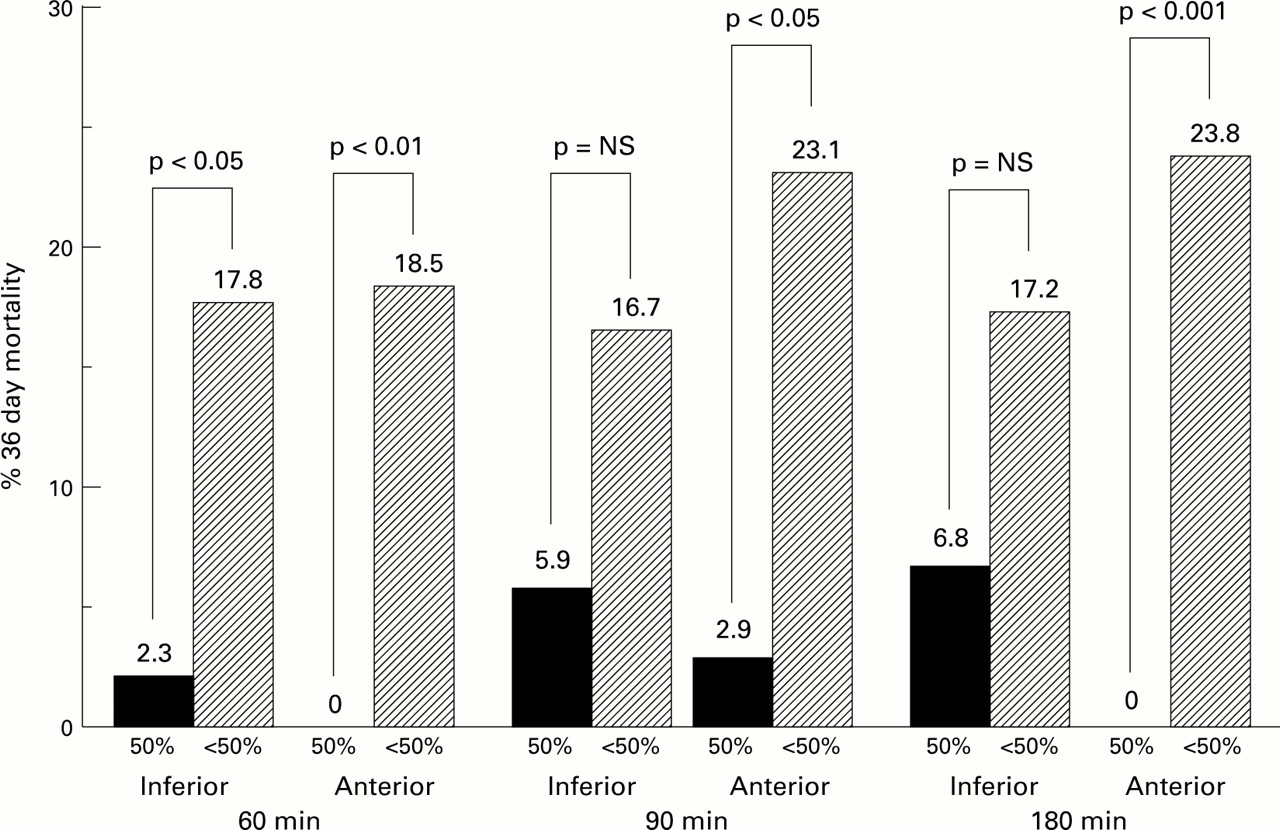
Failure of maximal lead ST segment elevation to resolve by 60, 90 or 180 minutes after onset of thrombolysis was associated with a significantly higher mortality at 36 days (fig 2). Significant differences persist to the 180 minute ECG for anterior MI but not for inferior MI. Larger LV volume (LVESVI and LVEDVI) and lower LVEF in anterior MI were associated with persisting ST elevation at 60 and 90 minutes (table 4) but only for LVESVI at 180 minutes. This was true for maximal lead and sum ST elevation but more statistically consistent results were obtained from analysis of maximal lead measurements. Persistent ST elevation at 60, 90 or 180 minutes was not associated with significantly lower LVEF or larger volumes in those patients with inferior MI.

Cardiac mortality at 36 days according to 50% ST segment change in anterior and inferior myocardial.
RECEIVER OPERATING CHARACTERISTIC CURVES AND CLINICAL OUTCOME
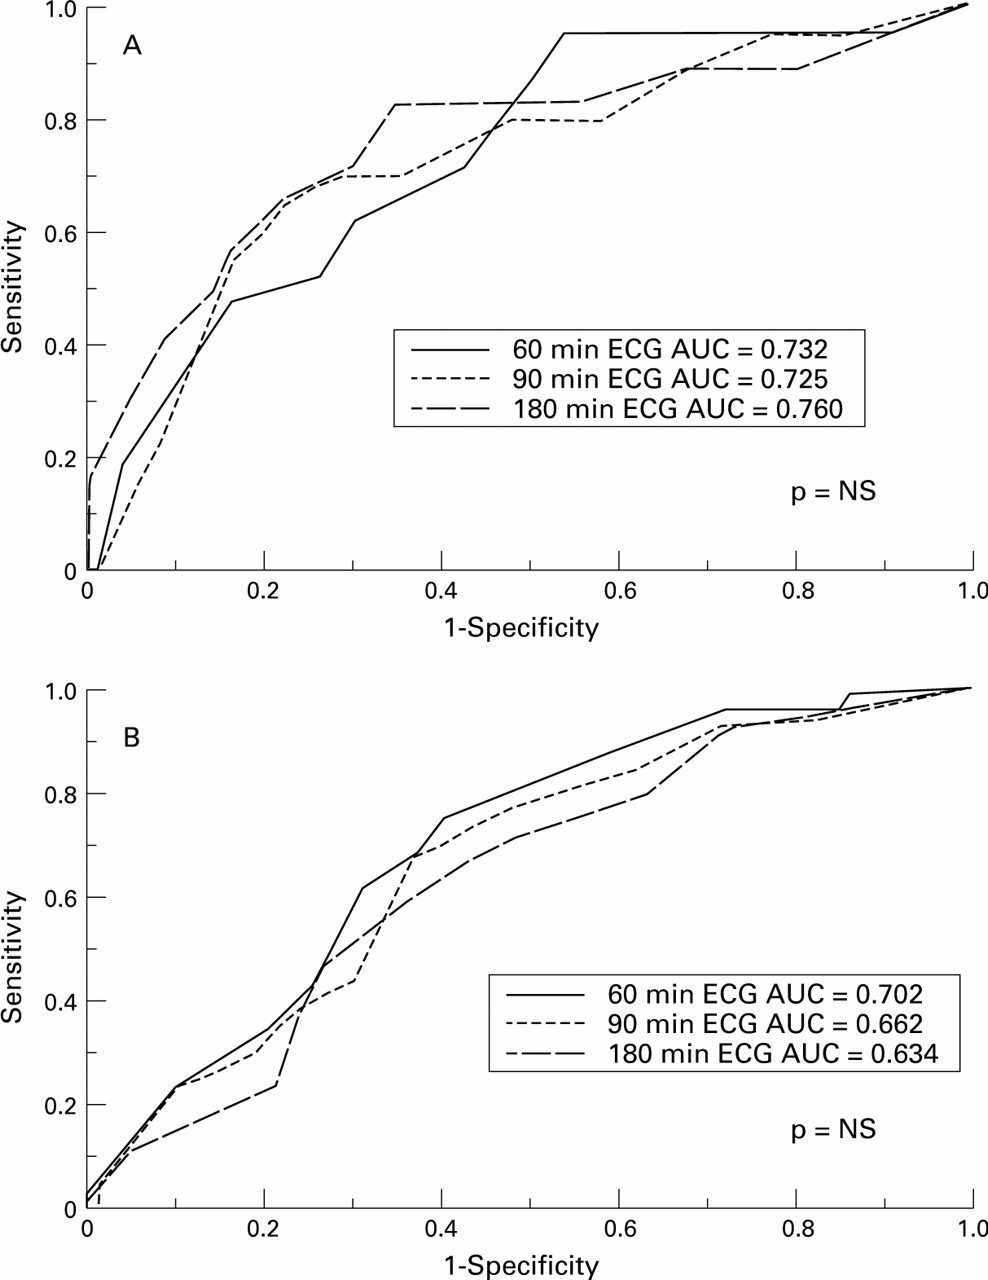
ROC curves are shown for the prediction of cardiac death and LVEF < 0.4 based upon the lead of maximum ST elevation (fig 3) for each ECG time. There was no statistically significant difference between the areas under the ROC curves for the three ECG times. Similar findings occurred with data from sum ST leads for each time point: the area under ROC curves for cardiac mortality was 0.707 for 60 minute ECG, 0.718 for 90 minute ECG, and 0.665 for 180 minute ECG. For predicting LVEF < 0.4 area under ROC curve was 0.657 at 60 minutes, 0.626 at 90 minutes, 0.619 at 180 minutes. The 60 minute ECG, therefore, performs at least as well in ROC analysis as later ECGs and maximal lead at least as well as sum ST elevation in predicting cardiac mortality and LVEF < 0.4 after thrombolysis.
ROC curves of clinical outcome in terms of (A) cardiac mortality and (B) poor LV systolic function (LVEF < 0.4) at 36 days.
RESPONSE TO THROMBOLYSIS ACCORDING TO PRESENTATION TIME
Time to thrombolysis influenced the proportion of patients achieving a 50% decrease in ST segment elevation at each time point. Comparing the proportions achieving a 50% decrease in ST segment elevation by pain to needle times (PTN) values were: for 60 minute ECG proportion achieving a 50% decrease in single lead ST segment elevation was 46% for PTN of < 4 hours, 28% for PTN of > 4 hours (p < 0.05), 13% for PTN of > 6 hours (p < 0.05 v< 4 or < 6 hours). For 90 minute ECG proportion achieving a 50% decrease in single lead ST segment elevation was 55% for PTN of < 4 hours, 26% for PTN of > 4 hours (p < 0.05), 17% for PTN of > 6 hours (p < 0.05 v < 4 or < 6 hours). For 180 minute ECG proportion achieving a 50% decrease in single lead ST segment elevation was 66% for PTN of < 4 hours, 46% for PTN of > 4 hours (p < 0.05), 24% for PTN of > 6 hours (p < 0.05 v< 4 or < 6 hours).
Discussion
This study is the first to prospectively and comparatively assess the predictive accuracy of very early (60 minute) standard 12-lead ECGs against post-infarction clinical end points and later ECGs.
POPULATION STUDIED
In this unselected, consecutive series of patients the use of thrombolysis, median symptom to treatment time, and presentation to treatment time was comparable to GUSTO17 and ISIS-424 but cardiac mortality and overall mortality were higher. Mortality in this study was typical of unfiltered patients21 rather than those selected for trials. This study is therefore a more valid assessment of the predictive value of ST segment change in routine practice than previous studies, which tended to be small7 ,9 ,10 ,18 or based on patients in thrombolytic and coronary intervention trials.9 ,11-13 ,26
The higher than expected mortality in the inferior MI group (10.2%) may be because 85% of inferior MI in this study had poor prognostic ECG features, such as ST elevation in the lateral chest leads (47%) or precordial ST depression (66%) (28% have both), on their admission ECG, which suggests a high prevalence of multi-vessel coronary disease.27 This may also explain the high overall mortality and the high prevalence of LVEF < 0.40 at 36 days compared with earlier studies, for example GISSI-2.28 Low cardiac mortality was seen in current smokers in this study compared with ex-smokers and non-smokers. This has been observed before29 ,30 but remains incompletely explained.
ECG CRITERIA FOR SUCCESSFUL THROMBOLYSIS
Three previous studies have shown a positive association between early (three to four hours) resolution of sum ST segment elevation and lower mortality and higher LV function.11-13Unfortunately almost half the total deaths had occurred before the study ECG was recorded. In this study four patients died despite a 50% decrease in ST elevation by 90 minutes in the lead of maximum ST elevation. Of these two suffered re-infarction and one re-elevation of ST segment on the 180 minute ECG. This is not surprising as ST resolution suggests restored vessel patency, which then has the potential to become re-occluded. Although continuous ST segment monitoring may detect fluctuations in ST elevation soon after thrombolysis that could be missed on standard ECGs7 ,8 ,31the strong association between standard ECG measurements and clinical outcome in this study suggests this did not significantly interfere with the present analysis.
PEDICTION OF OUTCOME BY INFARCT
Site ST segment resolution predicted cardiac mortality and LV function after anterior MI but only the 60 minute ECG was associated with cardiac mortality after inferior MI. This result is also consistent with the theory that reperfusion within the first 60 minutes is particularly important although the lack of statistical significance in mortality data from the 90 and 180 minute ECGs may be a type 2 statistical error.
LVEF after inferior MI was significantly better than after anterior MI and LV volumes were smaller. No association was seen after inferior MI between ST resolution and LV size and function. Previous studies do not give consistent results on this point.12 ,26
Generally inferior MI may jeopardise less myocardium than anterior MI but in this study there were also fewer patients with anterior MI who achieved 50% ST resolution at 60 and 90 minutes compared with inferior MI. This was also observed in the ISAM12 and INJECT13 studies, which suggests that thrombolysis may be less effective in anterior than inferior MI. For streptokinase treatment this may relate to fibrinolysis itself because fewer patients with anterior MI achieved a systemic fibrinolytic state 60 minutes after streptokinase (fibrinogen < 0.4 g/dl) than patients with inferior MI: 59.5% compared with 76.1% (p < 0.05).
RECEIVER OPERATING CHARACTERISTIC CURVES
The ROC curve is a useful method of evaluating and comparing the accuracy of prognostic markers.32 ,33 We used a method of comparison that corrected for the correlation between ECGs recorded at different times on the same patient.23 The area under the ROC curve is the proportion of correct predictions of a specified outcome that would be made using the prognostic marker being assessed.32 For example, in this study cardiac death would be correctly predicted by the 60 minute maximal lead analysis in 73% of cases. There was no statistically significant difference between the ROC areas derived from our data and we calculate that more than 2000 patients would be required to detect a difference between these areas at 5% significance with 80% power. This supports our hypothesis that the 60 minute ECG is at least as accurate in predicting clinical outcome as later ECGs. In addition we would recommend maximal lead ST measurement over sum ST measurement as it has equal or better accuracy in predicting outcome and is simpler to use.
PREDICTION OF OUTCOME—SENSITIVITY AND SPECIFICITY
When constructing a ROC curve multiple values of ST segment are plotted but in practice it is probable that only one will be used to separate patients into prognostic groups. The sensitivity and specificity of that value must then be considered. There is a reciprocal relation between sensitivity and specificity for outcome prediction at the different ECG times. Sensitivity is highest for the earliest ECG and decreases with time whereas the specificity increases. Sensitivity and specificity also vary depending on the ST elevation cut off point chosen—as the cut off point increases so does the sensitivity of predicting a poor outcome while the specificity decreases. This is also true for other studies.12 ,13Furthermore the number of patients who reperfused (achieving 50% ST resolution) increases with time. Therefore to identify the maximum number of patients at high risk an early ECG with high cut off point (that is, a large % fall in ST segment elevation) should be chosen but this has the disadvantage of low specificity. In this study 41% achieve a 50% decrease in ST elevation in the lead of maximum ST elevation by 60 minutes and have a 36 day mortality of only 1.3%. This leaves 59% of patients identified as high risk. A later ECG could be taken to identify a smaller group of patients at higher risk (at 180 minutes 40% of patients have ST elevation > 50% of baseline with 20.8% cardiac mortality) but some high risk patients will be missed and the opportunity for successful rescue treatment may be diminishing, indeed some patients may already have died. A lower cut off point could be taken at 60 minutes, for example in our study, 20% of patients failed to achieve any decrease in maximal lead ST elevation. Their mortality was 27% compared with 7% among those with some degree of ST decrease (p < 0.001).
CONCLUSIONS
Using simple measurements of ST segment elevation we were able to identify high and low risk groups of patients as early as 60 minutes after initiating thrombolysis in an unselected group of patients with first AMI.
The 60 minute ECG predicted outcome as well as later ECGs in ROC curve analysis. Single lead data proved a simple and universally applicable marker that could predict outcome at least as accurately as more time consuming measurements of sum ST changes. The 60 minute ECG prediction of clinical outcome emphasises the importance of early reperfusion and identifies high risk patients who may benefit from rescue reperfusion therapy. Patients in whom there is failure of ST segment elevation to decrease at all by 60 minutes and patients who reinfarct after early ST segment resolution seem to warrant the most aggressive treatment.
Acknowledgments
We are very grateful for the support and encouragement of all hospital staff and patients involved in this work.