Article Text

Abstract
Objective To assess the degree of agreement between impedance cardiography, using the NCCOM3-R7 device, and the gold standard—the dye dilution method—both under basal conditions and after stimulation of cardiac output.
Patients 35 paired measurements in five healthy male volunteers.
Interventions To obtain higher levels of cardiac output, cardiac performance was stimulated with a dopamine infusion.
Results In 35 paired measurements, the mean of all the impedance values was higher than that of the dye dilution values, at 10.2 v 7.4 l/min (p < 0.0001). The mean discrepancy between the two methods was 3.3 l/min, and the mean bias −2.9 l/min, with limits of agreement of −9.0 and 3.2 l/min. A change in cardiac output could not adequately be predicted by the NCCOM3-R7. In 20 of 25 measurements obtained during continuous intravenous dopamine infusions there was a rise in dye dilution cardiac output (range 0.2 to 5.9 l/min). Neither the magnitude nor the direction of the change in dye dilution values corresponded with the change measured by impedance cardiography. The mean discrepancy here between the two methods was 1.8 l/min, and the mean bias −0.8 l/min, with limits of agreement of −4.9 and 3.3 l/min.
Conclusions In healthy volunteers, impedance cardiography with NCCOM3-R7 is inadequate for assessing cardiac output when compared with the dye dilution method.
- cardiac output
- impedance cardiography
- dye dilution
Statistics from Altmetric.com
An accurate and reliable technique for measuring cardiac output would be of considerable value both in research and in clinical medicine. Ideally, such a technique should be non-invasive, versatile, reliable, cost-effective, and easy to use.1 The gold standard for measuring cardiac output still is the dye dilution method. Disadvantages of this method are its invasive character and the impossibility of measuring beat to beat changes.
A popular non-invasive technique that is often used nowadays is the impedance cardiography. Kubicek et al were the first to develop this technique for practical use.2 According to these investigators, stroke volume (SV) can be determined by the equation: SV = r.(L2/Z0 2).(dZ/dt)max.LVET, where r is the resistivity of blood, L is the distance between recording electrodes, Z0 is baseline impedance between the recording electrodes, (dZ/dt)max is the maximum absolute rate of change in the impedance signal for a given beat, and LVET is left ventricular ejection time. Compared with dye dilution cardiac output measurements, White et al reported a small mean difference of 0.1 l/min between the two methods.3Sramek et al proposed an alternative equation, modelling the thorax as a truncated cone rather than a cylinder.4 This equation was later modified by Bernstein.5 This Sramek-Bernstein equation is implemented in the now commonly used non-invasive continuous cardiac output monitor (NCCOM3). This device has been compared with thermodilution,6-32 the Fick method,22 ,26 ,33 ,34 Kubicek’s impedance cardiography,14 ,35 and Doppler echocardiography,18 ,36 ,37 in ICU patients,6-8 ,10 ,14 ,16 ,20 ,24 ,29-31 neonates and children,15 ,33 ,37 healthy subjects,14 ,29 ,34 ,35 ,38 neurological patients,11 surgical patients,12 pregnant women,13 ,17 and cardiovascular (including post-CABG) patients.9 ,18 ,21 ,23 ,25 ,27 ,28 Only two comparative studies with the dye dilution method have been performed, one in children39 and one in adult healthy subjects.29 Both studies used the previous version of the NCCOM3-R7. Moreover, Thomas used the less reliable, non-invasive, earpiece densitometer for measuring the dye29 instead of sampling blood through a peripheral arterial catheter.40 The objective of our study, therefore, was to assess the degree of agreement between impedance cardiography and the dye dilution method using arterial sampling. Because most data concerning the correlation or agreement between the two methods have dealt with cardiac output values in the physiological range, we were also interested to explore the agreement at higher cardiac output levels. Thus the second objective of our study was to investigate whether the NCCOM3-R7 device can identify a change in cardiac output in the same way as the dye dilution method.
Methods
SUBJECTS
Seven healthy male volunteers (mean (SD) age 22 (1.7) years) participated in the study. Two had to be excluded because the central venous catheter could not be adequately positioned in the superior caval vein. The nature and risks of the study were explained to each subject and informed consent was obtained from all. This study had prior approval of the medical ethics committee of the University Hospital Maastricht.
PROTOCOL
In all subjects cardiac output was measured simultaneously by the dye dilution and the impedance technique. Three to five impedance cardiac output measurements were averaged during the period of dye dilution cardiac output measurement (±50 seconds). First, after a steady state period of 15 minutes, basal cardiac output values were measured in duplicate. After these basal measurements, each subject received an intravenous infusion of dopamine (2–6 μg/kg/min) to obtain higher cardiac output values.
CARDIAC OUTPUT MEASUREMENTS
Impedance cardiography
Impedance measurements were obtained with the non-invasive continuous cardiac output monitor model 3, revision 7 (NCCOM3-R7, BoMed Instruments, Irvine, California, USA). This method, which uses changes in transthoracic impedance during cardiac ejection to calculate stroke volume, is described in detail elsewhere.5 In brief, a small sinusoidal current is applied to four electrodes at the base of the neck and inferior aspect of the thorax. A set of four electrodes 5 cm inside the stimulating electrodes record the changing impedance over that area of the thorax. Cardiac output is calculated from the following relation: SV = VEPT.tLVE.(dZ/dt)max/Z0, where SV = stroke volume, VEPT = volume of electrically participating tissue calculated from height and weight, tLVE = left ventricular ejection time, (dZ/dt)max = maximum rate of impedance change during systolic upstroke, and Z0 = baseline thoracic impedance. This method is known as the Sramek-Bernstein method. We used self adhesive electrodes supplied by the manufacturer of the NCCOM3-R7 and positioned them as described. The impedance monitor was set to display cardiac index readings as an average of 16 cardiac cycles. All cardiac index values were transformed afterwards into cardiac output values by multiplying them by with the body surface area of the subjects. In our hands, the variation of repeated impedance measurements was 5%.
Dye dilution method
The principle of dye dilution cardiac output measurement is to inject rapidly a known quantity of dye at one site into the circulatory system and withdraw blood at a distal site for determination of concentration of dye.40 Flow Q (= cardiac output) is calculated from: Q = m/(cA.t), where m = amount of dye injected, cA = mean concentration of dye, and t = time of concentration curve. As dye we used indocyanine green (Cardio-Green®) that we injected in a bolus (5.0 mg; prepared by the manufacturer) through a central venous catheter into the superior caval vein. At the same time arterial blood from the left brachial artery was withdrawn at a fixed rate (37.8 ml/min) by a syringe pump and passed through a cuvette with photoelectric cells to record the dye concentration. When blood with dye passes these cells a typical dye concentration curve is produced by the Nihon Kohden MLC-4200 cardiac output computer. The computer replots the curves in a semilogarithmic manner and then calculates the area under the curve which represents the actual cardiac output. Dye concentration curves were manually checked for accuracy. The agreement between manual and automated measurements in our hands was 98%. Before each cardiac output measurement the apparatus was calibrated. In earlier reproducibility studies we found the variation of repeated determinations to be within 8%.41 The position of the central venous catheter had been checked by x ray before measurements started.
STATISTICAL METHODS
To express the correlation between impedance and dye dilution cardiac output measurements Pearson’s correlation coefficient was calculated. The difference between average impedance cardiac output values and dye dilution cardiac output was tested with the pairedt test. The agreement between impedance cardiac output values and dye dilution cardiac output was assessed by calculating the mean bias, its standard deviation, and the 95% confidence limits of agreement, as described by Bland and Altman.42 The mean discrepancy was calculated as (Σ√[dye dilution − impedance cardiography]2)/n. Changes in cardiac output were calculated as the difference between cardiac output values under continuous intravenous dopamine infusion and the mean baseline value.
Results
Body mass index, as well as basal blood pressures and heart rates, are given in table 1. For each subject, the number of paired cardiac output measurements, ranges in cardiac output, and Pearson’s correlation coefficients are also shown in table 1. In the five subjects a total of 35 paired cardiac output measurements was obtained: 10 under basal conditions and 25 under continuous intravenous dopamine infusion. Blood pressure did not change under dopamine infusion. Heart rate tended to increase, but changes were not statistically significant.
Characteristics of subjects
BASAL CARDIAC OUTPUT VALUES
The Pearson’s correlation coefficient of all 10 paired basal measurements combined was 0.11. When all basal cardiac output values from each subject were averaged, the mean (SD) basal cardiac output was 6.3 (0.8) l/min for dye dilution and 8.8 (3.2) l/min for impedance measurements (p = 0.16). In four cases the NCCOM3-R7 overestimated the dye dilution cardiac output by more than 4.0 (3.2) l/min. In one case it underestimated dye dilution cardiac output by 0.3 l/min.
ALL CARDIAC OUTPUT VALUES
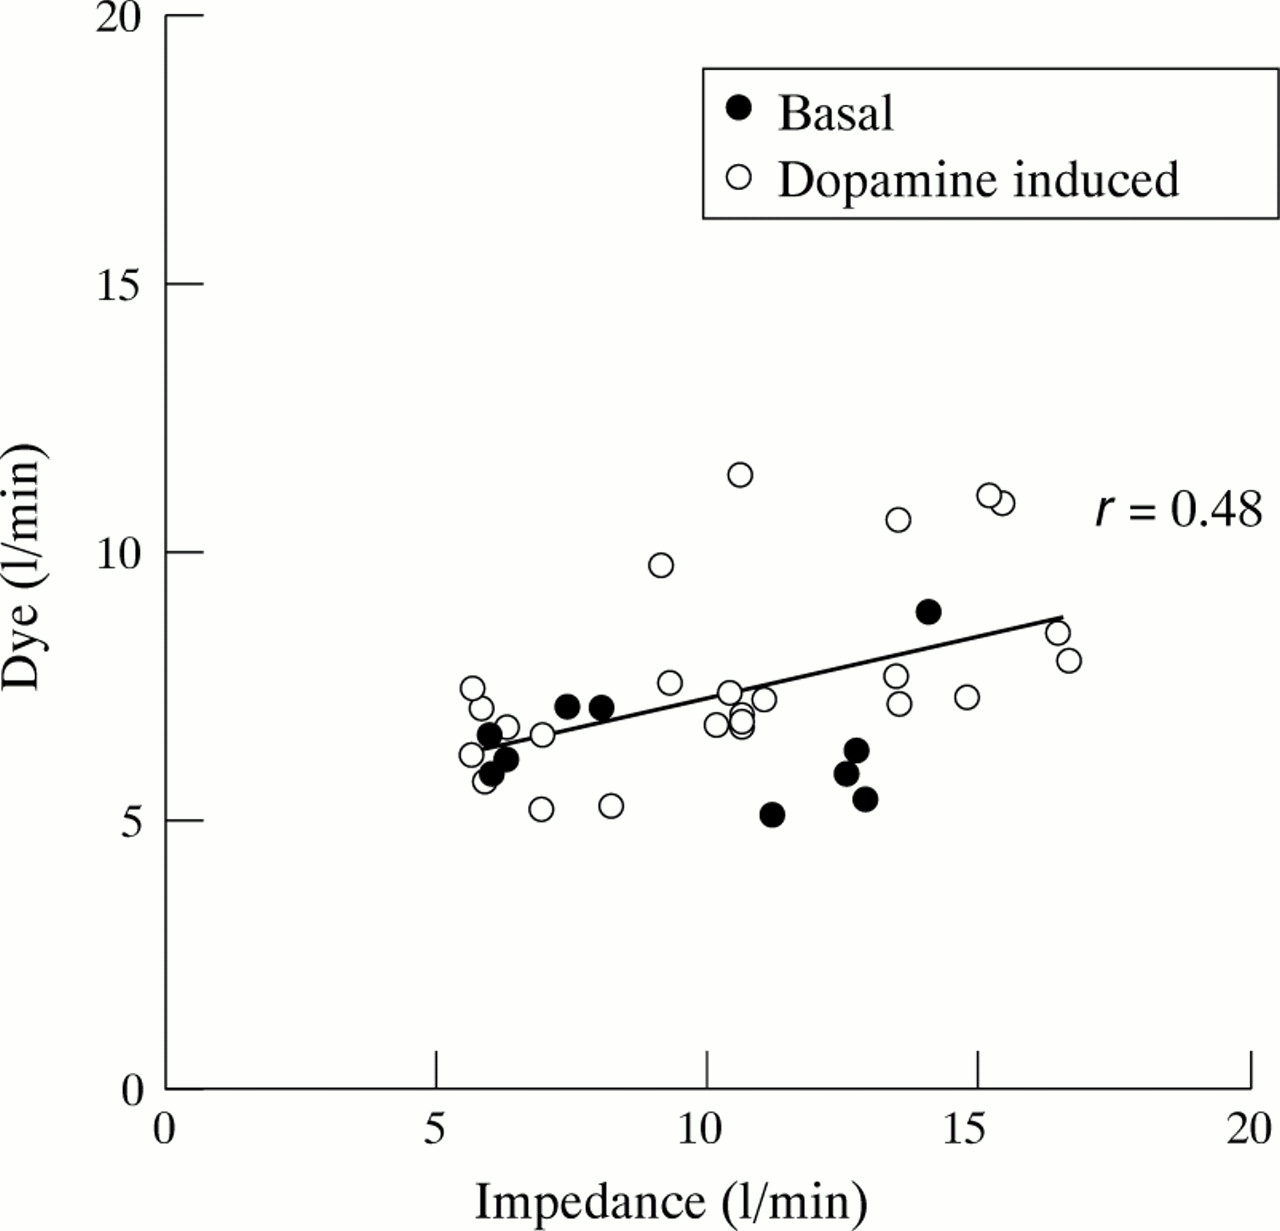
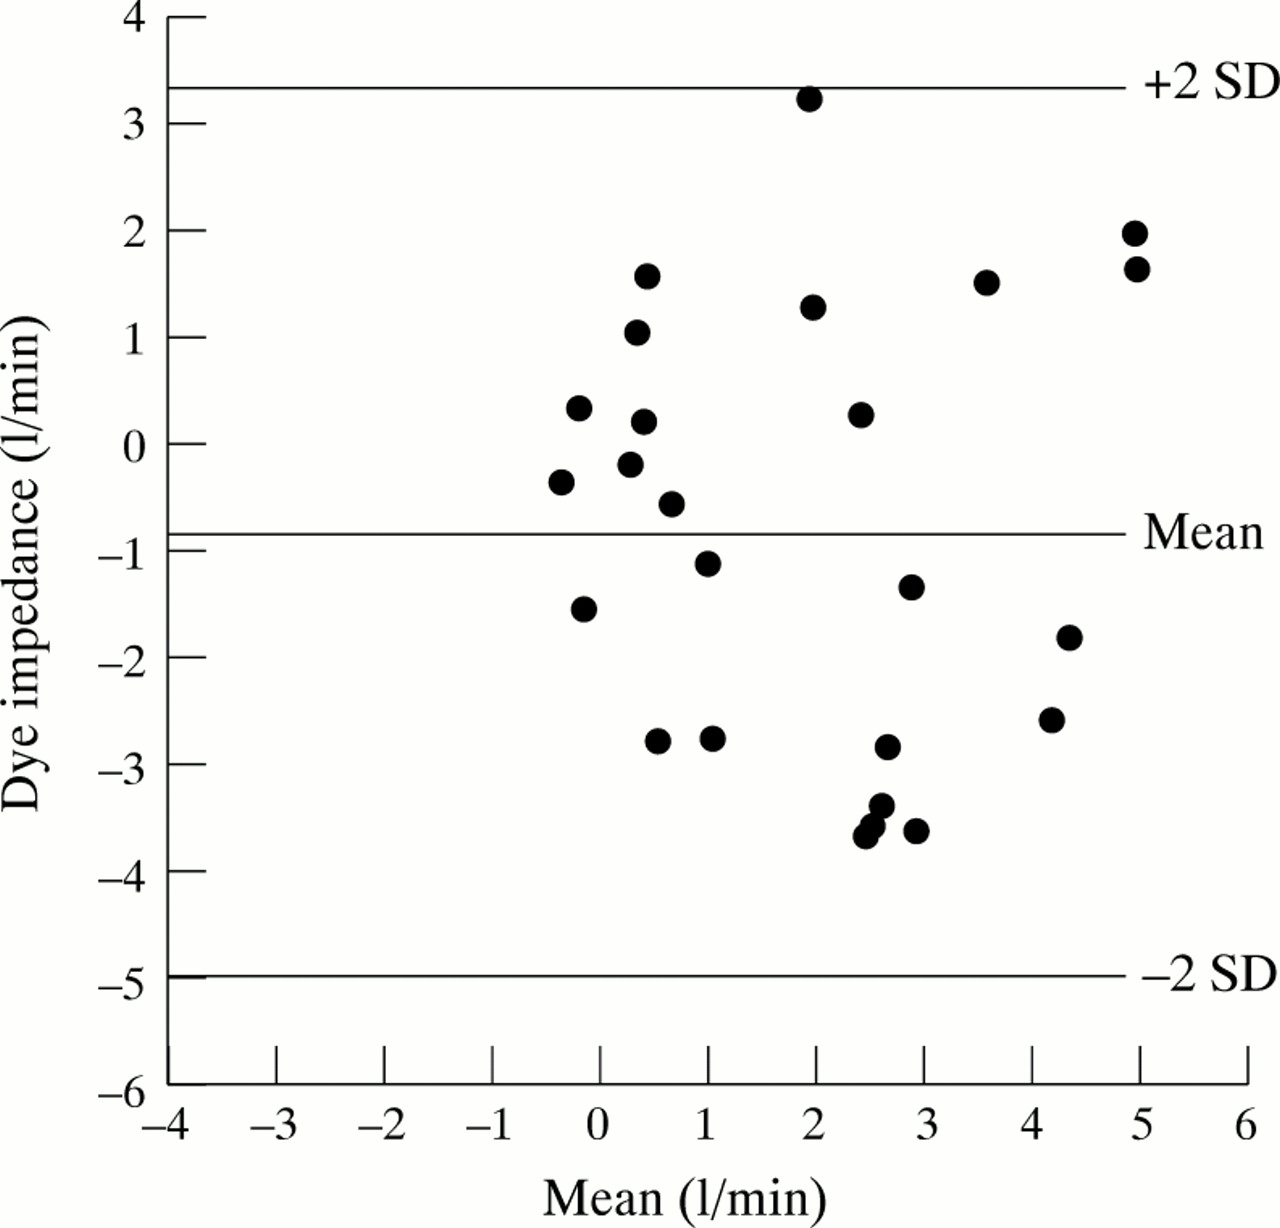
The Pearson’s correlation coefficient of all 35 paired measurements was 0.48 (fig 1). Individual coefficients ranged from −0.01 to 0.81 (table 1). The mean of all impedance cardiac output measurements was 10.2 (3.5) l/min, which was higher (p < 0.001) than the mean dye dilution cardiac output: 7.4 (1.7) l/min. The mean discrepancy between the two methods was 3.3 (2.6) l/min, and the mean bias −2.9 l/min, with limits of agreement of −9.0 and 3.2 l/min (fig 2). The Bland-Altman plot of these data suggests that at higher levels of cardiac output the impedance method progressively overestimated dye dilution values and that the agreement between the two methods is closest at cardiac output values of about 6 to 7 l/min.

All paired measurements (n = 35): Pearson’s correlation coefficient.

All paired measurements (n = 35): Bland-Altman method.
CARDIAC OUTPUT VALUES DURING DOPAMINE INFUSION
In subjects 3 and 5 dye dilution cardiac output did not rise above 8.0 l/min, even with the highest dopamine dose (6 μg/kg/min). Pearson’s correlation coefficient of all 25 paired, dopamine related measurements was 0.56. During dopamine infusion dye dilution cardiac output was 7.7 (1.8) l/min v 10.5 (3.6) l/min for the NCCOM3-R7 (p < 0.001). In 20 out of 25 dopamine related measurements there was a rise in dye dilution cardiac output compared with basal values (range 0.2 to 5.9 l/min). In two cases the NCCOM3-R7 showed a decline in cardiac output where there was actually a rise in dye dilution cardiac output, while in three cases the NCCOM3-R7 showed a rise in cardiac output where there was a decline in dye dilution cardiac output. The mean discrepancy of the relative changes in cardiac output between the two methods was 1.8 l/min, and the mean bias −0.8 l/min, with limits of agreement of −4.9 and 3.3 l/min (fig3).

Changes in cardiac output during dopamine infusion (n = 25): Bland-Altman method.
Discussion
To the best of our knowledge, this report is the first study comparing cardiac output measurements of the NCCOM3-R7 impedance cardiograph with the dye dilution technique. The NCCOM3-R7 impedance cardiograph has several important advantages compared with the dye dilution method: it is non-invasive, easy to use, cost-effective, and it allows continuous monitoring. As was decided in the meeting of a working party of the European Society of Cardiology in 1990 in Beerse (Belgium), however, the gold standard for assessing cardiac output still is the dye dilution method, and newer (non-invasive) methods for measuring cardiac output should be compared with this technique. According to our data the NCCOM3-R7 can overestimate dye dilution cardiac output by 9 (!) litres or underestimate it by more than 3 litres. This lack of agreement is unacceptable, both for clinical practice and for research purposes. Also, the relative change in cardiac output induced by intravenous dopamine infusion could not be adequately followed by the NCCOM3-R7. The discrepancies with the dye dilution method were too large to be tolerable.
Since the first commercial NCCOM became available from BoMed Medical Manufacturing in 1982, several comparative studies have been published. These cannot always be compared easily. A recent review summarised all available clinical studies.43 Overall, 34 studies were reviewed including 708 patients in 13 different patient categories. Most of these studies used earlier versions of the NCCOM3-R7. The NCCOM3-R7 was mostly compared with the thermodilution technique, and the majority of studies used a correlation coefficient to compare methods. Only a few studies applied the appropriate technique for analysing agreement between two methods: bias plot analysis and calculation of mean differences.44 Despite the difficulty in comparing the various studies, it was concluded that estimating cardiac output with impedance cardiography remains controversial. Only two studies compared the NCCOM3 (both using the NCCOM3-R6) with dye dilution.29 ,39 The study by O’Connell et alin children39 also showed poor agreement between the two methods. Nevertheless, by using a modification, the investigators were able to improve the agreement. Thomas29 did not apply the standard procedure for the assessment of dye dilution cardiac output, but rather used the less reliable earpiece densitometer. Like us, he studied five healthy volunteers and found an acceptable mean bias of −0.6 l/min. Except for the difference in methodology, a possible explanation for the discrepancy between his results and ours is the fact that in the study by Thomas resting cardiac output averaged 7.2 l/min, which, according to our data, is close at the point where dye dilution and impedance cardiography correlate best. Nevertheless, with higher cardiac output levels induced by exercise, his impedance data may also differ from −4 to +5 l/min from the dye values.
We can only speculate about the reasons why impedance cardiography fared so badly. However, the implicit assumptions related to this method have not been sufficiently tested in experimental models. The specific resistivity of blood may not be constant, and placement of electrodes may be more critical than has been thought. Finally, the Sramek-Bernstein approach probably causes specific problems, as we found the correlation between dye dilution and impedance cardiography according to Kubicek et al 2 to be much better.3
In conclusion, we found that in healthy volunteers impedance cardiography with the NCCOM3-R7 is inadequate for assessing cardiac output when compared with the dye dilution method.