Article Text

Abstract
Objective To examine the left ventricular regional wall motion abnormality and to evaluate dispersion of this abnormality in patients with long QT syndrome.
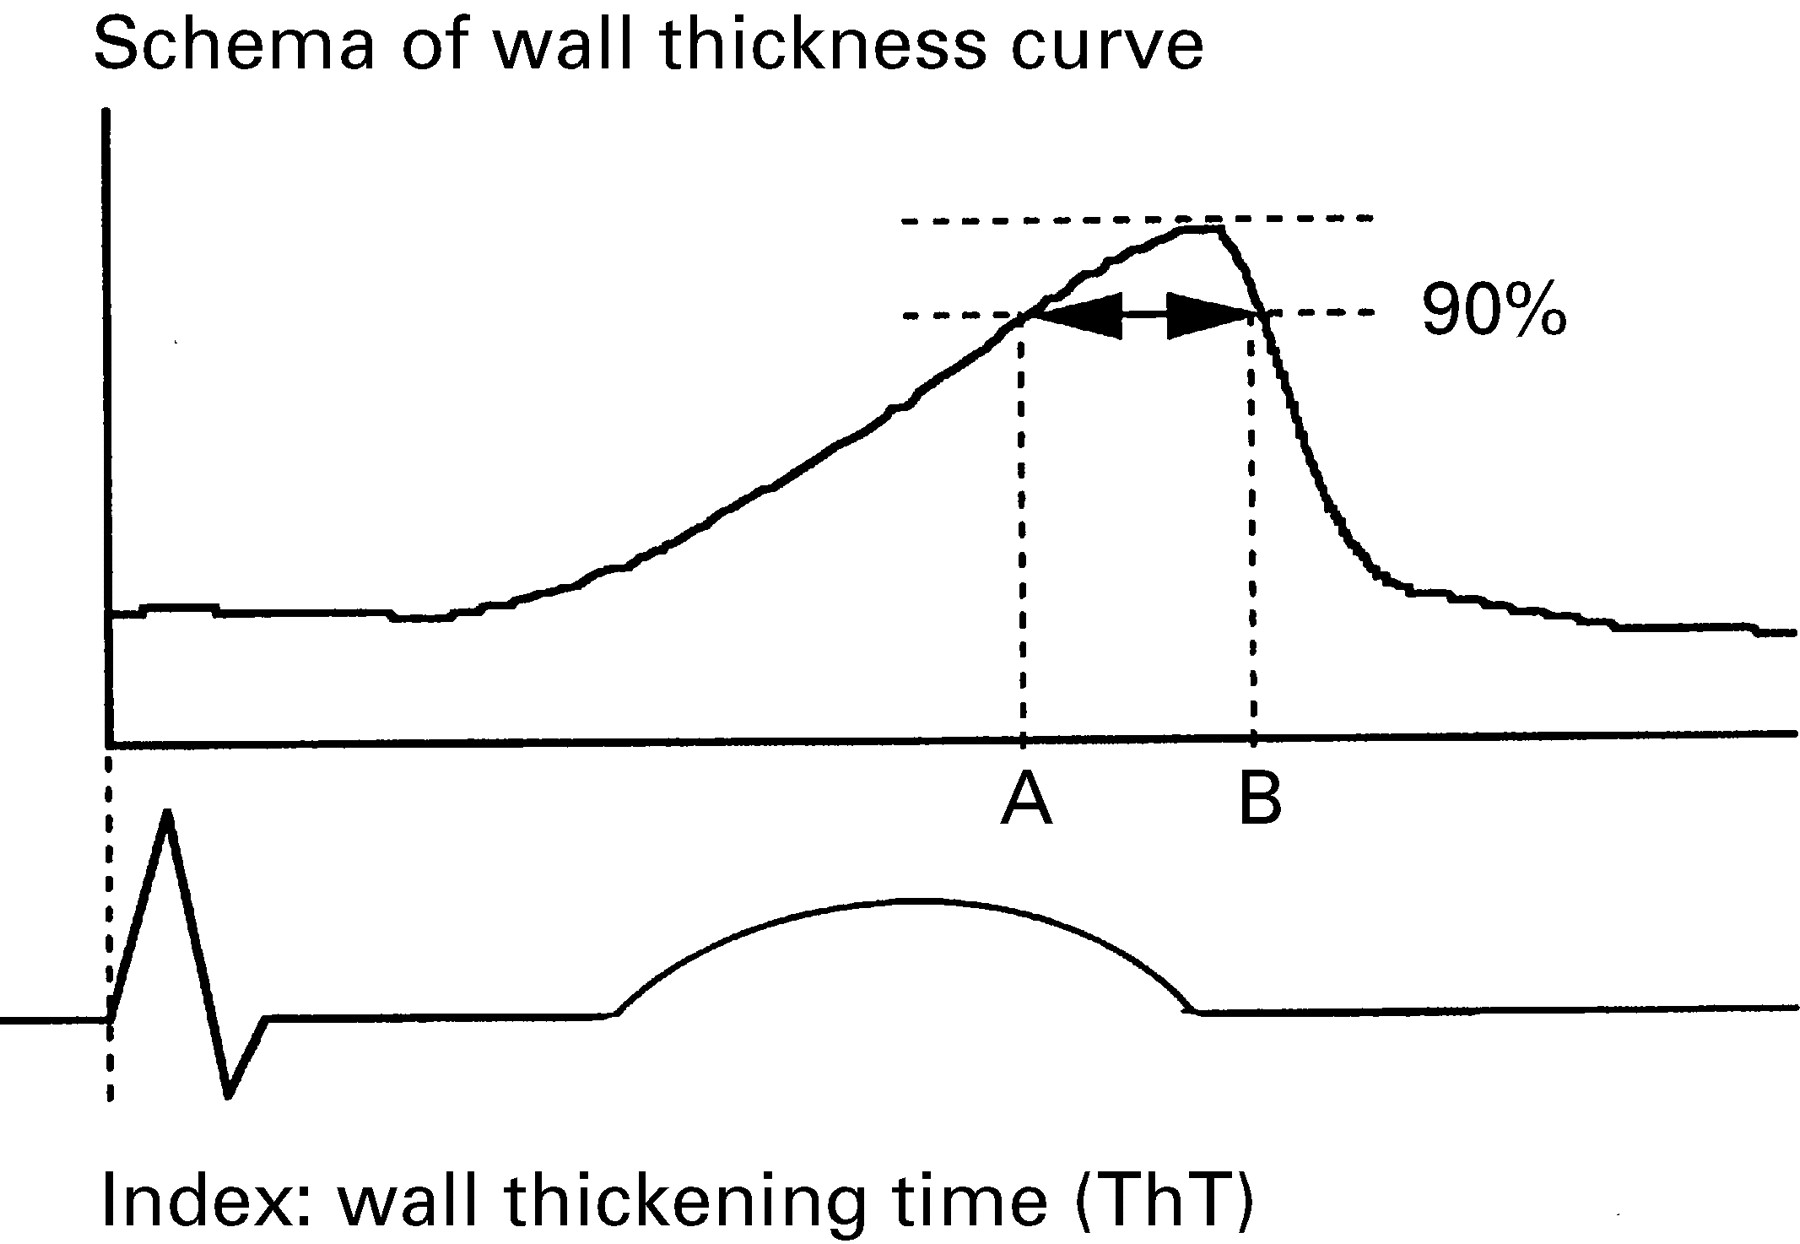
Design Left ventricular short axis images at basal and middle levels were recorded on videotape and digitised to reconstruct digitised M mode echocardiograms, from which left ventricular wall thickness curves were obtained. The wall thickening time (ThT) was defined as the period in which the instantaneous wall thickness exceeded 90% of the maximum wall thickness. ThT was measured at three segments in each of the septal and free wall sides of the left ventricle, a total of 12 segments. To examine the mechanical dispersion of the left ventricle, the difference between the maximum and minimum ThT of 12 segments in each subject was obtained.
Patients Eight patients with congenital long QT syndrome (averaged QTc interval (SD) 509 (27) ms1/2) and 10 control subjects (QTc interval 397 (26) ms1/2) were examined.
Results The averaged ThT values of the 12 segments pooled from all subjects were correlated with the QT intervals (r = 0.72, p < 0.005). Thus the averaged ThT in the long QT syndrome patients was longer than in the control subjects (p < 0.005). The segmental variation of ThT in the patients was greater than in the control subjects (p < 0.001). The dispersion of ThT in the patients was therefore larger than in control subjects (p < 0.005). However, the pattern of ThT variation in the patients varied according to the individual subject.
Conclusions There is not only electrical but also mechanical dispersion in the left ventricle of long QT syndrome patients. Regional assessment of ventricular wall motion may allow quantification of the spatial variation of wall motion abnormality.
- echocardiography
- long QT syndrome
- regional wall motion
- dispersion
Statistics from Altmetric.com
Congenital long QT syndrome is characterised by abnormal ventricular repolarisation and the occurrence of malignant ventricular arrhythmia.1–6 Many clinical and basic studies have been performed to investigate the underlying mechanisms of polymorphic ventricular tachycardia in the long QT syndrome. Generally, it has been thought that the inhomogeneity of regional myocardial repolarisation plays an important role in the polymorphic ventricular tachycardia observed in patients with this syndrome. The inhomogeneity of ventricular repolarisation has been shown by the dispersion of the QT interval in standard 12 lead electrocardiograms,7-9 by the recovery times10 and isochrone integral maps11 on body surface mapping, and by the dispersion of the monophasic action potential duration.12 ,13
Nador et al provided the first, and unexpected, evidence of a mechanical alteration in patients with long QT syndrome,14 thus showing that this is not a purely electrical phenomenon. Their study, using M mode echocardiography, showed the presence of a slow movement in the late thickening phase in long QT syndrome. This abnormality was present in more than 50% of the patients and was associated with a higher risk for syncope or cardiac arrest. Conventional M mode echocardiography cannot evaluate the entire left ventricular wall motion quantitatively. However, long QT syndrome patients have inhomogeneous ventricular repolarisation and it is important to evaluate the wall motion abnormality in the entire left ventricle. The purpose of our study was to examine the regional wall motion abnormality in the entire left ventricle and to evaluate the dispersion of mechanical abnormality in long QT syndrome patients, using digitised wall thickness curves. We have already presented preliminary data.15
Methods
SUBJECTS
We studied eight patients with congenital long QT syndrome (four female and four male), aged 13 to 57 years, mean (SD) age 27 (17) years (table 1). Long QT syndrome was defined according to the diagnostic criteria of Schwartz et al.16The syndrome was familial (Romano-Ward syndrome) in five patients and sporadic in three. Six patients had a history of syncope or torsade de pointes. Three patients had notched T wave in three leads, and T wave alternans was not present in any patients.
Clinical characteristics of the eight patients with long QT syndrome
Twelve lead electrocardiograms were obtained in all patients, either before or after echocardiography. The QT interval in all 12 leads was measured from the onset of the QRS complex to the end of the T wave.17 When U waves were present, the QT was measured to the nadir of the curve between the T and U waves, with the aid of a tangent. The QTc interval was corrected for heart rate using Bazett’s formula (QTc = QT/square root of RR interval in seconds).18 The QT dispersion was measured as the difference between the maximum and the minimum QT intervals on the 12 lead electrocardiogram.7
All eight long QT syndrome patients had a QTc interval longer than 480 ms1/2 (range 480 to 570, mean (SD) 509 (27)), which was unrelated to electrolyte abnormalities or any other causes of QT prolongation. None of the patients had been taking an antiarrhythmic or β blocking agent. As a control group, 10 subjects without cardiac or lung disease were also examined (four female and six male aged 11 to 30 years, mean (SD) 23 (6) years). They had QTc intervals shorter than 430 ms1/2 (range 347 to 430, mean (SD) 397 (26) ms1/2).
ECHOCARDIOGRAPHIC STUDIES
Echocardiography was performed using a commercially available device (SONOS 1500, Hewlett-Packard, Andover, Massachusetts, USA) equipped with a 3.5 MHz and 2.5 MHz transducer. Standard cross sectional, M mode, and Doppler echocardiographic studies were performed in the long QT syndrome patients and control subjects in a partial left lateral decubitus position. The echocardiography was recorded on videotape together with an electrocardiogram at lead II.
IMAGE ACQUISITION AND THE WALL THICKNESS CURVE
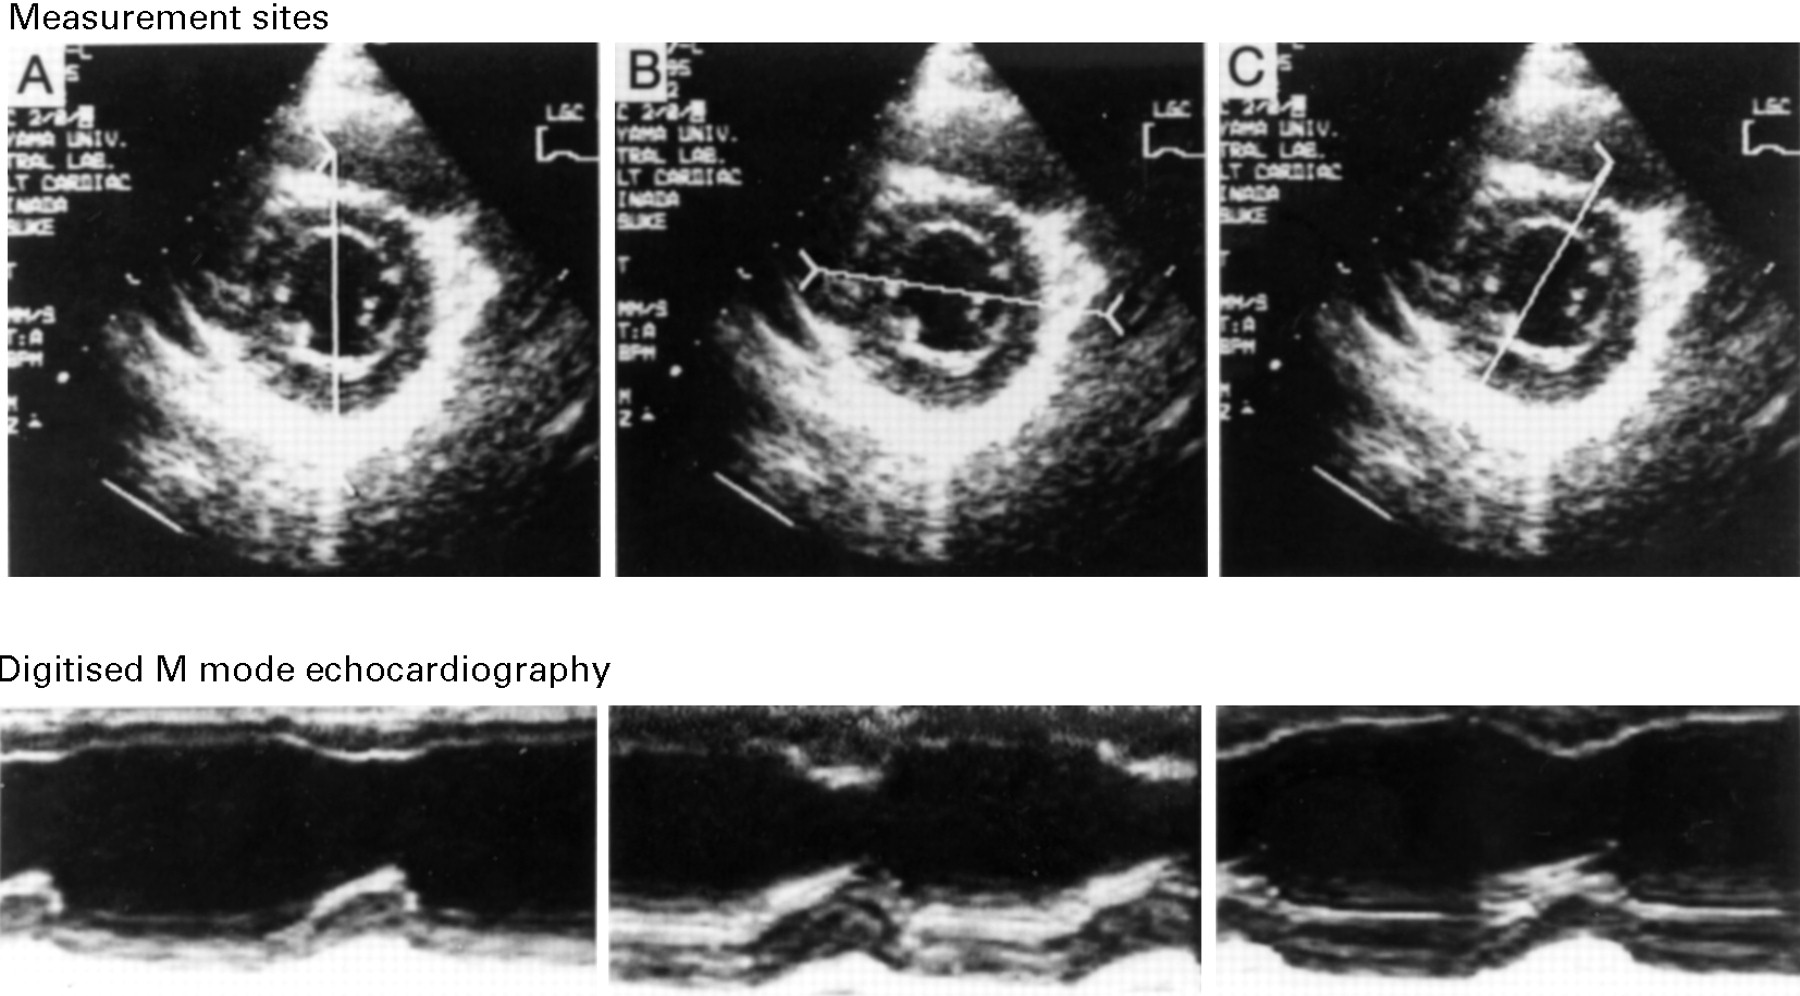
Left ventricular short axis images at the basal and middle levels were recorded on half inch videotape. The recorded short axis images were preserved as consecutive digitised B mode images, every 33 ms, in an offline computer, and we reconstructed the digitised M mode echocardiograms from these images (fig 1). We obtained the left ventricular wall thickness curves from these digitised M mode echocardiograms (fig 2). We then measured the wall thickening time index (ThT) on the wall thickness curves. The ThT was defined as the period in which the late systole exceeded 90% of the maximum wall thickness, and corresponds to segment AB in fig 3. The ThT was measured at three segments in each of the septal (anterior septum, mid-septum, and posterior septum) and free wall sides (anterior wall, lateral wall, and posterior wall) of the left ventricle, and thus a total of 12 sites was used for the ThT measurement.

Digitised B mode and M mode echocardiography of a representative long QT syndrome (LQTS) patient. The upper images show the digitised B mode echocardiography and measurement sites used to reconstruct the digitised M mode echocardiography. These sites were mid-septum and lateral wall (A), posterior septum and anterior wall (B), and anterior septum and posterior wall (C). The lower images show the digitised M mode echocardiography of each measurement site in the upper images.
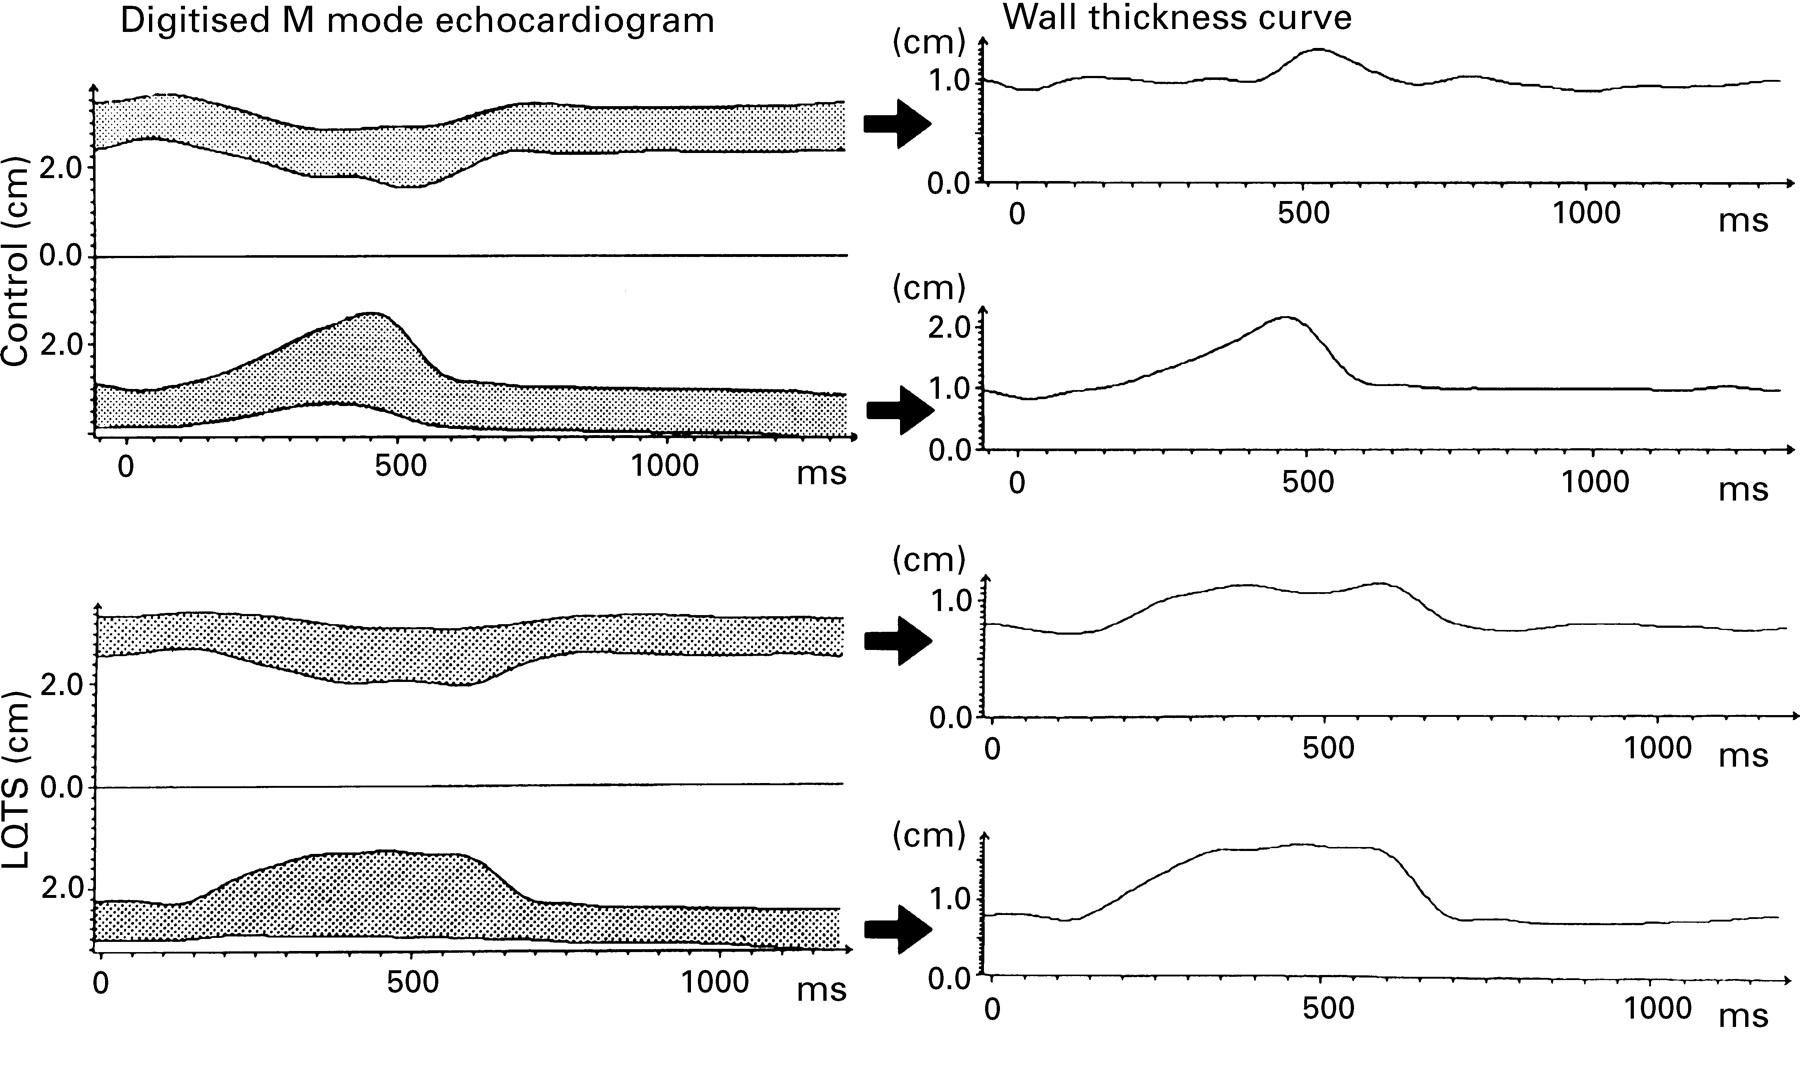
Wall thickness curve obtained from digitised M mode echocardiogram. The left side images are digitised M mode echocardiograms of mid-septum and lateral wall in a control subject and in a long QT syndrome (LQTS) patient. The wall thickness curves are obtained from tracing the digitised M mode echocardiograms in each measurement site.

Schema of the wall thickness curve and the ThT index. This shows the thickening curve of the left ventricular wall at one measurement site. Segment AB represents ThT, defined as the period in which the late systole exceeded 90% of the maximum wall thickness.
To correct for heart rate, ThTc was calculated from the ThT divided by a square root of the RR interval (ThTc = ThT/square root of RR interval in seconds), as in Bazett’s formula in an electrocardiogram.18 To examine the inhomogeneity of regional repolarisation, we defined ThT dispersion as the difference between the maximum and minimum ThT values of the 12 segments in each subject.
REPRODUCIBILITY
The reproducibility of the QT interval and QT dispersion measurements was tested in all long QT syndrome patients and two control subjects by one observer (KN) on two occasions to assess intraobserver variability. Another observer (HY) independently performed the measurements in the same patients and subjects to assess interobserver variability. The reproducibility of the ThT measurements was assessed in 48 randomly selected segments. The mean (SD) differences for these subjects were 4 (31) ms for QT intervals, 11 (25) ms for QT dispersions, and −1 (16) seconds for ThT. The mean (SD) differences between the measurements of the two observers were 15 (28) ms for QT intervals, −5 (30) ms for QT dispersions, and −13 (28) seconds for ThT.
STATISTICAL ANALYSIS
The data are expressed as mean (SD) values. The Spearman rank correlation was used to evaluate the correlation between the QT interval and ThT, and between the QT dispersion and ThT dispersion. The statistical analysis of the data of the long QT syndrome group and the control group was performed using the Mann-Whitney non-parametric U test. Differences among the 12 segments and between those of the long QT syndrome patients and the control subjects were assessed by two way factorial analysis of variance (anova). A probability (p) value < 0.05 was considered significant.
Results
GENERAL CHARACTERISTICS
The eight long QT syndrome patients had a score of > 4 points (range 4 to 7.5, mean 5.6 (1.4)) according to the diagnostic criteria.16 No significant difference in the mean cardiac cycle length was present between the patients and the control subjects (1114 (198) v 974 (147) ms). The QT interval (535 (49) v 390 (22) ms) and QTc interval (509 (27) v 397 (26) ms1/2) were longer in the patients (both p < 0.001). The degree of QT dispersion in the patients was greater than in the control subjects (81 (39) v 20 (8) ms, p < 0.001).
ECHOCARDIOGRAPHIC ANALYSIS
Standard echocardiographic studies to determine ventricular chamber size and wall thickness, and Doppler examination were performed in the long QT syndrome patients and the control subjects. Abnormal findings were not observed in any patient or control, and there were no significant differences between the patients and the controls.
Global analysis of the index
In the eight long QT syndrome patients and the 10 control subjects, we measured the ThT in each segment and calculated the averaged ThT in each subject. We plotted the averaged ThT in the long QT syndrome patients and the control subjects. Linear regression analysis showed a significant correlation between the averaged ThT and the QT interval (r = 0.72, p < 0.005) (fig 4). The averaged ThT (133 (46) v 67 (11) ms) in the patients was longer than that in the controls (p < 0.005) (fig 4). As indicated in this figure, an averaged ThT of > 110 ms could distinguish long QT syndrome patients from the control subjects with a sensitivity of 75% and a specificity of 100%.
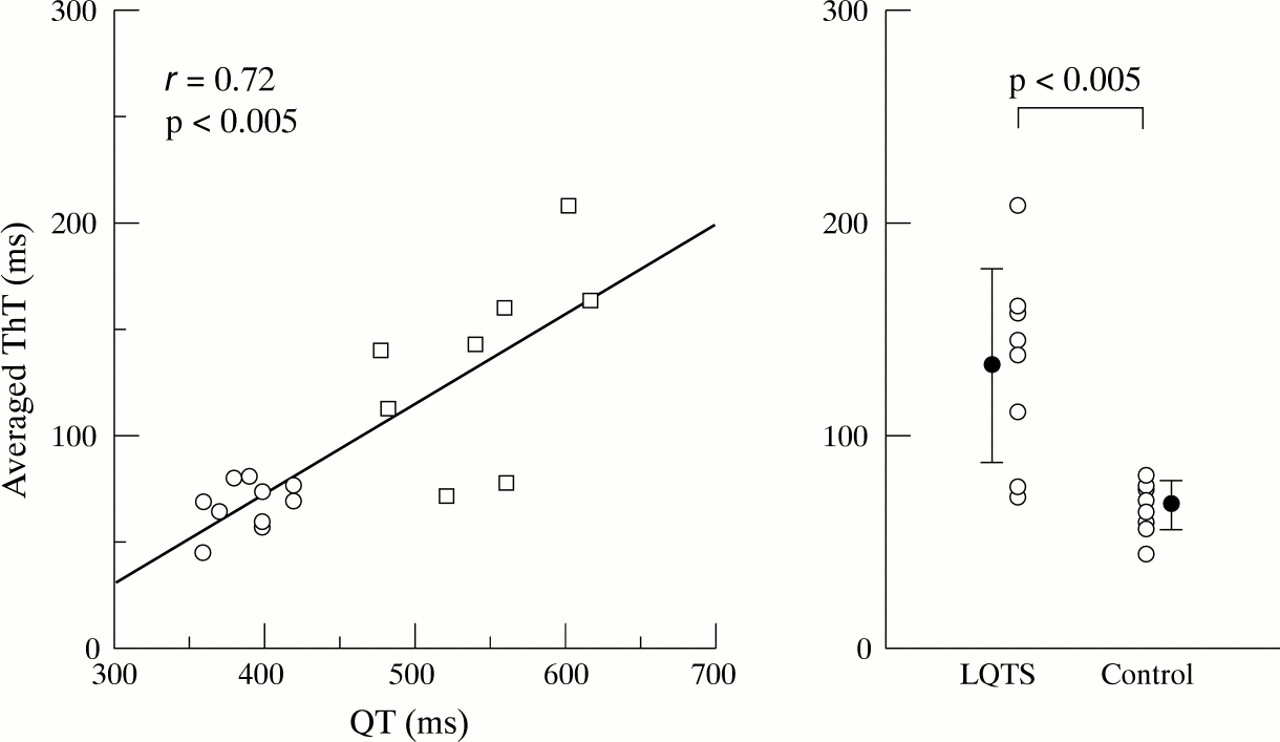
Left: scatterplot of the relation between the QT interval and the averaged ThT of 12 segments in the controls (○, n = 10) and the long QT syndrome (LQTS) patients (□, n = 8). A significant correlation was found between the averaged ThT and the QT intervals (r = 0.72, p < 0.005). Right: plot comparing the averaged ThT between the LQTS patients (n = 8) and the control subjects (n = 10). The mean and 1 SD are indicated by the vertical bars. The ThT index of the LQTS patients was significantly larger than that of the control subjects (p < 0.005).
As data would probably relate to the cardiac cycle length, we calculated the ThTc. A significant difference in the ThTc (127 (45)v 68 (9), p < 0.01) was found between long QT syndrome patients and the control subjects. Thus the quantitative difference between the patients and the controls did not depend on the type of analysis used.
Dispersion of the index
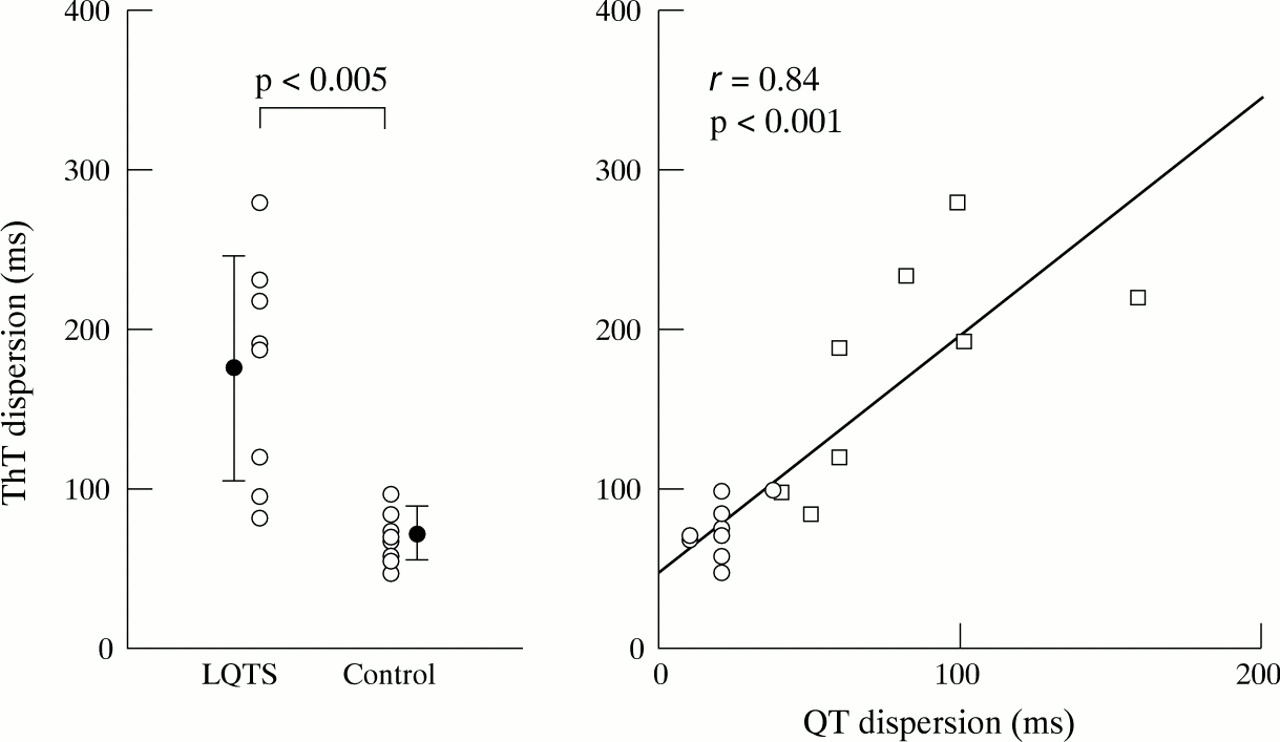
Figure 5 shows the individual ThT data of the 12 segments in each subject. The segmental variation of ThT was significantly larger in the long QT syndrome patients than in the control subjects (p < 0.001). However, in the patients, the pattern of ThT variation varied among the individual subjects, and there was no significant difference in the ThT among the segments. The ThT dispersion was greater in the patients than in the controls (175 (71) v 71 (17) ms, p < 0.005) (fig 6). Linear regression analysis of the long QT syndrome patients and control subjects indicated a significant correlation between the QT dispersion and ThT dispersion (r = 0.84, p < 0.001) (fig6).
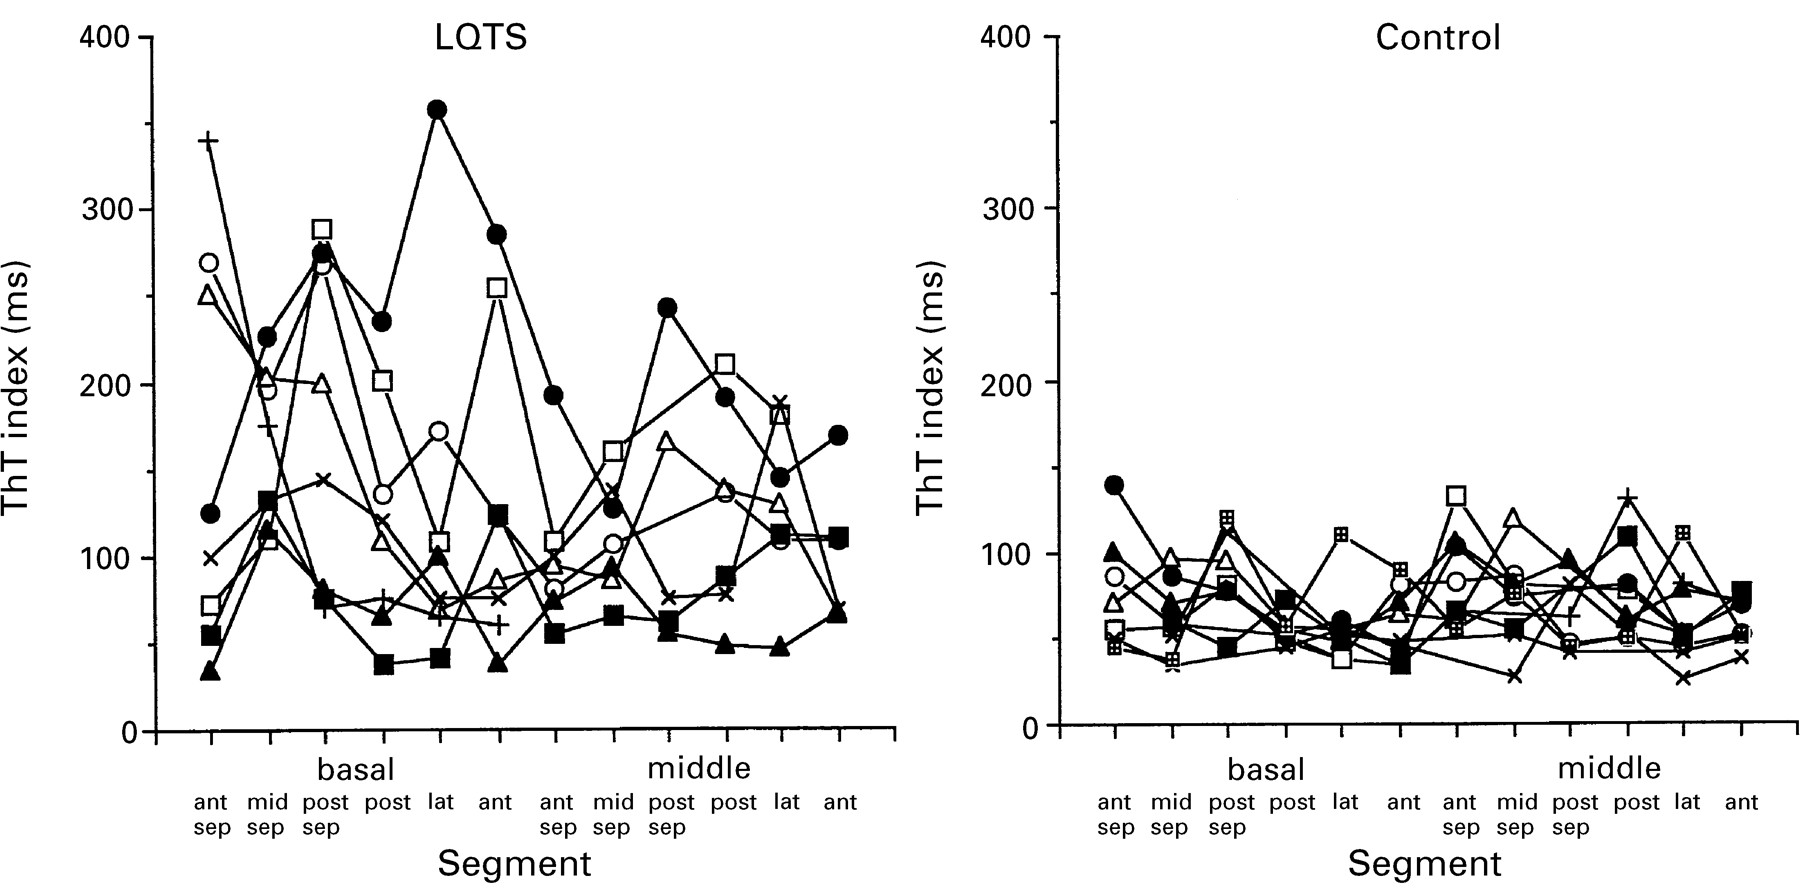
Segmental variance in the ThT index at 12 segments of the left ventricle of the long QT syndrome (LQTS) patients (n = 8) and the control subjects (n = 10); ant, anterior wall; ant sep, anterior septum; lat, lateral wall; mid-sep, mid-septum; post, posterior wall; post sep, posterior septum.

Left: plot comparing the dispersion of ThT between the long QT syndrome (LQTS) patients (n = 8) and the control subjects (n = 10). The mean and 1 SD are indicated by the vertical bars. The dispersion of ThT was significantly greater in the LQTS group than in the control group (p < 0.005). Right: scatterplot of the relation between the QT dispersion and the ThT dispersion in the controls (○, n = 10) and the LQTS patients (□, n = 8). A significant correlation was found between QT dispersion and ThT dispersion (r = 0.84, p < 0.001).
Discussion
This study assessed the left ventricular regional wall motion abnormality and the dispersion of this abnormality in patients with long QT syndrome. A significant correlation was found between the dispersion of this abnormality and QT dispersion. The dispersion of mechanical abnormality thus appears to reflect the inhomogeneity of repolarisation in the long QT syndrome.
CHARACTERISTICS OF MECHANICAL ABNORMALITY
Nador et al provided the first and unexpected evidence for mechanical alteration in long QT syndrome patients, and showed that this syndrome is thus not a purely electrical phenomenon.14 They described the presence of a slow movement in the late thickening phase, and they developed a new index, TSTh. This index was calculated from the first derivative of the endocardial tracing. This abnormality was found in 23 of the 42 long QT syndrome patients (55%), and was more frequent in symptomatic patients (20 of 26, 77%), though in our study we did not find a significant difference between the symptomatic and asymptomatic patients. Nador’s observation is important and provides evidence of a structural or functional impairment of the hearts of long QT syndrome patients.
DISPERSION OF REPOLARISATION
Long QT syndrome demonstrates inhomogeneity of regional repolarisation; this can be shown by a standard 12 lead electrocardiogram,7–9 body surface mapping,10 ,11 and monophasic action potentials.12 ,13 The analysis of QT dispersion from the standard 12 lead electrocardiogram is a simple method for deriving regional repolarisation.7-9 Normal values of QT dispersion, defined as an average value of < 65 ms, were seen in subjects without ventricular tachyarrhythmias.19 Values of QT dispersion > 130 ms have been reported in patients with long QT syndrome.9 In the present study, QT dispersion (81 (39) ms) was less than that in the previous report,9 but greater than in the control subjects (p < 0.001). The magnitude of dispersion of repolarisation is influenced by the spatial distribution. De Ambroggi et al estimated the adjacent dispersion of repolarisation from mapping in 117 chest electrodes.11 They showed delayed repolarisation of the left ventricular anterior wall or septum. Shimizuet al studied the dispersion of recovery time on the body surface using 87 electrodes.10 They found that the repolarisation time distribution of long QT syndrome patients was variable and more complex than in controls. The body surface mapping technique can show regional repolarisation and is a non-invasive technique but it is cumbersome, while monophasic action potential durations have been directly recorded to evaluate the regional electrophysiological properties of ventricular repolarisation. Franz et al measured the dispersion of repolarisation times at 54 left ventricular endocardial sites using catheter electrodes in patients with normal left ventricular function.20 In long QT syndrome patients, it was shown that the dispersion of monophasic action potentials was greater than in controls.12 ,13 However, it is difficult to record the detailed mapping of monophasic action potentials in all patients during an electrophysiological study.
Cross sectional echocardiography is a widely used non-invasive imaging method for evaluating regional left ventricular wall motion. Nadoret al used the tracing of the endocardial movement of M mode echocardiograms.14 This is easily performed in the posterior wall, but it is difficult to evaluate the spatial orientation by conventional M mode echocardiography. They suggested that the abnormality was present throughout the left ventricle because of the absence of any dyssynergy in contraction on cross sectional images. In addition, the endocardial movement is influenced by the upward shift of the whole heart, especially in the posterior wall. We therefore observed regional left ventricular wall motion using this cross sectional echocardiography and examined the wall thickness curve to exclude the effect of the shift of the whole heart using the digitised method to analyse the entire left ventricle. We developed a new index, ThT, which is simply and easily measured on the wall thickness curve, and thus we were able to measure the ThT in the entire left ventricle. The prolonged index was demonstrated in some segments of each patient and was present in all long QT syndrome patients. The segment with the prolonged index varied among the patients. Nador et al reported that a wall motion abnormality in the posterior wall was present in 55% of the affected patients.14 Thus it is important to observe not only one segment but also the entire left ventricle. The dispersion of the index was significantly correlated with the QT dispersion. This may suggest that the variance of ventricular repolarisation contributes to the dispersion of wall motion abnormality.
MECHANISMS
We do not have a ready and simple explanation for the phenomena observed in this study. De Ferrari et alshowed that a marked late systolic plateau pattern was present in long QT syndrome patients,21 and that the intravenous injection of a calcium channel blocker, verapamil, abolished it and normalised the contraction pattern. Those findings suggest that long QT syndrome patients may have an abnormal increase in intracellular calcium concentrations before relaxation has completed and that this may be related to an early afterdepolarisation. In the present study, we did not use calcium channel blockers or other drugs and we cannot speculate about the underlying mechanism.
STUDY LIMITATIONS
There are several limitations to the present study. Wall thickness curves were reconstructed from digitised cross sectional echocardiography in the short axis image. It is relatively easy to observe the wall motion of the left ventricle, but it is difficult to study that of the right ventricle. This limits the calculations of the dispersion of ThT across the entire ventricular mass.
We recorded the images on videotape in this study. Videotape imaging is limited to 30 frames a second. Although the digitised M mode echocardiograms reconstructed from videotape images showed ladder-like curves, we obtained a smooth curve by interpolation. Cross sectional echocardiography recorded on videotape is limited by time dependent analysis.
It is possible that the wall thickening time parameter used in this study differs with aging. It is important to define any age difference in this index. We do not yet have enough data to define such an age difference accurately. Further studies are necessary to determine the influence of aging.
We used the data pooled from all subjects to calculate correlation coefficients. Correlation coefficients calculated for long QT syndrome and controls independently are better than those for pooled data. However, our numbers of patients and controls were too small to calculate the correlation coefficients for each group independently. It is necessary to examine more patients in this regard.
In long QT syndrome patients it is possible that the QT interval shows temporal variation in duration. It is important to make electrocardiographic and echocardiographic records on the same patient on successive days and to define the reproducibility of the QT interval and ThT.
CONCLUSIONS
In this study we assessed the abnormality of regional wall motion of the left ventricle in late systole and the dispersion of this abnormality in long QT syndrome patients. The dispersion of regional wall motion abnormality was significantly correlated with QT dispersion. This observation suggests that the dispersion of the ventricular repolarisation contributes to the dispersion of mechanical abnormality. The regional assessment of ventricular wall motion allows quantification of the spatial variation of ventricular repolarisation.