Article Text

Abstract
Objective To investigate the intraoperative release of troponin T during uncomplicated coronary artery surgery and to determine its relation to ischaemic time and to recovery of left ventricular function and oxidative metabolism.
Design A prospective observational study.
Setting Cardiac surgical unit in a tertiary referral centre.
Methods Troponin T, creatine kinase, and lactate were analysed from arterial and coronary sinus samples taken before operation, and 1, 4, 6, 10, 20, 35, and 45 minutes after cross clamp release. Net myocardial troponin T release and lactate extraction were derived from their respective arteriovenous differences. Haemodynamic measurements were made using a thermodilution pulmonary artery catheter.
Patients 45 patients, mean (SD) age 62 (9) years, with two or three vessel coronary artery disease and chronic stable angina undergoing routine coronary artery surgery.
Results Before operation, troponin T concentrations were not raised, but within one minute of cross clamp release they increased progressively in both coronary sinus and arterial blood for the entire 45 minutes of reperfusion studied. Coronary sinus troponin T concentrations were consistently higher than arterial concentrations at all time points (p < 0.001), indicating net troponin T release by the myocardium. Peak net troponin T release and area under the curve of net troponin T release correlated closely with ischaemic time (r = 0.58 andr = 0.61, p < 0.0001 for both). Area under the curve of arterial troponin T concentration was also significantly correlated with ischaemic time (r = 0.44, p < 0.01). Patients with cross clamp times longer than 72 minutes (upper quartile for ischaemic time) had greater troponin T release, delayed reversion to lactate extraction, and lower left ventricular stroke work index three hours after surgery, compared with patients who had short (< 50 minutes, lower quartile) and intermediate (51–71 minutes, interquartile) cross clamp times. Peak net troponin T release and area under the curve of arterial troponin T concentration were inversely correlated with left ventricular stroke work index three hours after surgery (r = −0.57, r = −0.38, p < 0.01).
Conclusions Troponin T concentrations increased in every patient after cross clamp release, and were consistently higher in coronary sinus blood than in arterial blood, indicating net myocardial release of troponin T during the period of reperfusion. Intraoperative net troponin T release has functional significance, as it is closely related to ischaemic time and reflects delayed recovery of left ventricular function and oxidative metabolism; therefore, its measurement may contribute to the perioperative assessment of myocardial injury sustained during coronary artery surgery.
- coronary artery surgery
- troponin T
- intraoperative assessment
- myocardial injury
Statistics from Altmetric.com
Coronary artery surgery, performed with the aid of cardioplegia, requires a period of cardiac arrest. During this time myocardial ischaemia and necrosis may occur. Myocardial injury sustained during coronary artery surgery is an important determinant of functional and clinical outcome. Although major perioperative myocardial infarction, which is associated with a poor prognosis, can be readily diagnosed on the basis of the electrocardiogram and raised creatine kinase activity, a significant proportion of patients sustain more diffuse myocardial damage, which produces less clearly defined electrocardiographic changes.1 Markers such as creatine kinase MB isoenzyme (CK-MB) have been used to quantify the extent of myocardial damage following coronary artery surgery, but such estimates are difficult to interpret because of their lack of specificity.2 In particular, CK-MB is released from concomitant skeletal muscle damage during surgery, leading to raised activity, particularly in the early postoperative period, independent of any myocardial injury sustained.3 More recently, cardiac troponin T, a component of the tropomyosin contractile regulatory complex, has been shown to be released specifically after myocardial damage4 and has been used extensively to assess the effect of interventions and myocardial protection strategies, usually from serial measurements in the peripheral venous blood over several days following surgery.5-8 However, intraoperative studies of the early release of this specific marker of myocardial injury have not been performed.
We studied the release of troponin T in the period immediately following cross clamp removal when coronary blood flow is restored, by sampling venous blood draining directly from the heart through a coronary sinus catheter. By obtaining simultaneous arterial and coronary sinus samples for troponin T, CK-MB, and lactate analysis, we determined net myocardial release of troponin, its kinetics, relation to ischaemic time, and influence on recovery of left ventricular function and oxidative metabolism.
Methods
PATIENTS
We studied 45 patients (mean (SD) age 62 (9) years; 35 men, 10 women) undergoing routine coronary artery bypass grafting for stable angina. The patients had greater than 75% stenosis in at least two epicardial coronary arteries, and ejection fraction greater than 50% assessed by contrast angiography. Patients with unstable angina or myocardial infarction within the last six months were excluded. The protocol was approved by the ethics committee of the Royal Brompton Hospital and informed consent was obtained from all patients. There were no side effects.
OPERATIVE PROCEDURE
General anaesthesia was induced by alfentanyl and maintained with enflurane. Cardiopulmonary bypass was established with ascending aortic and single right atrial (two stage) cannulation with systemic hypothermia (32°C nasopharyngeal temperature), haemodilution (packed cell volume 20–25%), and perfusion flow rate between 1.6 l/min/m2 at 32°C and 2.2 l/min/m2 at 37°C. A DPL triple lumen catheter was positioned in the coronary sinus and its proximal pressure monitored and maintained at 30 to 40 mm Hg during retrograde perfusion. Cold blood cardioplegia was used for myocardial protection. The first two thirds of the cardioplegia were given antegradely, and it was subsequently maintained by potassium enriched autologous blood given retrogradely into the coronary sinus every 15 minutes. After the distal anastomoses were complete, the aortic cross clamp was removed and the proximal anastomoses fashioned with a side biting clamp on the aorta during myocardial perfusion. Immediately before release of the aortic cross clamp, there was a five minute period of warm reperfusion (600 ml of potassium enriched blood at 37°C through the coronary sinus catheter) while the patient’s core temperature was 35–37°C.
HAEMODYNAMIC MEASUREMENTS
Radial artery and Swan Ganz thermodilution catheters were inserted after induction in all patients. Haemodynamic measurements were made at the following time points: before cardiopulmonary bypass, 0.5, 1, 2, 3, 6, and 24 hours after operation. All measurements were made in a stable haemodynamic state and cardiac output was determined by the average of at least three measurements. The following variables were measured: heart rate, blood pressure, pulmonary artery wedge pressure, pulmonary artery pressure, cardiac output, cardiac index, and left ventricular stroke work index.
ELECTROCARDIOGRAPHY
Serial 12 lead electrocardiograms were obtained before operation and at 24, 48, and 72 hours after operation. Myocardial infarction was diagnosed by the appearance of new Q waves of > 0.04 seconds, duration or a loss of > 25% of R waves in two contiguous leads.
TROPONIN T AND CK-MB PROTOCOL
Blood samples were obtained simultaneously from the coronary sinus and radial artery at the following time points: before cardiopulmonary bypass, 1, 4, 6, 10, 20, 35, and 45 minutes after release of the aortic cross clamp, for estimation of troponin T, CK-MB, lactate, and packed cell volume. The final two paired samples (35 and 45 minutes) were taken after weaning from cardiopulmonary bypass. The values of troponin T and CK-MB taken while on cardiopulmonary bypass were corrected for haemodilution by multiplying the measured component with a correction factor (CF) as described by Feindt et al
9: where PCV is packed cell volume (%), pPCV is plasma packed cell volume (100% − PCV%), 0 is the value before cardiopulmonary bypass, and 1 the value at the time of sampling.
The net release of troponin T and CK-MB was calculated as the (arteriovenous difference) coronary sinus concentration minus arterial concentration. Lactate extraction was calculated from the formula: arterial lactate − coronary sinus lactate/arterial lactate, expressed as a percentage.10 A negative value for lactate extraction therefore represents net myocardial production of lactate. Venous blood samples were subsequently obtained 24, 48, and 72 hours later for troponin T and CK-MB measurements. All samples were centrifuged within 20 minutes and the plasma was stored at −20°C until analysis.
BIOCHEMICAL ANALYSIS
Cardiac troponin T was measured using a commercially available enzyme linkedimmunosorbent assay kit (elisa troponin T, Boehringer Mannheim, Mannheim, Germany) and batch elisaanalyser (Enzymun test system ES 300, Boehringer Mannheim). The lower detection limit of the assay was 0.1 μg/l, and values above 0.2 μg/l were considered increased. CK-MB was directly measured by microparticle enzyme immunoassay with the Abbott IMX CK-MB kit (Abbott Diagnostics Division, Maidenhead, UK). The reference range for CK-MB was less than 4 μg/l and the detection limit was 0.3 μg/l. Coefficients of variation for troponin T measurements were 4% and 10% at levels of 4.5 μg/l and 0.2 μg/l, respectively. Lactate was measured by the lactate oxidase method using an Analox LM3 analyser (Analox Instruments, London, UK).
STATISTICAL ANALYSIS
Troponin T and CK-MB values are presented as median and interquartile range (25% to 75%) and non-parametric statistical tests were used, as normal distribution could not be assumed.5 ,7 ,13 The area under the curve was calculated using the method of Matthews et al.11 A Wilcoxon signed rank test was used to evaluate differences between time points, while differences between groups were compared using the Kruskal-Wallis test. Correlation was tested using Spearman’s rank statistical test. Haemodynamic data are shown as mean (SD). Differences within and between groups were assessed by repeated measures analysis of variance (anova) as appropriate or χ2 test for categorical variables. The level of significance was taken as p < 0.05.
Results
CLINICAL, ELECTROCARDIOGRAPHIC, AND PACKED CELL VOLUME DATA
The patient characteristics and operative data for all patients are shown in table 1. All patients underwent complete revascularisation and none sustained myocardial infarction on the basis of electrocardiography, raised troponin T concentration, or raised CK-MB activity. Atrial fibrillation occurred in three patients, while right bundle branch block was found in one patient postoperatively. Inotropic support was required in two patients and pacing required in three. There was no in-hospital mortality. At 24, 48, and 72 hours respectively, troponin T concentrations (1.0 (0.5 to 2), 0.85 (0.45 to 1.23), 0.9 (0.5 to 1.85) μg/l) and CK-MB activity (18.5 (14.8 to 35.0), 10.3 (6.5 to 13.9), 6 (4.5 to 8.7) μg/l) were within the reference range for troponin T and CK-MB following uncomplicated coronary artery surgery.12
Patient characteristics and operative data
The packed cell volume for arterial and coronary sinus samples after release of the cross clamp ranged from 21.9% to 22.8% and from 21.8% to 22.3%, respectively. There was no significant difference between coronary sinus and arterial packed cell volume throughout the study.
TROPONIN T RELEASE IN ARTERIAL AND CORONARY SINUS BLOOD
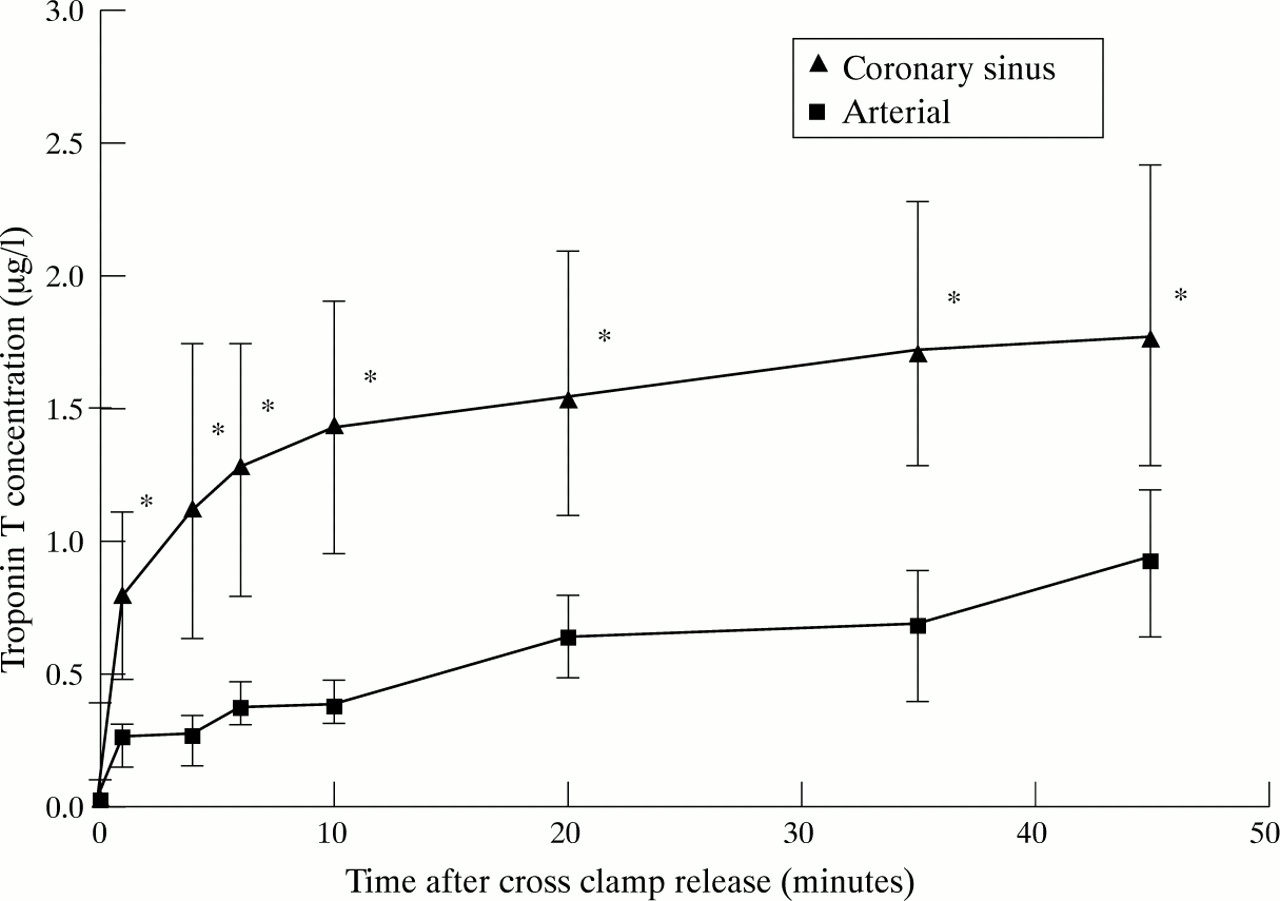
Troponin T concentrations before operation ranged from 0 to 0.1 μg/l for arterial and coronary sinus samples. Troponin T concentrations were raised after cross clamp release and increased progressively at 1, 4, 6, 10, 20, 35, and 45 minutes in both coronary sinus and arterial blood, as compared to before bypass, p < 0.001 for all time points (fig 1). Peak troponin T concentrations in arterial and coronary sinus blood were 0.96 (0.64 to 1.2) μg/l and 1.7 (1.3 to 2.4) μg/l at 45 minutes. Troponin T concentrations in coronary sinus were consistently higher than those in arterial blood, suggesting continuing net myocardial release of troponin T throughout the period of sampling (p < 0.0001 for 1, 4, 6, 10, 20, 35, and 45 minutes).

Troponin T concentration in coronary sinus and arterial blood. Troponin T concentrations in both were raised within one minute of cross clamp release and increased progressively. Coronary sinus concentrations were consistently higher than arterial: *p < 0.001 between coronary sinus and arterial concentrations. Data are expressed as median and interquartile (25th and 75th centile) range.
CK-MB RELEASE IN ARTERIAL AND CORONARY SINUS BLOOD
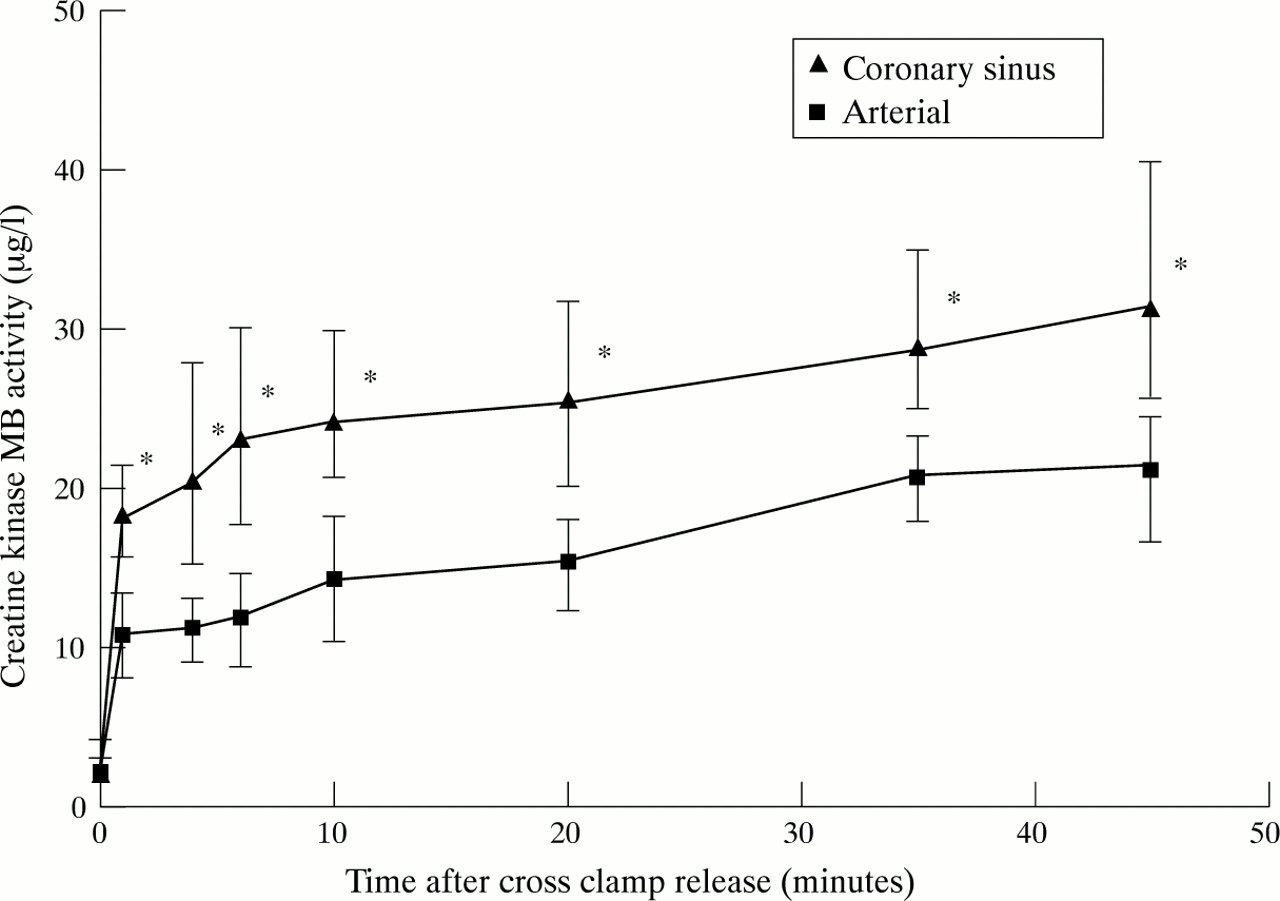
CK-MB activity was significantly higher at all time points (p < 0.0001) after cross clamp release, compared with preoperative activity: 2.0 (1.5 to 3.0) μg/l and 2.6 (1.8 to 4.1) μg/l in arterial and coronary sinus blood, respectively (fig 2). The peak CK-MB activities for arterial (22.6 (16.5 to 24.6) μg/l) and coronary sinus blood (30.9 (25.9 to 40.6) μg/l) occurred in both at 45 minutes. CK-MB activity in coronary sinus blood was significantly greater than in arterial blood at all time points (p < 0.001 for all).

Creatine kinase MB activity in coronary sinus and arterial blood. Coronary sinus concentrations were higher than arterial at all time points: *p < 0.001 between coronary sinus and arterial concentration. Data are expressed as median and interquartile (25th and 75th centile) range.
RELATION BETWEEN ISCHAEMIC TIME AND NET RELEASE (CORONARY SINUS–ARTERIAL DIFFERENCE) OF TROPONIN T AND CK-MB
Peak net troponin release (fig 3; r = 0.58, p < 0.0001) and the area under the curve of net troponin release (fig 4; r = 0.61, p < 0.0001) were closely correlated with ischaemic time.

Relation between peak net release of troponin T (coronary sinus–arterial, CS–A difference) and ischaemic time, showing a close correlation.
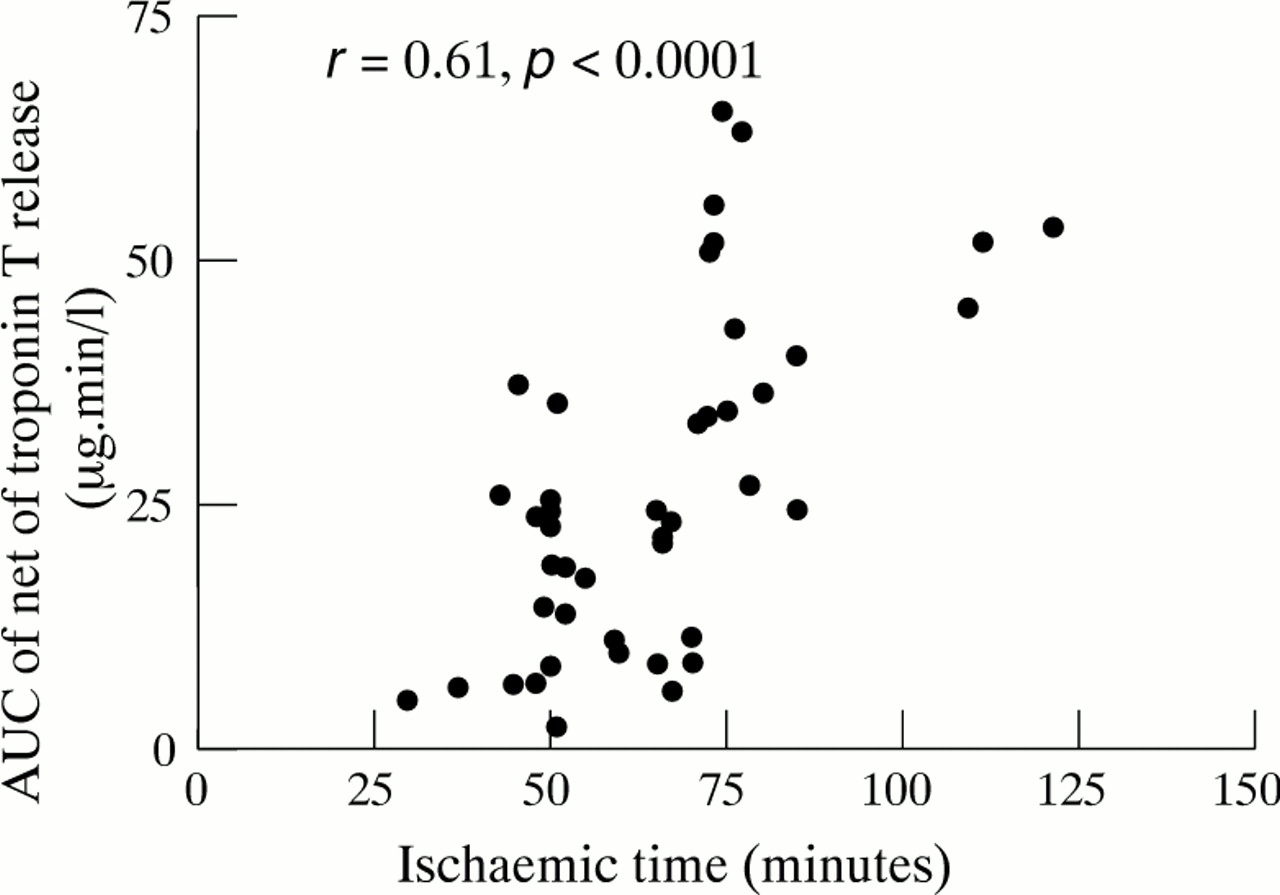
Relation between area under the curve (AUC) of net troponin T release and ischaemic time, showing that they are closely correlated.
Peak net CK-MB release was less well, though still significantly, correlated with ischaemic time (r = 0.29, p < 0.05).
RELATION BETWEEN ISCHAEMIC TIME AND ARTERIAL TROPONIN T AND CK-MB CONCENTRATIONS
When arterial and coronary sinus troponin T concentrations are considered separately, their relation with ischaemic time was less close than net troponin T release. The peak arterial troponin T concentration (r = 0.36, p < 0.05), and the area under the curve of arterial troponin concentration (fig 5;r = 0.44, p < 0.01) correlated significantly with ischaemic time. Peak coronary sinus troponin T concentration (r = 0.47, p < 0.01) also correlated significantly with ischaemic time, as did peak arterial and coronary sinus CK-MB concentrations (r = 0.38 and r = 0.37, p < 0.05).

Relation between area under the curve (AUC) of arterial troponin T concentration and ischaemic time, showing a significant correlation.
COMPARISON OF GROUPS WITH SHORT, INTERMEDIATE, AND LONG ISCHAEMIC TIMES
To investigate the clinical correlations of ischaemic time in more detail, patients were divided into three groups: group A, with short cross clamp times (< 50 minutes, n = 14); group B, with intermediate cross clamp times (51–71 minutes, n = 16); and group C with long cross clamp times (> 72 minutes, n = 15) (table 2). The groups correspond to the lower quartile (< 25%), interquartile (25–75%), and upper quartile (> 75%) respectively. Clinical data, recovery of left ventricular function, and oxidative metabolism were compared between groups. The patient characteristics and operative data for all groups are shown in table2.
Patient characteristics of groups A, B, and C
There were significantly more patients with two vessel coronary artery disease in group A, with correspondingly fewer grafts per patient compared with groups B and C. In group C, two patients required inotropic support with dopamine (dose range 6.4 to 8.0 μg/kg/min) for 48 hours, and two required temporary atrioventricular sequential pacing for between 12 and 24 hours. One patient in group B required atrioventricular pacing for 12 hours, but none required inotropic support. No patient in group A required inotropic support or pacing.
Patients in groups A and B did not differ significantly in terms of troponin T release. However, patients whose ischaemic times exceeded 72 minutes (group C) had significantly greater troponin T release. Group C patients had significantly higher peak troponin T arterial concentration, area under the arterial concentration curve, peak net release and its area under the curve in comparison with both group A and group B (table 3).
Intraoperative troponin T release for groups A, B, and C
LACTATE EXTRACTION
There was marked net production of lactate one minute after cross clamp removal in all three groups: group A (−32(7)%), group B (−34(10)%), and group C (−31(8)%) (fig 6). In groups A and B, lactate production rapidly declined by four minutes, while in group C it remained high. Lactate production in group A (−10(3)%) and B (−12(3)%) was significantly lower than in group C (−31(8)%, p < 0.05) after four minutes. In group A, lactate reverted from production to extraction earlier (8(4)% v −6(3)%, p < 0.05) at 35 minutes compared with group C.
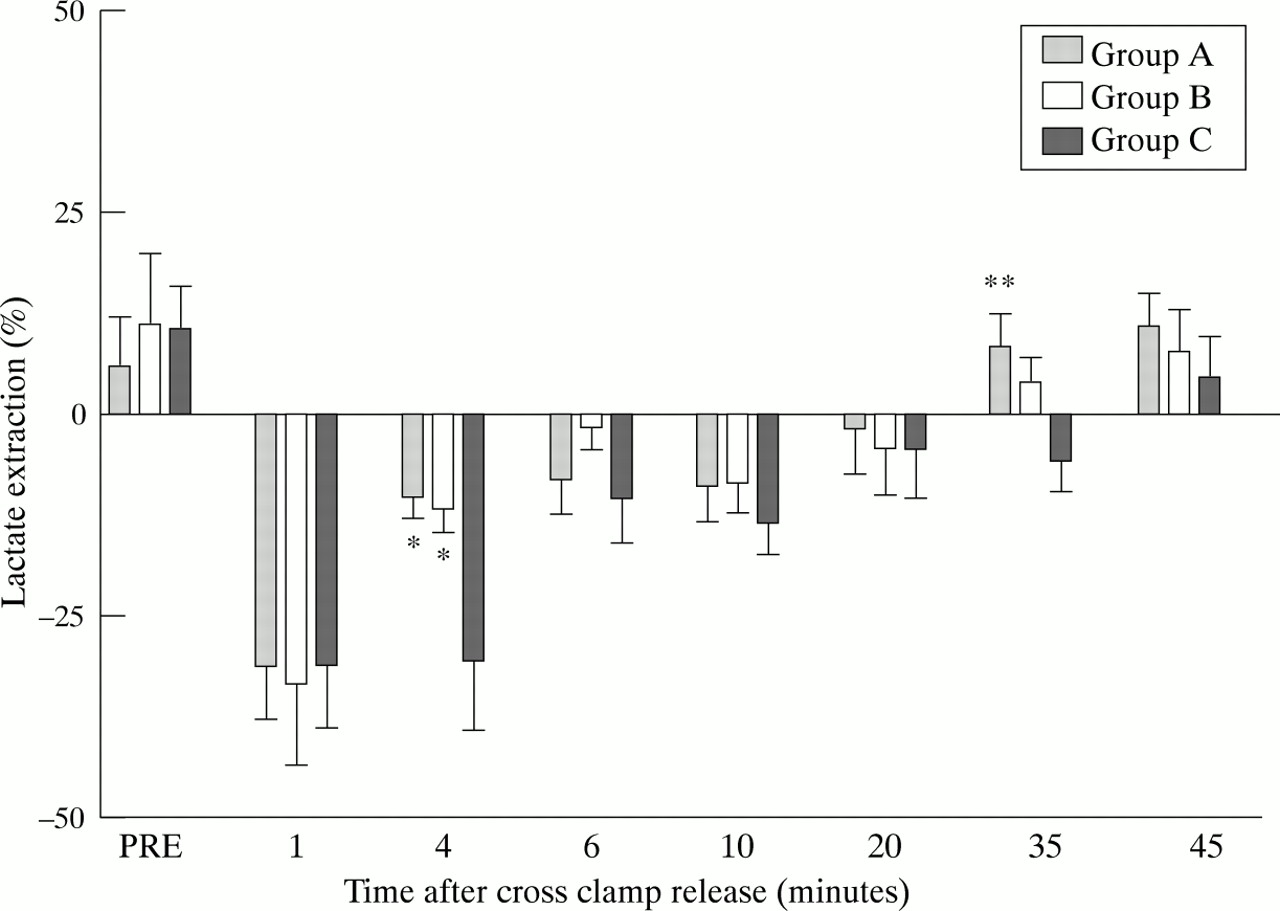
Lactate extraction in groups A, B, and C showing lower lactate production at four minutes in groups A and B v group C, and earlier reversion from production to extraction in group A at 35 minutes after cross clamp release: *p < 0.05 between group A and B v group C; **p < 0.05 between group A v group C. Data are means; error bars = SEM.
HAEMODYNAMIC DATA
Heart rate, mean blood pressure, pulmonary capillary wedge pressure, cardiac index, and left ventricular stroke work index did not differ between the groups before operation (table 4). The was a transient decline in cardiac index and left ventricular stroke work in group C but not in groups A or B, such that at three hours left ventricular stroke work index was significantly lower in group C (27 (5) g.m/m2) than in group A (34 (3.9) g.m/m2, p < 0.01) and group B (33 (7) g.m/m2, p <0.05). This difference was no longer apparent at six hours, and within 24 hours left ventricular stroke work index and cardiac index in group C had returned to baseline (table 4).
Haemodynamic data for groups A, B, and C
RELATION BETWEEN NET MYOCARDIAL TROPONIN T RELEASE AND LEFT VENTRICULAR STROKE WORK INDEX
Changes in left ventricular function after surgery are reflected in an early reduction in left ventricular stroke work index at three hours in those with longer duration of ischaemia, and in greater troponin T release, with recovery of function at six and 24 hours. In order to determine the relation between net myocardial troponin T release and left ventricular function early after operation, we correlated peak net release of troponin T with left ventricular stroke work index at three hours for all patients studied (fig 7). A strong inverse correlation was found (r = −0.57, p < 0.001).
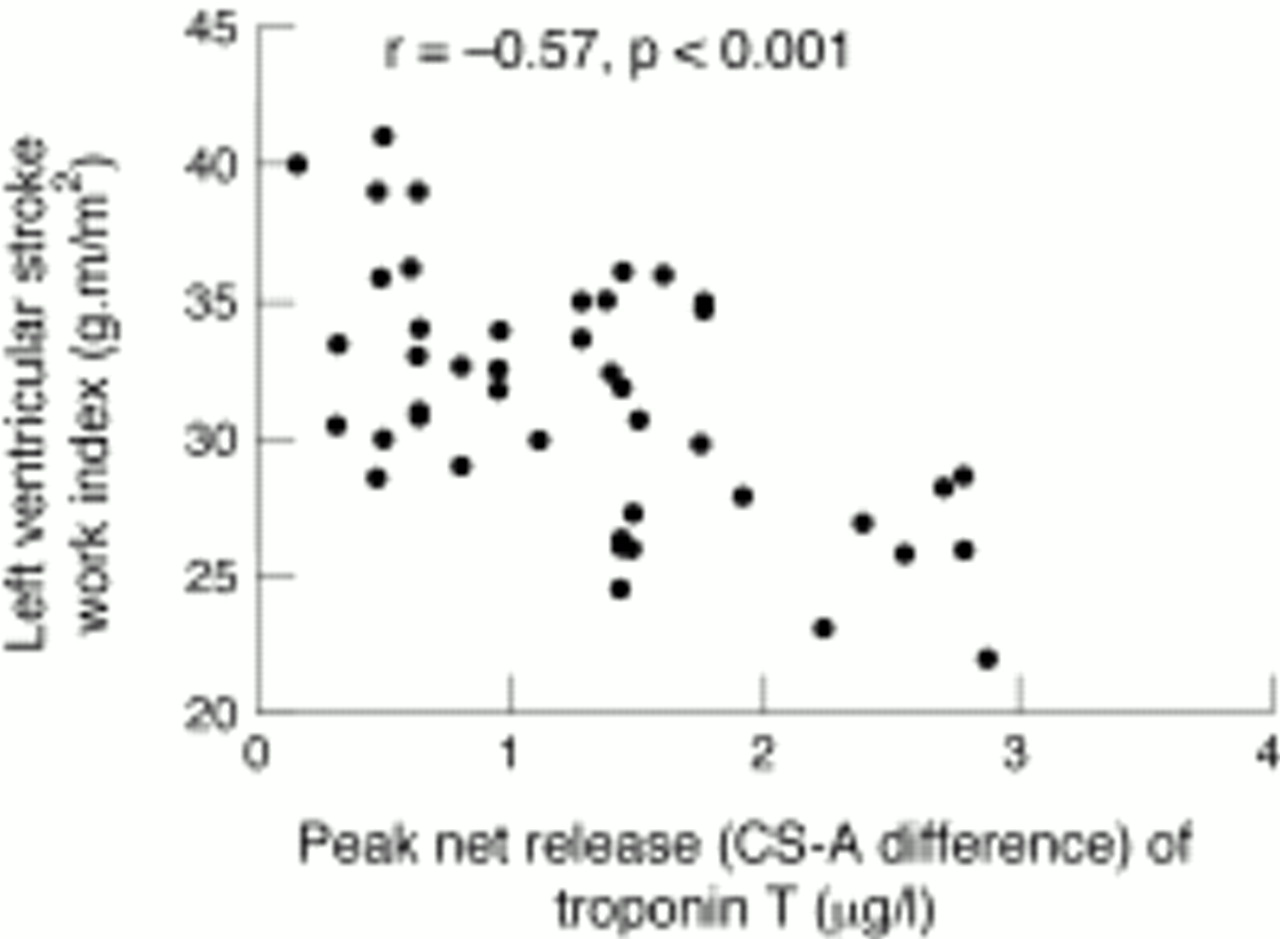
Relation between left ventricular stroke work index at three hours and peak net release of troponin T (coronary sinus–arterial, CS–A difference), showing a significant inverse correlation.
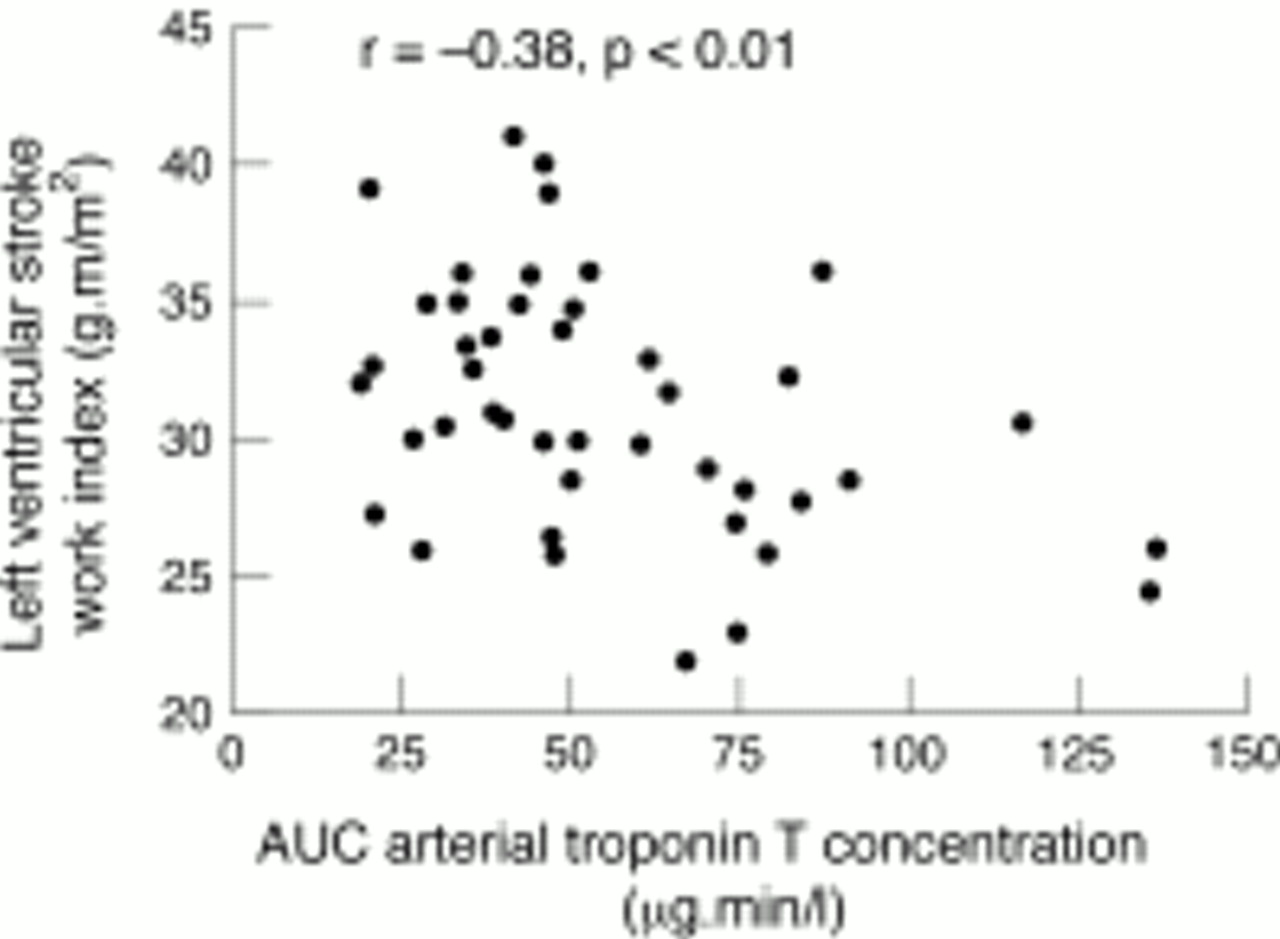
The area under the curve of arterial troponin T concentration was also significantly correlated with left ventricular stroke work index at three hours (fig 8; r = −0.38, p < 0.01).
Relation between left ventricular stroke work index at three hours and area under the curve (AUC) of arterial troponin T concentration, showing significant inverse correlation.
Discussion
The objective of coronary artery surgery is to revascularise the myocardium with optimal preservation of myocardial cell integrity and hence myocardial function. A degree of myocardial injury invariably occurs during surgery, regardless of the myocardial preservation strategy, principally during the period of myocardial arrest necessary for the surgeon to operate on the heart.3 ,13 Reducing the period of arrest during which the myocardium is subjected to ischaemia and necrosis would be one method of limiting myocardial injury, but more complex and time consuming procedures are now being performed in an older population of patients with reduced cardiac reserve. Different myocardial protection strategies have thus been introduced and compared.14-17 Accurate measurement of myocardial injury is crucial in such studies, so the lack of specificity of conventional biochemical markers such creatine kinase2 ,18 makes interpretation of their results difficult.15 ,16
Cardiac troponin T is a regulatory protein tightly bound to the tropomyosin component of the contractile apparatus of myocytes, which is released specifically after myocardial injury and is undetectable in patients undergoing non-cardiac surgery.3 Serial measurements, usually hours and days after cardiac surgery,19 have previously been used in studies comparing different myocardial preservation strategies and assessing interventions during the perioperative period.5-7 ,14 ,17However, perioperative studies using techniques such as echocardiography to assess ventricular function,20electrocardiography,21 and coronary sinus lactate22 all suggest that these early events are of significance and may influence the subsequent clinical course. Intraoperative studies using troponin T have not as yet been performed. The intraoperative setting of coronary artery surgery has the advantage that blood draining directly from the heart into the coronary sinus can be sampled. Coronary artery surgery also provides a model of myocardial ischaemia and predictable reperfusion in which to study the release kinetics of troponin T, which until now have only been assessed in the experimental setting of the isolated perfused heart.23 ,24
In our population of stable angina patients, we found no patient with troponin T concentrations greater than 0.2 μg/l before operation, a level regarded as indicating significant myocardial injury.25 Within one minute of cross clamp release, restoring coronary blood flow after a period of ischaemia, troponin concentrations were already raised in both coronary sinus and arterial blood, and increased progressively throughout the entire study period of 45 minutes. Troponin T concentrations in the coronary sinus were consistently higher than the arterial concentrations, indicating net release of troponin by the myocardium. This could not have been caused by haemoconcentration of blood drawn from the coronary sinus, because the packed cell volume of arterial and coronary sinus did not differ at any time point. The serum half life of troponin T is 120 minutes,3 ,26 so progressive increase in both arterial and coronary sinus concentration with time suggests continuing release from the myocardium within the time period studied. Thus, even in apparently uncomplicated coronary artery surgery, and despite using established methods of myocardial protection, continuing net release of troponin T could be demonstrated during the entire 45 minute study period after cross clamp release.
Electrocardiography and serial troponin T and CK-MB estimation up to 72 hours showed that no patient sustained perioperative myocardial infarction. The pattern of troponin release in coronary sinus and arterial blood that we observed occurs in uncomplicated coronary artery surgery, and might therefore serve as a baseline for further studies of intraoperative troponin T release in other forms of cardiac surgery. By sampling in the period immediately after restoration of coronary blood flow, it may be argued that the initial washout of troponin T at this early stage would limit its usefulness in quantifying myocardial injury. However, early troponin T concentrations—particularly net troponin T release and its area under the curve—correlate with the duration of ischaemic arrest. Area under the curve of arterial troponin T concentration was also found to be correlated with ischaemic time, although less precisely. Our results are thus compatible with two previous studies, in which troponin T concentrations in the peripheral venous blood at considerably later time points, one and four days after cardiac surgery, were also found to be significantly correlated with ischaemic time.3 ,13
Patients in group C with the longest cross clamp times (> 72 minutes) released disproportionately more troponin T than both the short (group A, < 50 minutes) and intermediate (group B, 51–71 minutes) cross clamp time groups. No difference in troponin T was found between the intermediate and short cross clamp time groups. Group C also differed from groups A and B in the time course of lactate metabolism and in recovery of left ventricular function. A period of warm reperfusion before cross clamp release (hot shot) has been shown to accelerate metabolic recovery,27 but despite its use, we still found greater and prolonged lactate production in group C. There was an early decline in left ventricular function at three hours after operation in group C but not in groups A and B. Although reducing the cross clamp time required for coronary artery surgery to a minimum should be the aim of the cardiac surgeon, it would seem prudent to limit the duration of ischaemia to less than 72 minutes if surgical circumstances allow, since we have shown that such patients have disproportionate myocardial release of troponin T, delayed recovery of oxidative metabolism, and early decline in left ventricular function, compared with those who have shorter cross clamp times.
LIMITATIONS
Our study has limitations. Changes in coronary blood flow—which were not measured—may affect release of troponin T and CK-MB. It is unlikely that such changes during the reperfusion period studied, which would be relatively small,28 would alter our main conclusions. Furthermore, all the patients were completely revascularised and if markers were affected to a large degree by fluctuations in coronary flow, we would not have found a close correlation between ischaemic time and coronary sinus troponin T release. Intraoperative levels of troponin T reflecting early release are often lower than those of serial daily samples, but the increases in troponin T concentrations we observed were well within the reproducibility of the assay. Coronary sinus sampling allows direct sampling of the blood draining the heart, and the arteriovenous difference thus calculated provides the closest correlation between troponin T release and ischaemic time. Since this technique may not be widely practised, analysis of the area under the curve of troponin T concentration in peripheral (arterial) blood, which is easily obtained, was also shown to be correlated with ischaemic time and inversely related to left ventricular function, although to a lesser extent. We were limited to leaving the coronary sinus catheter in situ for 45 minutes after cross clamp release, at a time when troponin T release was still continuing, and therefore the area under the curve for the entire time course of troponin T release was not derived. Further studies over a longer time scale and in higher risk patients seem warranted.
Experimental and human studies29 both suggest that reperfusion of myocardium may itself lead to myocardial injury, and we cannot exclude any contribution from reperfusion induced injury to the early release of troponin we observed. Both components, however, will contribute to clinical risk. In the present study the patients were at low risk of adverse clinical events, so the design was inappropriate to investigate any relation between troponin T release and adverse clinical outcome.
CONCLUSION
In summary, troponin T concentrations obtained intraoperatively were consistently higher in coronary sinus blood than in arterial blood, indicating net troponin T release, throughout the period of the study. Peak net troponin T release, area under the curve of net troponin T release, and to a lesser extent the area under the curve of arterial troponin T concentration, all correlated with ischaemic time. When ischaemic time was longer, greater troponin T release suggested slower recovery of both left ventricular function and oxidative metabolism. Net release of troponin T and area under the arterial concentration curve also had functional significance in that they were inversely related to left ventricular stroke work index at three hours. Our findings may have clinical relevance in that intraoperative studies of troponin T release and its kinetics provide important additional information for assessing myocardial protection strategies, especially in high risk patients with pre-existing impaired cardiac function.
Acknowledgments
We are grateful to Deborah Redout, department of medical statistics, Hammersmith Hospital for statistical advice. TWK is supported by a British Heart Foundation Junior Research Fellowship.