Article Text

Abstract
OBJECTIVES To review the New Zealand coronary artery bypass priority score instituted in May 1996, and specifically to determine whether it prioritises patients at high risk of cardiac events while waiting. The New Zealand score is compared with the Ontario urgency rating score, and waiting times for surgery are compared with the maximum times recommended by the Ontario consensus panel.
DESIGN Retrospective review of patients accepted for isolated coronary artery bypass surgery between 1 January 1993 and 31 January 1996.
SETTING Green Lane Hospital, Auckland, New Zealand.
MAIN OUTCOME MEASURES Waiting time, cardiac death, myocardial infarction, and cardiac readmission.
RESULTS The median waiting times were five days for hospital cases (n = 721) and 146 days for out of hospital cases (n = 701). Of the latter group, 28% waited more than a year, 33% had their surgery expedited because of worsening symptoms, and 19% failed to meet the cut off point set by the New Zealand score for acceptance onto the list. Twenty two patients died, 18 on the outpatient waiting list (waiting list mortality 2.6%, risk 0.28% per month of waiting), and 132 were readmitted, 12% with myocardial infarction and 76% with unstable angina. Risk factors for a composite end point of death or myocardial infarction and/or cardiac readmission were: previous coronary artery bypass surgery (p = 0.001), class III or IV angina (p = 0.002), and hypertension (p = 0.005). The New Zealand score did not identify those at risk. Excluding hospital cases, 32% had surgery within the time recommended by the Ontario consensus panel.
CONCLUSIONS Waiting times for coronary artery bypass surgery in New Zealand are considerably longer than those in Ontario, Canada. By using a numerical cut off point, implementation of the New Zealand priority scoring system has restricted access to coronary surgery on the basis of funding constraints rather than clinical appropriateness. The score does not add greatly to the clinicians’ prioritisation in predicting those patients who will suffer events while waiting.
- coronary artery bypass surgery
- prioritisation
Statistics from Altmetric.com
Despite its proven efficacy, the rates of coronary artery bypass surgery vary considerably between, and often within, countries. In New Zealand, a country with a high incidence of ischaemic heart disease,1the rate of coronary artery bypass surgery was static in the early 1990s, the 1993 rate being 330 per million population. This compares with 1993 figures of 400 per million in the United Kingdom, 750 per million in Canada, 970 per million in Australia, and 1300 per million in the United States. A waiting list initiative resulted in a short term injection of funds, which increased the 1996–97 rate to 430 per million. However, this rate is not considered sustainable in the long term in the absence of ongoing increases in funding.
Faced with increasing medical advances and finite resources, health services that offer universal access have been forced to ration those services.2 This has meant waiting lists and long waiting times for many procedures. In this context it is important that such waiting lists are managed in an equitable and explicit manner.3 ,4 Traditionally, patients have been informally prioritised by clinicians, generally on the basis of need and ability to benefit. Recently there has been a move to make such decisions more explicit in the belief that such transparency will ensure fairness and consistency of prioritisation, while allowing comparison of waiting times across regions.5
In 1990, Naylor et al produced an urgency rating scale (the Ontario score) to prioritise patients on Canadian waiting lists for coronary artery bypass surgery.6Appropriateness and urgency were seen as quite different issues. Appropriateness—that is, potential to benefit—had been investigated by modified Delphi consensus panels in both the United States and the United Kingdom.7 The Ontario score set out to rank the urgency—that is, the appropriate timing of surgery—in patients in whom coronary artery bypass surgery had been deemed appropriate by their physicians. A fundamental assumption was that those at the greatest temporal risk of cardiac adverse events while waiting deserved priority over those at lower risk.8 Earlier work by the Ontario group had established that the risk of death from delayed coronary artery bypass surgery—termed the vital risk—varied from 1% per month for high risk groups to 0.33% per month for those at lower risk.
In response to lengthy waiting lists for elective surgical procedures, the New Zealand government commissioned the development of prioritisation scores, including one for coronary artery bypass surgery.9 Developed by a professional advisory committee, the score awarded points for a range of variables, and access onto the list was restricted by the government to those patients who scored at least 35 points.
In this study of patients accepted for isolated coronary artery bypass surgery at the largest centre in New Zealand between 1993 and 1996, we investigated whether the New Zealand score adequately prioritised patients according to the risk of death and cardiac events as an urgency rating scale in a similar way to the Ontario score.
Methods
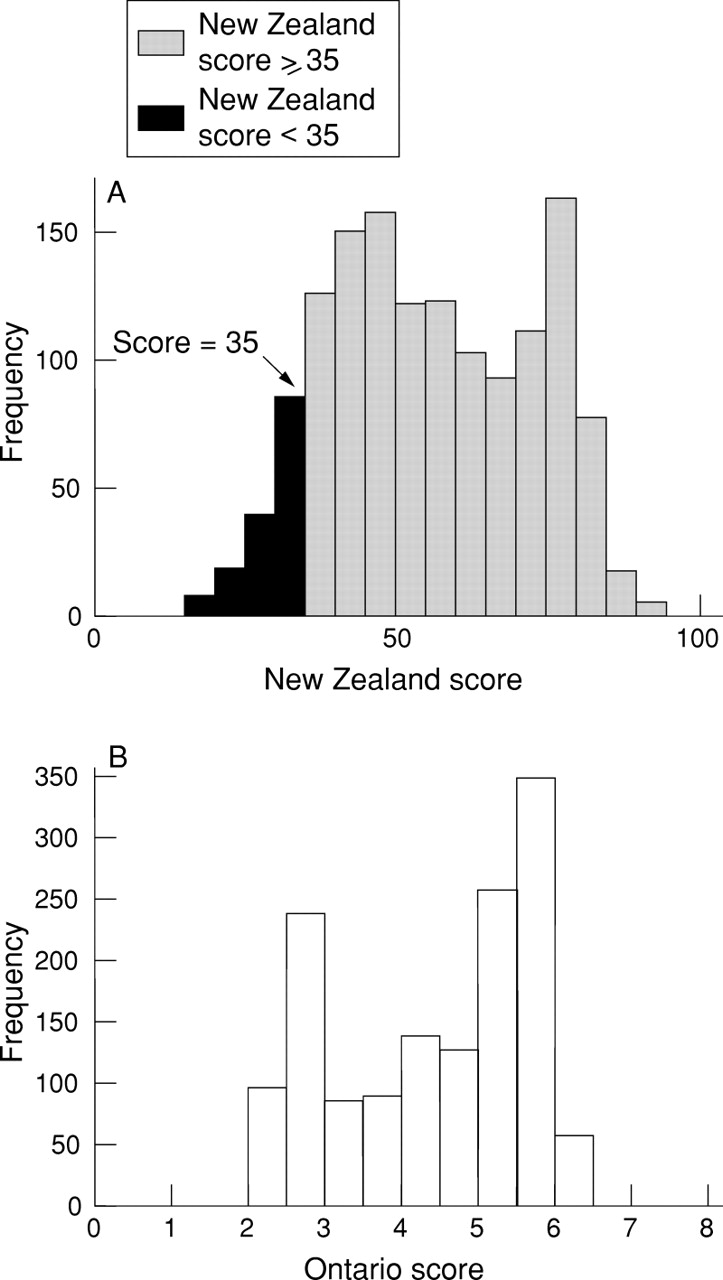
All patients referred for isolated coronary artery bypass surgery between 1 January 1993 and 31 January 1996 were included in the study. Waiting time was defined as the time between the date they were accepted onto the waiting list and the date of surgery, removal from the list (including death), or 1 January 1997 if the procedure had not yet been performed. Waiting times were assessed in relation to the maximum acceptable times described by the Ontario consensus panel (table 1).6 The case records of 1422 patients were reviewed. Information available at the time of referral was used to assign both a New Zealand and an Ontario score to each patient (fig 1).
Rating scale accepted by the Ontario panel

Distribution of patients according to (A) the New Zealand score and (B) the Ontario score.
PRIORITY SCORES
For many years, patients referred for coronary artery bypass surgery have been discussed at a weekly cardiosurgical meeting where a decision is made regarding acceptance onto the waiting list. Once accepted they are prioritised into four categories (the “clinicians’ classification”): (1) urgent, in hospital; (2) urgent, waiting at home; (3) semi-urgent; and (4) routine. Patients in groups 2 to 4 are defined here as waiting on the outpatient list for surgery.
The New Zealand score was introduced in May 1996, and since that time patients have been accepted onto the list only if they score ⩾ 35 points (table 2).
Components of the New Zealand priority score 9 (maximum score 100)2-150
The New Zealand score uses a higher value to designate those with the highest priority, whereas the Ontario score works in the opposite direction, with priority inversely related to numerical score (table3).
Ontario score
CLINICAL DATA DEFINITIONS
The severity of angina was categorised according to the modified Canadian Cardiovascular Society classification.6 Coronary artery diameter stenoses were graded in native and/or grafted vessels. Under the Ontario scoring system, a diameter loss of 50% in the left main stem or 70% in all other arteries was deemed significant. Five categories of anatomical disease were defined for the purposes of the Ontario score (table 3).
Seventeen categories were recorded for the New Zealand score, based on the Duke coronary artery prognostic index.10 The proximal left anterior descending artery was defined as that portion proximal to the origin of the first septal branch.11
The left ventricular ejection fraction was calculated angiographically from the right anterior oblique projection. Exercise tests (Bruce protocol) were categorised as: (1) extremely positive if the test was stopped in the first stage because of ischaemic symptoms, ST depression of ⩾ 2 mm or hypotension; (2) very positive if stopped in stage 2; (3) positive if limited to stage 3; and (4) mildly positive or negative if the test continued beyond this point. Patients with unstable angina who did not have an exercise test were classified in the extemely positive group.
CARDIAC EVENTS
Data on cardiac readmissions and survival were obtained by review of the case records and by accessing the national hospital index database. If there was no clear evidence of a patient’s status, his or her general practitioner was contacted and, if necessary, the national registry of births, deaths, and marriages. Myocardial infarction was identified from the clinical case notes using the World Health Organisation criteria (two of the following three factors: ⩾ 30 minutes of ischaemic symptoms; evolving ECG changes; or a rise in cardiac enzymes to at least twice normal).
STATISTICAL ANALYSIS
The key continuous variable analysed was waiting time. Waiting time analysis included those who underwent surgery (n = 1161), those removed from the list (n = 175), those who died waiting (n = 21), and those still waiting as of 1 January 1997 (n = 65). The distribution was skewed and the non-parametric Mann-Whitney test was therefore used, with medians and interquartile ranges (IQRs) presented. Where outcomes were normally distributed, comparisons were made using unpaired t tests, with means and standard deviations presented.
Categorical variables were compared using the χ2 squared test (Yate’s correction where appropriate).
Stepwise logistic regression was used to investigate possible predictors of death, myocardial infarction or readmission using the following factors: presence of left main stenosis; three vessel disease; class III or IV angina; hypertension; diabetes; previous myocardial infarction; previous coronary artery bypass surgery; and a New Zealand score of ⩾ 35.
Results
A total of 1590 patients were listed for coronary artery bypass surgery between 1993 and 1996, of whom 116 were excluded (108 concomitant valve operations, six aneurysmectomies, one right ventricular ablation, and one myomectomy). A further 52 (4%) had limited data available (there were no deaths in this group) and they were excluded from subsequent analysis, leaving a total of 1422 patients. Taken together, this group had a mean age of 62.5 years, 312 (22%) had left main stenosis ⩾ 50%, 1123 (79%) had either left main or three vessel disease, and 768 (54%) had unstable angina.
WAITING TIMES
Seven hundred and twenty one patients (51%) were recommended to undergo surgery as hospital cases, and waited a median of five days (IQR 2 to 7). Their baseline characteristics are compared with those of the outpatient waiting list patients in table 4. The median waiting time of the 701 patients on the outpatient list was 146 days (IQR 42 to 440), with 193 (28%) waiting more than a year. Sixty five patients were still waiting as of 31 January 1997, and their median waiting time was 721 days. The median waiting time for those with left main stenosis (n = 105) was 63 days (IQR 24 to 152).
Baseline characteristics
WAITING BY PRIORITY SCORE
The median waiting times are illustrated in table 5. Overall, 54% of patients had surgery within the times recommended by the Ontario panel; 75% of hospital patients and 32% of those waiting on the outpatient list. Two hundred and thirty four patients (33%) had their original clinicians’ classification upgraded because of worsening symptoms.
Waiting times stratified by scores
Of the 502 outpatients (72%) prioritised by the clinicians as urgent, 14% scored < 35 on the New Zealand score, 50% scored between 35 and 54, 32% scored between 55 and 74, and 3% scored > 75 points. Overall, 133 patients (19% of those on the outpatient list) scored < 35 points.
DEATHS ON THE WAITING LIST
Twenty two patients died while awaiting surgery, including one non-cardiac death after waiting 357 days (removed from further analysis). Eighteen died while waiting out of hospital (two of whom scored < 35 points) and eight (38%) died within three months of being placed on the list, with the risk of death being 0.28% per month of waiting. The patients who died had similar characteristics to those of the total group waiting out of hospital (n = 683), though there was a trend towards a lower left ventricular ejection fraction (mean 58.0% v 65.3%; p = 0.15). Of the patients who died, 75% had class III or IV angina compared with 66% of those who survived (p = 0.44). The New Zealand and Ontario priority scoring systems did not differentiate between patients who died while waiting and those who did not.
There were six perioperative deaths and 18 deaths on the outpatient waiting list. These numbers were too few to evaluate the possibility that deaths on the outpatient list might represent patients at higher perioperative risk.
CARDIAC READMISSIONS
There were 132 cardiac readmissions, 16 (12%) with myocardial infarction and 100 (76%) with unstable angina. The risk of readmission was 2% per month of waiting, and for those readmitted the risk of death was 0.98% per month. Compared with patients not readmitted while waiting, significant risk factors for readmission were: severity of angina, with increased proportions of class III or IV (79%v 63%; p = 0.001), and previous coronary artery bypass surgery (21% v 9%; p < 0.001). Those who were readmitted had shorter median waiting times (87 v 152; p = 0.002), with 108 (77%) having their surgery expedited as a result of worsening symptoms. The operative mortality among this group was 1.85% compared with 1.16% (p = 0.56) among those who had their surgery electively. Excluding operative deaths, the mortality of patients who were readmitted was 6.1%. Neither the New Zealand nor the Ontario score predicted readmission.
COMPOSITE END POINT: DEATH, MYOCARDIAL INFARCTION, OR READMISSION
One hundred and forty two patients who had the composite end point of death, myocardial infarction, or readmission were compared with all others (n = 559) (table 6). The risk of a cardiac related event was 2.2% per month of waiting, shown in table 7 according to different priority categorisations. Logistic regression identified three predictors of the composite end point: severity of angina (p = 0.002); hypertension (p = 0.005); and previous coronary artery bypass surgery (p < 0.001) (table8).
Comparison of baseline characteristics of patients with the composite end point and all others waiting out of hospital
Risk per month of the composite end point* as a function of the priority score
Significant factors in logistic regression of predictors of the composite end point*
Discussion
The New Zealand score was introduced to make explicit the rationing of coronary artery bypass surgery necessitated by funding restrictions. The cut off point for access to coronary artery bypass surgery was set by the New Zealand government at 35 out of a possible 100 points. This was arrived at by taking the current funding available for coronary artery bypass surgery and dividing this by the average cost of the operation.9 Over and above the methodological concerns of using the average rather than the marginal cost of coronary artery bypass surgery, this approach means that in effect the level of funding dictated the cut off point for acceptance onto the list, rather than evidence of clinical need or projected benefit. This can be seen by the gap between the “clinically agreed” threshold of 25 points arrived at by the advisory committee and the 35 point threshold that was eventually imposed. Concern that the priority score would be used to specify arbitrary cut off points below which surgery would not be funded was expressed by many clinicians when the system was proposed.9
The government recommended that patients with priority scores of < 35 be referred back to their general practitioner, and these patients no longer appear in waiting list statistics. At the time of its introduction this meant that just over 50% of those waiting nationally (351 of 662) were eligible for removal from the waiting list.9 Thus the cost of caring for these patients was shifted from the tertiary to the primary sector, making the waiting lists appear more manageable. There has also been an impact on the private sector, traditionally a small component of surgery in New Zealand. Overall, 12% of patients accepted onto the list subsequently opted to have private surgery. With restricted access to a publicly funded service, it seems likely that this proportion will increase further.
WAITING TIMES
Waiting lists for coronary artery bypass surgery are inevitable in a restricted, publicly funded health system, as demand for this effective procedure outstrips capacity. The median waiting time on the outpatient list was 146 days (IQR 42 to 440 days), with nearly a third of patients waiting more than a year. The baseline characteristics of the patients in our study confirm a conservative referral system. When compared with the Ontario data,12 the 1422 Green Lane Hospital patients were more likely to have unstable angina (55%v 39%) or left main disease (22%v 15%), and 79% had either left main stem or three vessel disease. These data do not support the argument13 that long waiting lists in New Zealand are the result of mild cases being accepted onto the list. The waiting times were prolonged for all out-of-hospital groups, with only 32% receiving their surgery within the time recommended by the Ontario consensus panel.6
The prospective Ontario study by Naylor et al involving 8517 patients undergoing isolated coronary artery bypass surgery, showed a median wait for all patients of 17 days (IQR 4 to 51), ranging from one day (IQR 1 to 4) for very urgent cases to 42 days (IQR 18 to 77) for those rated low priority.12Overall, 79% of their patients underwent surgery within the recommended times. A five year retrospective study of 3453 patients in the United Kingdom14 reported median waiting times of 147 days (excluding in-hospital priority patients), similar to our experience.
A questionnaire based study published in 1995,15 comparing the waiting times for coronary artery bypass surgery in four countries, again puts the New Zealand waiting times in an international context. Directors of cardiac surgical units were given two case scenarios and asked how long it would take to obtain a coronary artery bypass operation. Waiting times for the first scenario were shorter in the United States, where all the respondents indicated that they could provide the surgery in < 3 months, and longest in the United Kingdom, where only 11% felt that they could. This scenario—a 55 year old man with class II angina, a positive exercise test, a 75% proximal left anterior descending artery stenosis, and a 70% stenosis of the dominant right coronary artery—would score only 22 points on the New Zealand priority score (or 33 points if his ejection fraction was < 35% and his ability to work and live independently were more difficult but not threatened). Such a patient would therefore not be offered publicly funded surgery in New Zealand.
EVENTS WHILE WAITING
The total mortality on the waiting list was 2.6% excluding hospital patients, 6.5 times that of the Ontario study. The overall mortality rate of 0.28% per patient month of waiting was similar to that of low risk Ontario patients (0.33%), but we cannot exclude a higher rate in the early months after placement on the waiting list. A significant proportion (19%) of patients waiting at home were readmitted, the majority (76%) with unstable angina, and 12% with myocardial infarction. Eight patients (6%) died during their readmission, and surgery was expedited in 102 of those readmitted (77%) because of increasing and unstable symptoms. The risk of death for those patients requiring readmission was high at 0.98% per month. Readmission was associated with significant morbidity and mortality, representing both a personal and economic cost of delayed surgery. Three clinical factors were found to be predictive of the composite end point of death or myocardial infarction and/or readmission: class III or IV angina, hypertension, and previous coronary artery bypass surgery. The last two factors are not included in the New Zealand score, and the score did not predict those patients who were likely to be readmitted.
It was not possible to determine whether the waiting list was acting as a filter, with those dying while waiting being the same patients who would have died in the postoperative period, because of the low (1.3%) perioperative mortality among patients who had waited for surgery on the outpatient list.
PRIORITISATION SYSTEMS
Many countries are now grappling with the problem of managing waiting lists in an equitable and explicit manner, so that those with the greatest need and/or greatest potential benefit receive their surgery first. The Swedish Priorities Commission recently published three ethical principles in relation to its programme: human dignity, need and solidarity, and cost efficiency (in that order). They rejected any link to chronological age and prioritisation systems based on economic capacity.16 Factors considered important in the prioritisation process for coronary artery bypass surgery have been published for both the Ontario and the New Zealand scores. The major urgency determinants identified by the Ontario consensus panel were the severity and stability of angina symptoms, coronary anatomy, and non-invasive studies of ischaemia. This group also identified maximum recommended waiting times for each strata of their scoring system. The New Zealand score includes the same three determinants, though less weight is given to angina severity and proportionally more to non-invasive exercise stress testing, and adds a subjective measurement of “ability to work, care for others, or to live independently”. It discriminates against those over 70 years by adding a negative weighting to the final score. The Ontario group studied the influence of such “social” factors on clinicians’ informal prioritisation,17 called for the influence of these factors to be debated from an ethical perspective, and did not include them in their score.
Previous studies have shown that impaired left ventricular function is a predictor of mortality.18 ,19 As only 188 patients (17%) of those accepted for surgery in our study had left ventricular ejection fractions of < 50%, this precluded determination of whether impaired left ventricular function impacted on the risk of death while waiting for surgery.
There are a number of positive aspects of health care rationing using explicit criteria, including the ability to ensure equity of access to care in different regions, but the New Zealand prioritisation score has limitations. Firstly, there is at present no national plan to assess the clinical outcome of those patients who fail to reach the funding level and are removed from the list. Secondly, the cut off point for access is rigid and supersedes clinical judgment, which is at odds with the ethos of guidelines. Thirdly, the ethical implications of including social factors in the score (such as discrimination on the basis of age) have not been adequately debated, and are opposed by a number of cardiologists. Fourthly, there are economic issues. Basing the number of operations that could be afforded on the average cost of a coronary artery bypass procedure, rather than the marginal cost, is flawed, and the introduction of the score fails to address the cost effectiveness of timely surgery. Finally, exclusion of patients who score < 35 points may shift costs to the primary sector, without making any savings in the health sector as a whole.
LIMITATIONS
This study had several limitations. It is a retrospective study, which limits the type of data available. We were unable to focus on quality of life measures; however, 76% of the patients had class III or IV angina and are therefore likely to have been severely restricted by their symptoms. Psychological aspects of prolonged waiting periods were also not examined, but are known to be important.20Our study also had a narrow definition of waiting time, and did not include the time that patients waited first to see a specialist, and second to have angiography. A detailed cost effectiveness evaluation was outside the scope of this paper.
CONCLUSIONS
This study confirms the long waiting times for coronary artery bypass surgery in New Zealand. It shows that the risk of death while waiting is 0.28% per month of waiting. However, there were certain groups at significantly higher “vital risk”, particularly those who were readmitted, which was not reflected in the New Zealand priority score. Furthermore, the rate of cardiac readmission was high, and factors predictive of this event did not appear in the New Zealand score.
The New Zealand score was introduced to make explicit the criteria for rationing this service, based on the available funding. This will make it more difficult to obtain information as to the extent of unmet need in the future. While many clinicians welcome explicit prioritisation guidelines, we have outlined a number of problems with this score, including methodological, economic, and ethical concerns.
The score did not prioritise patients more accurately than the clinicians’ assessment according to their risk of cardiac events. This may be because the patients studied had already been prioritised by the informal clinicians’ criteria, with those who had known predictors of risk being prioritised to the urgent in-hospital group, or because regular outpatient review and expeditious upgrading of priority weakened the analysis of potential predictors of risk.
Further review of patient outcomes, particularly in those patients who score < 35 points and who are removed from the coronary bypass waiting list, is required.
Acknowledgments
This work was supported in part by a grant from the Health Research Council of New Zealand. We thank Dr Toby Whitlock for his assistance in statistical analysis, and the cardiologists and cardiothoracic surgeons at Green Lane Hospital for providing the clinicians’ classification of these patients.