Article Text

Abstract
OBJECTIVE To validate the accuracy of the prognostic significance of non-invasive clinical diagnostic indices as predictors of sustained ventricular tachycardia (sVT) or fibrillation (VF) in patients undergoing repair for tetralogy of Fallot.
METHODS One way analysis of variance and pairwise comparison of the values with the Bonferroni correction, logistic multivariate analysis, and ordinal logistic analysis were used to study quantitative electrocardiographic and echocardiographic variables in 66 patients who had undergone surgery for tetralogy of Fallot by ventriculotomy at a mean (SD) age of 11.8 (9.5) years. The mean (SD) period of follow up was 16.1 (5.7) years after surgery.
RESULTS Four groups of patients were identified by ECG and 24 hour Holter monitoring: 19 (28.7%) without ventricular arrhythmias, 34 (51.5%) with minor ventricular arrhythmias, seven (10.6%) with non-sustained ventricular tachycardia (nsVT), and six (9.0%) with sVT or VF. One way analysis indicated significant differences in QT dispersion (QTd) and end diastolic volume of the right ventricle (EDVRV) among the groups. Univariate logistic analysis showed EDVRV, QTd, and QRS duration to be significantly associated with sVT or VF. Stepwise multivariate analysis and ordinal logistic analysis showed QTd to be preferable to QRS duration as an indicator, because it was unrelated to EDVRV, and was capable of separating different probability curves for nsVT as opposed to sVT or VF.
CONCLUSIONS Stratification of patients undergoing corrective surgery for tetralogy of Fallot and at risk of life threatening arrhythmias is possible by simple and inexpensive means, which provide sensitive and specific indices.
- ventricular tachycardia
- sudden death
- tetralogy of Fallot
Statistics from Altmetric.com
Sudden death occurs occasionally during late follow up of patients who have undergone repair of tetralogy of Fallot, and is usually related to electrical ventricular instability.1 Stratification of patients at risk of life threatening arrhythmias is therefore mandatory in clinical follow up, ideally by means of sensitive and specific predictive indices, which are easy and inexpensive to obtain.
The aim of this study was to assess the accuracy of the prognostic significance of several electrocardiographic (ECG) and echocardiographic variables which might predict severe ventricular arrhythmias and sudden death in patients with tetralogy of Fallot who have undergone surgical correction.
Methods
At the Cardiology Division of the University of Padua, we studied a group of 66 patients who had undergone surgery for tetralogy of Fallot between 1960 and 1993. They were chosen because they had satisfactory surgical results in terms of residual intracardiac shunting (QP/QS < 1.5 ) and right ventricular pressure (< 40 mm Hg), as determined by cross sectional and Doppler echocardiography or haemodynamic studies, an ability index of not more than 2, and were being followed annually in our clinic with standard ECG, 24 hour ECG recording (Holter), signal averaged electrocardiography, and cross sectional and Doppler echocardiography. All patients received a right infundibular ventriculotomy at a mean (SD) age of 11.8 (9.5) years (median 7.5).
The mean period of follow up was 16.1 (5.7) years after surgery (median 16 years).
We collected information on the following postoperative variables: duration of post-surgical follow up (years); age at surgery (years); type of ventricular arrhythmia; QRS duration (ms); QT and QTc intervals (ms); JT and JTc intervals (ms); QRS, QT and QTc, and JT and JTc dispersion (QRSd, QTd and QTdc, JTd and JTdc, respectively) (ms); signal averaged electrocardiography (QRS 40 Hz (ms), LAS 40 Hz (ms), RMS 40 Hz (μV)); late potentials (present or absent); end diastolic volume of the right and left ventricles (EDVRV and EDVLV) (ml/m2); and ejection fraction of the right and left ventricles (EFRV and EFLV) (%).
Maximum QRS width in any lead of surface electrocardiogram was measured manually from the first to the last sharp vector crossing the isoelectric shape for two consecutive cycles. The QT intervals were calculated from the onset of the QRS complex to the end of the T wave by means of a tangential method. The JT interval was measured from the end of the QRS complex to the end of the T wave defined as the point where the T wave returned to the isoelectric baseline. The U wave was included only if its amplitude was more than 50% of the preceding T wave amplitude. Bazett’s formula was used to obtain rate corrected values of the QT and JT intervals and dispersion. QRSd, QTd and QTdc, and JTd and JTdc were defined as the difference between the maximum and minimum QRS, QT and QTc, and JT and JTc intervals occurring in any of the 12 leads, and were measured manually by two observers unaware of the arrhythmic status of the patients. Late potentials in this population were considered positive when at least two measurements exceeded the normal limits based on the 90th centile values of 23 healthy unoperated subjects with right bundle branch block matched for age and sex, who served as the control group for all electrical and morphofunctional indices.
At cross sectional echocardiography the following variables were calculated: EDVRV (ml/m2) according to biplane Simpson’s rule; EFRV (%); EDVLV (ml/m2) calculated by the monoplanar method of Green; and EFLV (%).
STATISTICAL ANALYSIS
Statistical analysis data were expressed as mean and standard deviations (SD). Quantitative ECG and echocardiographic variables were classified according to the ventricular arrhythmic status and evaluated with one way analysis of variance (anova) and pairwise comparison of the mean values with the Bonferroni correction.2
Logistic multivariate analysis of the determinants of the presence or absence of sustained ventricular tachycardia (sVT) or ventricular fibrillation (VF) was subsequently supplemented by an ordinal logistic analysis of the same determinants versus the entire spectrum of ventricular arrhythmias (absent, minor arrhythmias, non-sustained ventricular tachycardia (nsVT) and sVT, or VF), assuming proportional effects.3
Results
According to the severity of ventricular arrhythmias, recorded on routine 24 hour Holter monitoring during clinical follow up or on the ECG in the emergency room (four cases of sVT or VF), four groups of patients were identified: 19 patients (28.7%) who did not have arrhythmias; 34 (51.5%) who had isolated ventricular extrasystoles and couplets (minor arrhythmias); seven (10.6%) with nsVT (three or more consecutive ventricular beats lasting less than 30 seconds at a rate > 120 beat/min); and six (9.0%) with sVT (consecutive ventricular beats lasting more than 30 seconds causing cardiovascular collapse with loss of consciousness and requiring intervention for termination) or VF (three patients).
In patients who had sVT or VF (table 1) we analysed the last electrocardiogram and echocardiogram before the onset of this severe clinical event. None of these patients was undergoing antiarrhythmic treatment. The baseline ECG showed sinus rhythm with right bundle branch block pattern in all patients.
Patients with sustained ventricular tachycardia: clinical, electrocardiographic, and echocardiographic quantitative ventricular data
The mean values and standard deviations of ECG, signal averaged electrocardiography, and echocardiographic variables in normal subjects and in patients with different arrhythmias are summarised in table 2. Significant differences were found between mean values of QRSd, QTd, JTd, and JTdc of the normal control group and patients with repaired tetralogy of Fallot. Furthermore, one way anova showed significantly higher average values of EDVRV (table 3) and QTd (table4) in patients with sVT or VF. QRS duration was longer in patients with sVT or VF (table 5) but the difference among the groups was not significant, neither was there a significant difference between patients with sVT or VF and those without arrhythmias. QRSd was greater in patients with nsVT than in the other arrhythmic groups, at 47.5 (12.58) v 37.6 (13.9) ms (p = 0.08). JTd showed a non-significant increasing trend according to the severity of arrhythmias. At univariate logistic analysis EDVRV, QTd, and QRS duration appeared to be significantly associated with sVT or VF. Receiving operating characteristic (ROC) curves of QRS duration and QTd are reported in figs 1A and 1B. Areas under ROC curves (grade of sensitivity v false positive) were 0.77 and 0.78, respectively.
ECG, signal averaged ECG, and echocardiographic variables according to ventricular arrhythmias
One way analysis of variance: summary of EDVRV (ml/m2)
One way analysis of variance: summary of QTd (ms)
One way analysis of variance: summary of QRS duration (ms)

Receiver operating characteristic (ROC) curves of QRS duration (A) and QT dispersion (QTd) (B): 100% sensitivity has 65% and 41% probability of error, respectively.
Results of the ordinal stepwise multivariate logistic analysis are summarised in table 6. Results of stepwise logistic analysis of sVT or VF patients v all other cases are summarised in table 7.
Stepwise ordinal multivariate logistic analysis
Stepwise logistic analysis of patients with sVT or VF versus all other groups (patients without or with minor ventricular arrhythmias or non-sustained ventricular tachycardia)
In the analysis, QTd was shown to be preferable to QRS duration because it was unrelated to EDVRV. QRS duration, in contrast, was somewhat correlated with EDVRV (r = 0.49) (fig 2) and was therefore partially redundant. The ROC curve of the model is shown in fig 3.

Correlation between QRS duration and end diastolic volume of the right ventricle (EDVRV).

Receiver operating characteristic (ROC) curve of QTd and end diastolic volume of the right ventricle (EDVRV): 100% sensitivity has 36% of probability of error.
The final ordinal logistic analysis model to be used for predictive purposes is summarised in table 8.
Final ordinal logistic analysis model
The probability of arrhythmias of the stated grade of severity according to this model is shown in fig 4A, and is compared with the model using QRS duration instead of QTd (fig 4B). EDVRV and QTd were able to separate different probability curves for nsVT, as opposed to sVT or VF.
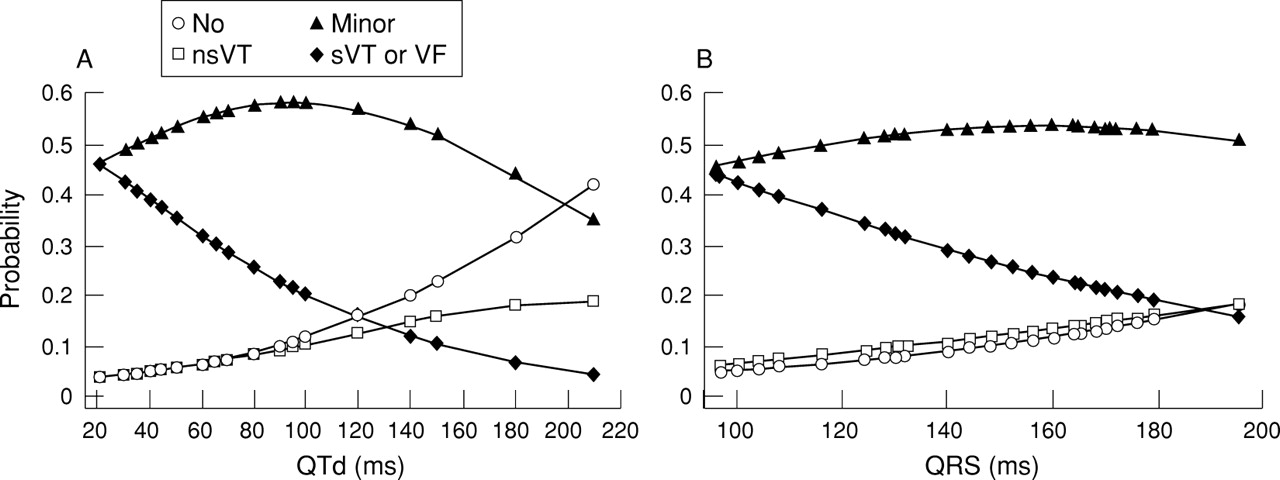
Ordinal logistic analysis. Probability distribution of ventricular arrhythmias according to QT dispersion (QTd) (A) and QRS duration (B).
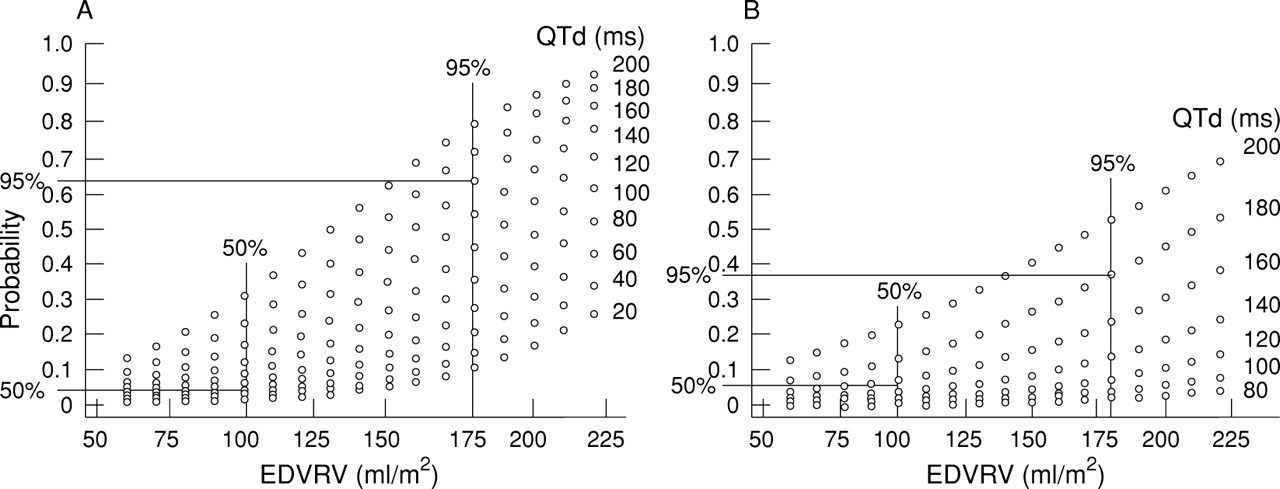
Nomographs of the probability of presenting sVT or VF are shown in fig5A and 5B according to QTd, EDVRV, and QRS duration. The estimates corresponding to the 50th centiles and 95th centiles of EDVRV and QTd or QRS duration are indicated.

Nomographs of the probability of sustained ventricular tachycardia (sVT) or ventricular fibrillation (VF) according to QT dispersion (QTd)–end diastolic volume of the right ventricle (EDVRV) (A) and QRS–EDVRV (B). Values corresponding to the 50th and 95th centiles are outlined.
Discussion
Many factors have been related to the risk of sudden death after repair of tetralogy of Fallot.4 Several of these are of minimal clinical use because the relation with sudden death is poor, or they are substitutes of more pertinent underlying factors.5 On the other hand, some important data are difficult to collect on routine examination.6 In the last 15 years, follow up of such patients has shown that ventricular arrhythmias, and particularly ventricular tachycardia, are the most important causes of sudden death.7 This electrical instability may result from anatomical modifications because of surgery or mechanical events such as ventricular dilatation and stretch.8 In these patients, particularly those operated on late (older than 5 years of age), abnormal fibrous tissue was found at different sites in the right and left ventricle.9Fibrous-fatty substitution characterises the area around the scar, the residual effect of ventriculotomy.10 All these lesions might provide substrates for local abnormalities of ventricular depolarisation and repolarisation. On the basis of these studies, it was suggested that both ECG and cross sectional Doppler echocardiography could provide useful indices for stratifying the risk of sudden death.
In relation to ECG findings, the accuracy of signal averaged electrocardiography for recording abnormalities of ventricular depolarisation non-invasively is high, and the value of this method in predicting the risk of severe arrhythmias has been documented in patients with myocardial infarction or cardiomyopathy.11In a previous study12 and in this larger series we found a statistical difference between amplified ECG parameters of patients operated on for tetralogy of Fallot with minor ventricular arrhythmias and patients with severe arrhythmias, but we did not attach clinical relevance to this because the values for the latter patients were comparable with those of the control group (normal subjects with right bundle branch block). In fact, the presence of conduction disturbances produces a longer duration of the filtered QRS and modifications of terminal signals.13
We first described the clinical significance of QTd as an independent predictive factor of ventricular instability in patients operated on for total correction of tetralogy of Fallot.13 These data were confirmed by Gatzoulis et al,14 who, moreover, introduced QRSd as a marker to study inhomogeneity of ventricular depolarisation in patients operated on for tetralogy of Fallot with different QRS durations and with or without life threatening arrhythmias. In our series of patients, QRSd and JTd were not statistically different; moreover they were not independent predictors of electrical ventricular instability in groups with and without sVT or VF. QRSd was particularly high in patients with nsVT, and JTd increased with the severity of ventricular arrhythmias. Only when considering overall QTd were we able to differentiate patients with sVT independently of QRS duration.
Our data have confirmed the clinical value of the dimensions of the right ventricular cavity, as well as the duration of QRS and QTd obtained from routine echocardiography and ECG. It is the EDVRV which proves to be the most significant marker of malignant ventricular arrhythmias, both in univariate and multivariate analysis. The association of EDVRV and QT dispersion is the most useful in stratifying patients with life threatening ventricular arrhythmias both when they are dichotomised (presence or absence of sVT or VF) or when the order of arrhythmia severity (absence, minor, non-sustained VT, sVT, or VF) is taken into account.
The probability of the studied population incurring sVT or VF increases progressively with increasing EDVRV. In this series, the 50th centile of EDVRV was 100 ml, and was associated with probabilities for sVT or VF between zero and 30%, according to the amount of QTd (fig 5A). In comparison, the use of QRS duration overestimated the probability of sVT or VF for lower EDVRV values, and underestimated the probability for higher EDVRV.
The ordinal logistic probability has shown a significant trend toward an increasing severity of arrhythmias with increasing EDVRV, QTd, and QRS duration. Gatzoulis et al reported 100% sensitivity and 94.7% specificity of QRS duration of 180 ms or more as a risk marker of malignant ventricular arrhythmias.8Surprisingly, all of our patients with sVT or VF had a measured QRS duration of less than 180 ms.
We also found a correlation, as did Gatzoulis,8 between QRS duration and EDVRV, but the correlation was weak (r = 0.49). Right bundle branch block was present in all our patients and we were unable to distinguish QRS prolongation secondary to post surgical damage of the conducting tissue from QRS prolongation due to right ventricular dilatation. Therefore in our patients the information derived from QRS duration is less predictive than the information obtained from echocardiographic measurement of EDVRV. After directly determining the end diastolic volume, the measurement of QRS duration is partially redundant compared with the information provided by QTd.
QTd was unrelated to the presence of right bundle branch block and to the functional conditions of the right and left ventricles, particularly ventricular dilatation. It is probably related to particular myocardial substrates related to ventriculotomy. In fact, patients with uncorrected tetralogy of Fallot and patients undergoing correction through a transatrial approach showed significantly lower QTd values than patients whose correction involved ventriculotomy.12
QTd proved to be a better screening method than QRS duration and QRSd because it was possible to discriminate different probabilities for nsVT as opposed to sVT (fig 4). This is of potential value because, as demonstrated by the prospective study of Cullen et al,15 observation of nsVT at ambulatory ECG did not identify patients at high risk of sudden death after total repair of tetralogy of Fallot.
In conclusion, the indices described—obtained by simple means—should therefore become a routine part of clinical follow up after repair of tetralogy of Fallot, though we believe that the explanation for sudden death involves more complex mechanisms than those directly measured in our study. One obvious additional factor is the influence of the autonomic nervous system which is the focus of our continuing study.
Acknowledgments
This study was supported by the Research Project “Follow-up del cardiopatico congenito operato” Regione Veneto, Venice, Italy.