Article Text

Abstract
OBJECTIVES To validate a simplified estimate of peak power (SPP) against true (invasively measured) peak instantaneous power (TPP), to assess the feasibility of measuring SPP during exercise and to correlate this with functional capacity.
DESIGN Development of a simplified method of measurement and observational study.
SETTING Tertiary referral centre for cardiothoracic disease.
SUBJECTS For validation of SPP with TPP, seven normal dogs and four dogs with dilated cardiomyopathy were studied. To assess feasibility and clinical significance in humans, 40 subjects were studied (26 patients; 14 normal controls).
METHODS In the animal validation study, TPP was derived from ascending aortic pressure and flow probe, and from Doppler measurements of flow. SPP, calculated using the different flow measures, was compared with peak instantaneous power under different loading conditions. For the assessment in humans, SPP was measured at rest and during maximum exercise. Peak aortic flow was measured with transthoracic continuous wave Doppler, and systolic and diastolic blood pressures were derived from brachial sphygmomanometry. The difference between exercise and rest simplified peak power (Δ SPP) was compared with maximum oxygen uptake (V˙O2max), measured from expired gas analysis.
RESULTS SPP estimates using peak flow measures correlated well with true peak instantaneous power (r = 0.89 to 0.97), despite marked changes in systemic pressure and flow induced by manipulation of loading conditions. In the human study, V˙O2max correlated with Δ SPP (r = 0.78) better than Δ ejection fraction (r = 0.18) and Δ rate–pressure product (r = 0.59).
CONCLUSIONS The simple product of mean arterial pressure and peak aortic flow (simplified peak power, SPP) correlates with peak instantaneous power over a range of loading conditions in dogs. In humans, it can be estimated during exercise echocardiography, and correlates with maximum oxygen uptake better than ejection fraction or rate–pressure product.
- stress echocardiography
- oxygen consumption
- left ventricular function
- cardiac power output
Statistics from Altmetric.com
Maximum oxygen uptake (V˙O2max), measured by expired gas analysis, is useful for assessing prognosis.1 However, the requirement for special equipment and expertise has limited the clinical application of this test. Exercise ejection fraction is a widely used index of left ventricular function as it is simple to measure and has prognostic power, but it does not correlate withV˙O2max.2 ,3 There is a need for a simply measured echocardiographic variable that correlates withV˙O2max.
Cardiac reserve, assessed as the ventricular power response to inotropes or exercise, correlates with V˙O2max and also predicts prognosis. However, current techniques for measuring cardiac power are time consuming and technically demanding, or require invasive haemodynamic measurements. Cardiac power may be defined as mean or peak power.
Mean power (= stroke volume × mean arterial pressure × heart rate) has been estimated using flow measures from Swan Ganz catheterisation and a two stage metabolic exercise protocol. During dobutamine infusion, mean power is predictive of prognosis in heart failure and cardiogenic shock.4 ,5During exercise this index has been shown to correlate withV˙O2max.6 ,7
Peak instantaneous power is the peak instantaneous product of left ventricular outflow and pressure during systole, and requires measurement and temporal alignment of the left ventricular pressure and outflow waveforms. Recently, “preload adjusted” peak instantaneous power has been shown to be relatively independent of acute changes in loading conditions as well as being predictive of outcome.8-11 Peak instantaneous power can be measured non-invasively during dobutamine stress using Doppler echocardiography, with reconstruction of the central aortic pressure waveform from peripheral measurements.10 ,11 However, this technique is time consuming, technically demanding,12 and very difficult to use during exercise.13 Moreover, isotonic exercise is a more physiological method for evaluating functional reserve.14 ,15
In this study, we looked for a practical method of evaluating peak power during exercise stress. We hypothesised that the product of peak aortic flow and mean blood pressure would be a simplified method of estimating peak instantaneous power (simplified peak power, SPP), which we validated in an open chest canine model. The feasibility of obtaining SPP during exercise echocardiography and the correlation of SPP response with cardiac functional capacity were then assessed in humans.
Methods
ANIMAL VALIDATION STUDY
Study design
Eleven dogs were studied, seven normal (weight 11 to 28 kg) and four with pacing induced dilated cardiomyopathy (weight 23 to 28 kg, ejection fraction 19–25%). General anaesthesia was induced with intravenous thiopentone (thiopental) (20 ml/kg) followed by endotracheal intubation and halothane inhalation. All dogs received humane care in compliance with the Guide for the care and use of laboratory animals published by the National Institutes of Health (NIH Publication No 80-23, 1978).
Invasive measurement of peak instantaneous power
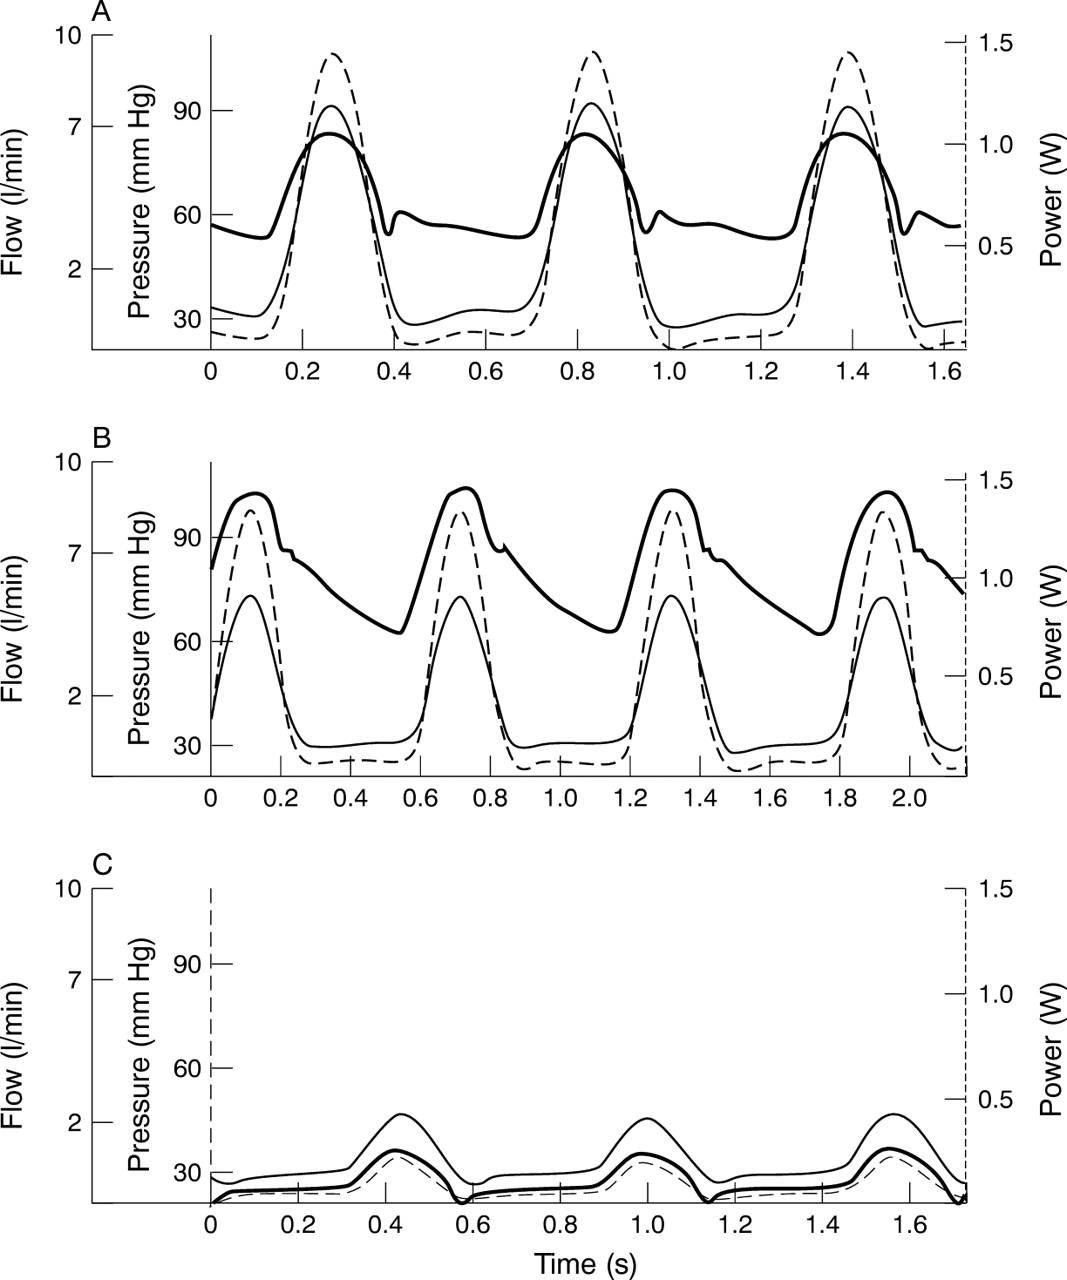
Following median sternotomy and the formation of a pericardial cradle, a transit time flow probe was placed around the ascending aorta (Transonic Systems Inc, Ithaca, New York, USA). A dual sensor high fidelity micromanometer was passed through the carotid artery to record left ventricular and aortic pressures (Millar Instruments, Houston, Texas, USA), fluid filled catheters were placed to measure right and left atrial pressures, and the ECG was monitored. Outputs were sampled at 5 ms intervals and stored digitally (Astro-med Inc, West Warwick, Rhode Island, USA). The flow signal was filtered at 10 Hz and on in vitro testing it was found to be delayed 60 ms relative to the unfiltered pressure signal; this was corrected in the subsequent analysis. Using custom software written in MatLab (The MathWorks Inc, Natick, Massachusetts, USA), true peak instantaneous power was calculated as the maximum instantaneous product of aortic flow and pressure (fig 1).

Haemodynamic alterations in the open chest canine model: screen shots from the custom analysis program showing haemodynamic responses. Flow (thin solid line) is ascending aortic flow from perivascular flow probe. Pressure (thick solid line) is ascending aortic pressure from micromanometer catheter. Power (broken line) is left ventricular power, the instantaneous product of the pressure and flow. (A) Baseline. (B) During partial aortic occlusion; pressure increases, flow falls, but power remains similar to baseline. (C) During vena cava occlusion; pressure, flow, and power all decrease dramatically. See text for further details.
Estimation of simplified peak power
SPP was calculated using three different measures of peak flow (flow probe, FlowFP; pulse wave Doppler, FlowPW; and continuous wave Doppler, FlowCW), and compared with true peak instantaneous power.
Epicardial echocardiography was carried out with a Hewlett Packard 5500 echocardiography machine and s8 transducer (Hewlett Packard Inc, Andover, Massachusetts, USA). Left ventricular outflow tract cross sectional area was calculated at baseline during systole from the diameter of the aortic annulus in the cross sectional long axis view, and was considered constant throughout the protocol.16 ,17Aortic flow velocity was measured by continuous wave Doppler using an apical transducer with the cursor positioned through the left ventricular outflow tract and ascending aorta.18-20 Using the same cursor position, pulse wave Doppler flow velocity was measured with the sample volume (size 3 mm) placed just proximal to the aortic annulus. Doppler settings were optimised and velocities were recorded simultaneously with invasive haemodynamic recordings during various loading conditions. Using a sweep speed of 100 mm/s, two screens were saved digitally for off-line analysis. Doppler estimates of peak aortic flow velocity were measured at the edge of the waveform for both continuous wave and pulse wave Doppler. Peak aortic flow was defined as the product of peak aortic velocity × aortic annulus area. Mean arterial pressure was calculated from the integrated digital aortic pressure waveform. SPPFP, SPPPW, and SPPCW were calculated as the product of peak aortic flow (FlowFP, FlowPW, and FlowCW, respectively) × mean arterial pressure.
Haemodynamic alterations
Doppler and haemodynamic recordings were made simultaneously at three different haemodynamic states: baseline, reduced preload (vena cava compression), and increased afterload (aortic compression). Caval compression was created by tightening a tape around both venae cavae, and haemodynamic and Doppler recordings were taken once a steady state was attained with an approximately 50% reduction in systolic blood pressure. Aortic compression was obtained by partial cross clamping of the ascending aorta, and recordings were repeated at steady state after systolic blood pressure increased by approximately 25%.
CLINICAL APPLICATION
Study design
Rest and exercise SPP values were estimated in 14 normal subjects and 26 patients undergoing evaluation for coronary or valvar heart disease. Supine bicycle exercise echocardiography and metabolic testing with expired gas analysis were performed.
Estimation of simplified peak power
SPP was estimated using continuous wave Doppler as described above. The aortic annulus diameter was measured from the parasternal long axis annulus view at rest, and assumed to remain constant.17 The exercise value of peak aortic flow velocity was taken at maximum exercise, or failing that immediately on cessation of exercise. Arterial pressure values at rest and at maximum exercise were estimated from phase 1 and phase 4 of the Korotkov sounds using a mercury sphygmomanometer at the brachial level. Mean arterial pressure was calculated as the sum of the diastolic and one third of the pulse pressure. SPP was calculated as the product of peak aortic flow × mean arterial pressure. Contractile reserve was calculated as the increase with exercise in SPP (ΔSPP).
Exercise testing
All subjects underwent symptom limited exercise testing on a tilt table supine ergometer (American Echo, Kansas City, Missouri, USA) using two minute stages, with 25 W workload increments. The heart rate, symptom status, and 12 lead ECG were monitored continuously during exercise, and brachial artery pressure was measured at the end of each stage using a mercury sphygmomanometer. Maximum exercise was defined by attainment of > 85% of maximum age predicted heart rate response.21
Echocardiographic examination was performed using an ATL HDI 3000 machine (Advanced Technology Laboratories, Bothell, Washington, USA) to obtain standard views at rest, on maximum exercise, and immediately afterwards. Echocardiographic images were recorded on 0.5 inch VHS videotapes and digitised on-line into a digitally stored quad screen, cine loop format (ImageVue; Eastman Kodak Health Imaging, Allendale, New Jersey, USA). Interpretation of the images was performed by two observers using the standard 16 segment left ventricular model.22 Each segment was graded as normal, scarred, or ischaemic according to standard criteria, and each study was scored overall as normal, scar (at least 1/16 scar segments), ischaemic (at least 1/16 ischaemic segments), or non-diagnostic because of submaximal exercise.
Measurement of ventilatory response
Continuous expired gas analysis was performed with the use of a disposable mouthpiece (pneumotach) connected to a MedGraphics CardiO2 system (Minneapolis, Minnesota, USA). Nose clips were used to prevent air leak from the nostrils. Breath by breath analysis of the expired gas was performed, and results were reported as 30 second averages. Oxygen consumption (V˙O2) and carbon dioxide production (V˙CO2) were measured at rest for ⩾ 2 minutes before the start of exercise and then continuously during exercise. Maximum oxygen uptake (V˙O2max) was defined as the oxygen consumption at peak exercise. The respiratory exchange ratio was calculated as the ratio of V˙CO2 to V˙O2.
STATISTICAL ANALYSIS
All results are expressed as mean (SD) unless otherwise stated. Grouped variables were compared using analysis of variance with the Bonferroni correction for multiple sampling. Pearson’s two tailed correlations and linear regression were used to compare continuous variables. Correlation coefficients were compared using Fisher’s z transformation, and regression lines were compared using pooled and common estimates of variance. Statistical significance was defined as a two tailed p value of < 0.05 and all analyses were performed using SPSS Release 7.5, 1996 (SPSS Inc, Chicago, Illinois, USA).
Results
ANIMAL STUDIES
Haemodynamic responses to aortic and caval compression
The haemodynamic variables at baseline and during haemodynamic manipulation are summarised in table 1. Systemic pressures and flow fell significantly with vena cava occlusion. Pressure rose and flow fell significantly with partial aortic occlusion. Heart rate did not vary during haemodynamic alterations, and this may have been because of the sympatholytic effect of general anaesthesia (fig1).
Haemodynamic variables under different test conditions
Estimation of cardiac power
Overall estimates of peak flow by continuous wave Doppler were greater than by flow probe (p = 0.01). Peak power fell markedly during vena caval occlusion, demonstrating its dependence on preload (table 1). Peak power during aortic occlusion fell below baseline values in the cardiomyopathic subjects (p < 0.001, fig 2). Peak power is relatively independent of afterload, but the time required to reach steady state during aortic occlusion resulted in a reduction in preload as well as an increase in afterload. The dogs with pacing induced cardiomyopathy had lower values of peak instantaneous power at all stages (p < 0.001, fig 2).

Differences in peak instantaneous power between normal and cardiomyopathic dogs. True peak instantaneous power per kg body weight for normal and cardiomyopathic dogs during different haemodynamic stages. Error bars represent SEM. VC, vena cava. Cardiomyopathic dogs have lower peak instantaneous power during baseline and aortic occlusion (p < 0.001), but not during vena cava occlusion (p = 0.09).
There was excellent correlation of estimates of SPP using peak flow measured with flow probe, continuous wave Doppler, and pulse wave Doppler with true instantaneous peak power (fig 3). There was no difference between the regression lines of the two Doppler estimates of SPP (p > 0.05), but the flow probe technique had a different regression from either Doppler technique (p < 0.01). Recalculation of SPP using peak systolic rather than mean blood pressure showed little difference in the correlations with true peak instantaneous power (table 2).
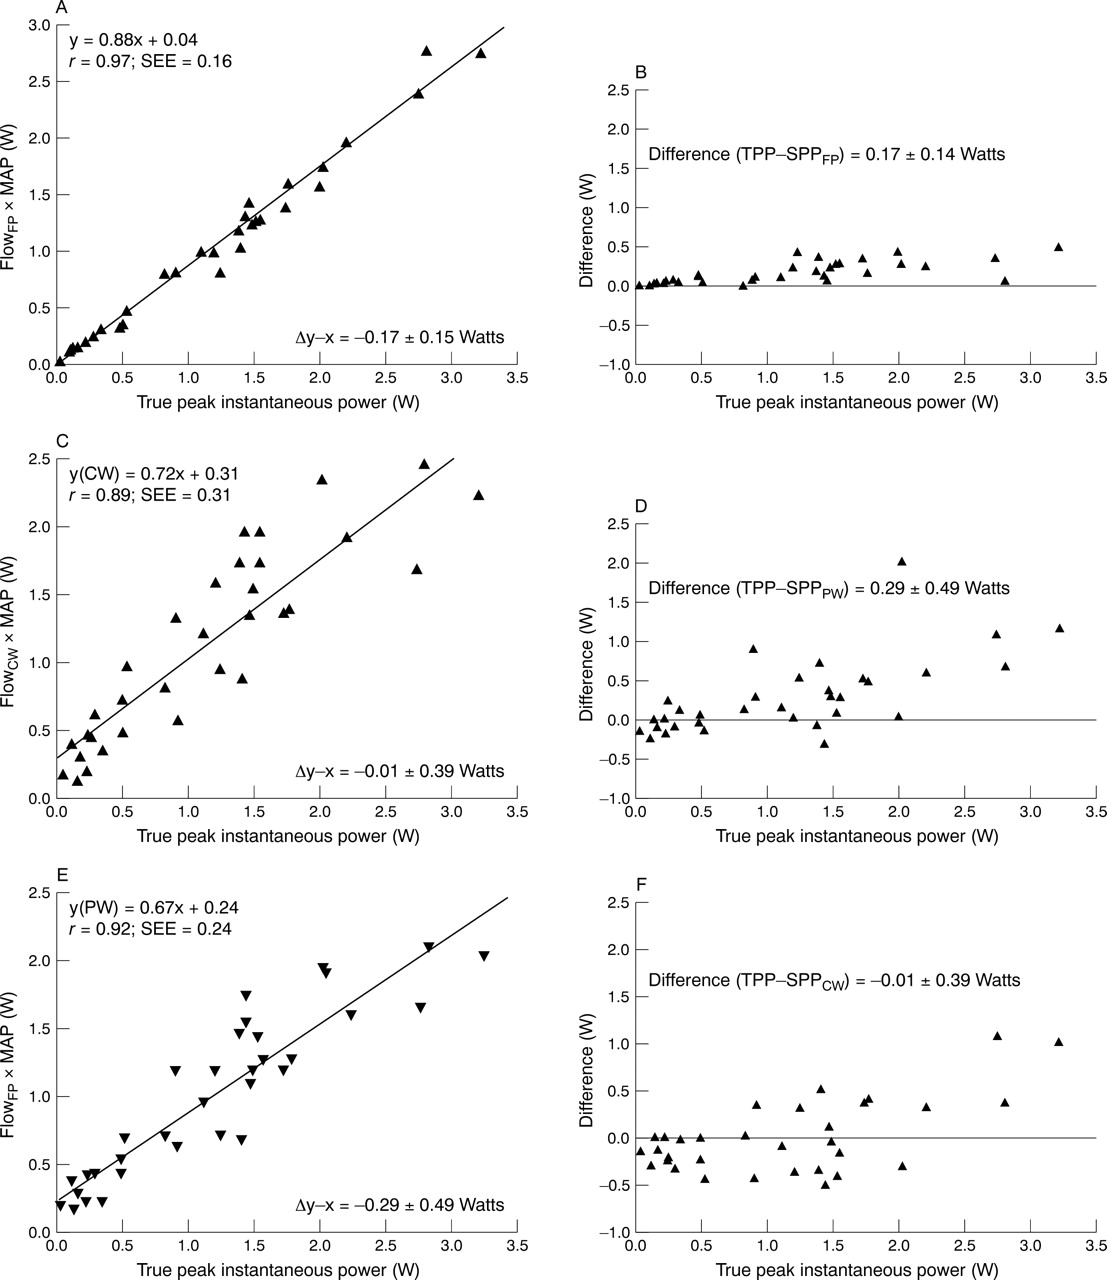
Simplified peak power estimates compared with peak instantaneous power in dogs. Simplified peak power (SPP) estimates using peak flow measured with flow probe shows excellent correlation with true peak instantaneous power (A), with minor overestimation of higher levels of power shown on the Bland–Altman plot (B). When echocardiographic estimates of flow are used to estimate simplified peak power there is some increase in scatter but still a good correlation with true peak instantaneous power, using continuous wave (CW) Doppler (C and D) and pulse wave (PW) Doppler (E and F).
Correlation of simplified peak power with peak instantaneous power (dogs) or V˙O2 (humans) using mean arterial pressure or systolic blood pressure
CLINICAL STUDIES
Patient characteristics
Of the twenty six patients (age 59 (15) years), nine were female, three had a resting ejection fraction < 45%, four had greater than moderate mitral regurgitation, and four were in atrial fibrillation. Indications for evaluation included postmyocardial infarction (n = 2), post-coronary revascularisation (n = 5), suspected coronary disease (n = 14), and mitral regurgitation (n = 5). The exercise echocardiograms included 12 negative tests, seven non-diagnostic tests owing to inadequate heart rate response (< 85% of maximum age predicted heart rate response), and seven with rest or exercise induced wall motion abnormalities.
All 14 control subjects (age 35 (6) years) were male, with normal rest and exercise echocardiograms. Resting ejection fraction was similar in patient and control groups, at 58 (11)% v62 (6)%, p = 0.19. Other baseline variables, apart from age and sex, were not different between the two groups. With exercise, the control subjects achieved a higher heart rate, rate–pressure product,V˙O2max, and SPP than the patients (table3).
Rest and exercise variables in patients and controls
Simplified peak power
Simplified peak power was obtained in all patients at rest and exercise. SPP was not different between patients and controls at rest (5.6 (2.2) v 5.8 (1.5) W, respectively; p = 0.67). There was a significant increase with exercise in both groups, but more so in the control subjects (10.4 (3.0)v 13.0 (3.0), p < 0.001).
Ventilatory response
Patients achieved a V˙O2max of 19 (5) ml/kg/min (range 11.7 to 27.6) corresponding to 5.4 (1.4) metabolic equivalents (METS), with a maximum rate–pressure product of 28.2 (6.2) × 103 mm Hg.beats/min. The respiratory exchange ratio at peak exercise was 1.17 (0.09), indicating good effort and maximum exercise. Four patients achieved a respiratory exchange ratio of between 1.0 and 1.1, indicating submaximal effort.
The correlations of resting and exercise haemodynamic and echocardiographic variables with V˙O2max are summarised in table 4. Resting variables, with the exception of a lower rate–pressure product, did not correlate withV˙O2max. The relation between SPP and maximumV˙O2 is summarised in fig 4; at maximum exercise, there was better correlation of the power indices withV˙O2max than with rate–pressure product or heart rate. The increase in ejection fraction did not correlate withV˙O2max. The same relations were apparent with analysis of the increment of SPP and other variables with exercise.
Univariate correlations with maximum oxygen consumption (V˙O2max)

Correlation of cardiac power reserve (ΔSPP) withV˙O2max in 26 patients and 14 control subjects. Non-diagnostic, non-diagnostic exercise test because heart rate response was < 85% of maximum predicted for age. Scar and ischaemia, left ventricular wall motion abnormality by cross sectional echocardiography at rest (scar) or with exercise (ischaemia). Negative and control, exercise echocardiography in patients (negative) and normal volunteers (control) with adequate heart rate response and no wall motion abnormality at rest or on exercise.
The use of systolic blood pressure for calculation of SPP gave similar correlations with V˙O2max but the data showed more variation than with mean arterial pressure, evidenced by a larger standard error (table 2). Similarly, use of left ventricular outflow velocity rather than flow gave a lower correlation withV˙O2max (r = 0.71 (0.41)v 0.78 (1.4)).
Discussion
Maximum power, developed at the time of peak left ventricular pressure and peak flow, is a potentially useful measure of left ventricular systolic function which has not yet found widespread clinical application, probably because of the need for invasive measurement. This study shows that in an open chest canine model, the product of peak aortic flow and mean arterial pressure correlates with true peak instantaneous power. This correlation was maintained over a wide range of loading conditions that would be expected to alter aortic compliance, and power was lower in animals with left ventricular impairment. In the clinical study this simplified index of peak power, derived from mean arterial pressure and peak flow, could be obtained without additional equipment or set-up time in all patients during routine clinical exercise echocardiography. The index had a good correlation with workload, and correlated with V˙O2max better than ejection fraction or rate–pressure product. Although both blood pressure and peak flow can be obtained non-invasively, the methodology applied to each needs to be chosen carefully.
SELECTION OF BLOOD PRESSURE VARIABLE FOR ASSESSMENT OF CARDIAC POWER
A major problem is that non-invasive reconstruction of the central aortic waveform from the periphery is technically demanding, time consuming, and requires special equipment.10-13 ,23 ,24Its application during exercise stress is particularly challenging because of movement and muscle activity.13
Sphygomanometer measured peak systolic pressure is not a good surrogate for left ventricular ejection pressure, particularly in older people, because of variations in arterial compliance. As an estimate of the pressure at peak instantaneous power, we chose mean arterial pressure because it can be estimated accurately with brachial sphygmomanometry even during exercise.25 ,26 Mean arterial pressure is used as an estimate of mean systolic left ventricular pressure in the calculation of mean power, and as an estimate of left ventricular end systolic pressure in the calculation of end systolic wall stress; a recent editorial suggested its use in the non-invasive assessment of peak power.4-6 ,12 ,27-30 Peripheral systolic pressure differs significantly from central systolic pressure at rest and this discrepancy worsens with exercise, whereas mean arterial pressure estimates remain concordant.25 ,26 In the dogs, estimations of power used mean arterial pressure derived from integration of the waveform. Substituting the traditional formula, diastolic pressure + (pulse pressure/3), gave estimates of power that differed by 0.03 (0.05) W (p = 0.002). Substituting this estimate of mean arterial pressure (MAP) into the expression (FlowFP× MAP) gave a regression line against true peak instantaneous power that was not different from one using the integrated digital mean pressure (p > 0.05).
The consequence of using mean arterial pressure is that the resulting SPP is proportionate but not equal to true maximum power. In this study, the selection of peak systolic blood pressure or mean arterial pressure had little impact on the correlation with invasively measured peak maximum power in dogs, reflecting the use of invasive pressure measures in the animal studies (table 2). However, the use of systolic blood pressure rather than mean arterial pressure in humans led to a significantly greater standard error in the correlation withV˙O2. This reflects differing errors in the sphygmomanometric estimation of pressure because of variation in arterial compliance between subjects and the difficulties of measuring peak pressure during exercise. It is likely that the best index will be determined by follow up studies of outcome, using power calculated with each technique.
SELECTION OF A FLOW VARIABLE FOR ASSESSMENT OF CARDIAC POWER
Peak instantaneous power usually occurs at > 90% of peak flow, so it is reasonable to use peak flow as a more easily obtained surrogate. The correlation of SPP with true instantaneous peak power would not be expected to hold under extreme alterations in aortic impedance. However, the correlation of SPP with true instantaneous peak power was not different in dogs with heart failure induced by rapid pacing for three to four weeks. In this model, characteristic aortic impedance increases by 50%; therefore the cardiomyopathic dogs in our study would have had a markedly different aortic impedance compared with normal dogs.31 Furthermore aortic cross clamping raised systolic aortic pressure by an average of 26% and vena caval occlusion reduced systolic aortic pressure by 53%, both of which imply a significant alteration in the operating compliance of the aorta.
During vena caval occlusion, both Doppler methods overestimated flow, suggesting that aortic annulus area is not constant during extreme hypovolaemia (table 1). This resulted in a non-zero intercept for the regression of SPPPW and SPPPW with true peak instantaneous power (fig 3B, C). Continuous wave Doppler overestimated aortic flow velocity (p = 0.03 v flow probe). In the dog, the ascending aorta is very short and runs almost straight cranially, thus enabling continuous wave interrogation to detect the high velocity turbulent vortices in the aortic arch.32-34 Humans have much longer ascending aortas, resulting in the aortic root and arch lying in different planes. Thus it is unlikely that this lining up of left ventricular outflow tract and aortic arch flow could occur, and clinical studies have found satisfactory correlations between stroke volumes measured by continuous wave Doppler compared with pulse wave Doppler and thermodilution.18 ,20 In the clinical study we used continuous wave Doppler because this is more reliable for measuring aortic flow in the vigorously moving heart during exercise.18-20 Aortic area was measured at the annulus because this structure is the smallest dimension of the left ventricular outflow tract and aortic root.16 It is easy to recognise and being part of the fibrous skeleton its diameter changes by less than 5% in humans undergoing exercise, although animal data from the current study suggest its diameter may change significantly during extreme hypovolaemia.17
Mean power, as developed by Tan, was not used because its assessment by echocardiography requires measurement of the aortic time–velocity integral instead of peak aortic flow velocity, which we found unreliable during exercise echocardiography.4-6 27-29Another choice relates to the selection of flow rather than velocity as a surrogate of flow. The essence of this problem relates to the error that can be introduced by measurement of the left ventricular outflow tract diameter for the calculation of flow. Nonetheless, the results in this study suggest that flow rather than velocity gives the best correlation with V˙O2 in humans.
ASSESSMENT OF EXERCISE CAPACITY
The rate of maximum oxygen uptake is the best test of overall functional reserve, and is determined by the cardiac output at maximum exercise in untrained normal people.29 We therefore selected V˙O2max as the measure of cardiopulmonary reserve in the population examined in the current study. In heart failure or pulmonary disease, V˙O2max is influenced by differences in peripheral oxygen extraction, regional distribution of blood flow, and pulmonary gas exchange. It is therefore not a measure of cardiac function in these groups but instead reflects the functional capacity of the whole organism. Nevertheless, in this study,V˙O2max ranged from 11.7 to 51.7 ml/min/kg, which encompasses New York Heart Association functional class I–IV.35 ,36
Existing echocardiographic measurements of resting cardiac function do not predict functional reserve, and the lack of correlation of ejection fraction with V˙O2max has been reported previously.35 Direct measurement ofV˙O2max is cumbersome and requires special training, as well as carefully maintained metabolic equipment. Estimations ofV˙O2max using empirical regressions of workload and body weight have a large variance, especially for patients with cardiac disease, and limited experience has been reported with supine ergometry.21 The major determinants of the increase in myocardial oxygen uptake with exercise are contractility, pressure work, and heart rate.37 ,38 All these factors are reflected in the index validated in this study. The good correlation of SPP with V˙O2max raises the possibility that this simple index may supply similar information in some circumstances.
LIMITATIONS
The results of this study show a correlation of SPP with maximumV˙O2 in the overall group (fig 4). However, variation in this relation is significant for individuals, and further experience will be needed to define whether this variable can be applied better to comparisons within an individual from time to time, rather than between patients.
Supine exercise was used in this study, to facilitate the measurement of exercise aortic flow. However, this may prove a difficult form of exercise for patients in heart failure particularly, and further testing of SPP in patients undergoing upright bicycle or treadmill exercise is appropriate.
Although peak power is sensitive to preload, the “preload adjusted peak power” (peak power/end diastolic volume squared) is relatively independent of preload.8 Preload is near maximal when resting supine; therefore exercise in this position is associated with a lesser increase in stroke volume and no change in end diastolic volume.39 Because of this and technical problems with derivation of left ventricular volumes, we did not correct the power measurements for preload, although this may have improved the predictive ability in patients with significant left ventricular dilatation.
CLINICAL IMPLICATIONS
The evaluation of exercise capacity is an important prognostic variable in cardiac patients. However, measurement ofV˙O2max requires expired gas analysis, and a simple echocardiographic variable that correlates withV˙O2max would be desirable. Further longitudinal studies are necessary to determine whether simplified peak power has similar prognostic value to peak instantaneous power in conditions such as heart failure. In a recent study it was found that the blood pressure response to exercise added incremental prognostic value to theV˙O2max in patients being assessed for cardiac transplantation.40 This supports the concept that an index which incorporates blood pressure and flow response to exercise (simplified peak power) may be a useful index of exercise capacity. A recent editorial suggests that any new non-invasive index of ventricular function must be easy to use and understand, and superior to ejection fraction.12
CONCLUSIONS
We have validated a simplified method to estimate peak power, the product of peak aortic flow and mean arterial pressure. Both of the latter can be measured accurately during exercise using simple non-invasive techniques. In the population studied, simplified peak power correlates with the rate of maximum oxygen uptake.
Acknowledgments
We are grateful to Lisa A Cardon RDCS and Robin A Borden MS for technical assistance with the study. This research was partially supported by grant No NCC9-60, National Aeronautics and Space Administration, Houston, Texas, USA. GPA was partially supported by the New Zealand Heart Foundation. SGC was supported by a grant from the Belgian American Educational Foundation and from NATO.