Article Text

Abstract
OBJECTIVE To identify intracardiac conduction abnormalities in patients with myotonic dystrophy from their clinical, ECG, and genetic features.
METHODS 39 consecutive patients (mean (SD) age 42.9 (12.1) years; 16 female, 23 male) underwent clinical examination, genetic studies, resting and 24 hour ambulatory ECG, signal averaged ECG, and electrophysiological studies.
RESULTS 23 patients suffered from cardiac symptoms, 23 had one or more cardiac conduction abnormality on resting ECG, one had sinus deficiency, and 21 (53.8%) had prolonged HV intervals. No correlation was found between the severity of the neurological symptoms, onset of disease, cardiac conduction abnormalities on ECG, and the intracardiac conduction abnormalities on electrophysiological study. The size of the DNA mutation was longer in the abnormal HV interval group than in the normal HV interval group (3.5 (1.8) v 2.2 (1.0) kb, p < 0.02). Signal averaged ECG parameters (total QRS duration (QRSD) and duration of low amplitude signals ⩽ 40 μV (LAS 40)) were greater in patients with an abnormal HV interval than in those with a normal HV interval (123.4 (24.6)v 102.8 (12.3) ms and 47.5 (12.8)v 35.3 (8.8) ms, respectively; p < 0.005). Only the association of QRSD ⩾ 100 ms with LAS 40 ⩾ 36 ms identified patients with an abnormal HV interval with good sensitivity (80%) and specificity (83.3%).
CONCLUSIONS Infrahissian conduction abnormalities are common in myotonic dystrophy and can be identified using signal averaged electrocardiography.
- myotonic dystrophy
- atrioventricular block
- genetic factors
- signal averaged ECG
Statistics from Altmetric.com
Myotonic dystrophy is a common form of adult muscular dystrophy caused by expansion of the cytosine-thymine-guanine (CTG) trinucleotide repeat on chromosome 19.1 The incidence of complete atrioventricular block is higher in patients with this disease than in the general population and this contributes to the high incidence of sudden death.2 It has recently been shown that conduction abnormalities on the resting ECG are linked to mortality in myotonic dystrophy and that patients with lengthened infrahissian conduction time are exposed to paroxysmal complete atrioventricular block.3 ,4 The major problem is to determine the ideal time to perform electrophysiological studies in order to decide on the need to implant a cardiac stimulation device.5
The aim of our study was to correlate clinical and electrocardiographic characteristics, CTG repeat size, and electrophysiological variables in order to identify criteria for performing electrophysiological studies in myotonic dystrophy.
Methods
PATIENTS
Adult patients suffering from myotonic dystrophy diagnosed in the department of neurology on the basis of neurological examination and electromyography were enrolled in the study after obtaining their informed consent.
NEUROLOGICAL EVALUATION
The onset of the neurological symptoms was determined for each patient and the severity of the skeletal muscle involvement was evaluated by the Brooke score.6
CARDIAC EVALUATION
Resting ECG, 24 hour ambulatory ECG, signal averaged ECG, and electrophysiological studies were performed after physical examination.
Signal averaged ECG
Recordings were performed using an ART recorder (model 1200, Arrhythmia Research Technology, Austin, Texas, USA) by Simson's method.7 The ECG was recorded with standard bipolar orthogonal X, Y, Z leads. Signals were amplified, averaged, and filtered with bidirectional filtered frequencies of 40–250 Hz. The three filtered signals were combined into a vector magnitude: X2 + Y2 + Z2. A computer algorithm determined the onset and offset of the QRS complex and calculated total QRS duration (QRSD), duration of low amplitude signals ⩽ 40 μV (LAS 40), and mean square voltage of signals in the last 40 ms of the QRS complex. Only the duration of QRSD and LAS 40 were considered in this study.
Electrophysiological study
Briefly, two bipolar catheters (Bard 6 F, Galway, Ireland) were introduced through sheaths inserted into the femoral vein and placed under fluoroscopic guidance in the bundle of His region and in the high right atrium. An endocardial ECG was recorded with an amplification of 80 mm/mV and paper speed of 100 mm/s. Cardiac stimulation was performed with a programmable stimulator (Explorer 2000, ELA Medical, Montrouge, France), which delivered rectangular pulses of 2 ms duration. Several variables were measured: atrioventricular conduction times in basal conditions (AH and HV intervals, ms); atrioventricular Wenckebach point during atrial stimulation at increasing rate (WK point, beats/min); and refractoriness period of atrioventricular node during single atrial premature beats (RPAVN, ms). Carotid sinus massage on right and left sides was then given for 5 s while the His potential was recorded. An AH interval of more than 125 ms and an HV interval of more than 60 ms were considered to be abnormal values in the absence of bundle branch block, and an HV interval of more than 70 ms when bundle branch block was present. An RPAVN of more than 425 ms and a WK point of less than 140 beats/min were considered to be abnormal values. Sinus pauses exceeding three seconds during carotid sinus massage were considered to be significant. In subjects with normal atrioventricular conduction parameters, the measurements were repeated after atropine infusion (1 mg).
The ejection fractions of the left and right ventricles were determined by radionucleotide angiography. We considered that values of 60% or more for the left ventricle and 50% for the right were normal.
CTG trinucleotide expansion
DNA extracted from peripheral blood samples was analysed to evaluate the size of the CTG repeats. The myotonic dystrophy mutation was detected by using Southern analysis with probe p5B1.4 on EcoRI and Bam HI digests.1 CTG expansions were measured to the midpoint of smears (kb).
STATISTICAL METHODS
Variables are expressed as mean (SD). Quantitative values were compared using the unpaired Student t test and qualitative data using the χ2 test. The correlations between the clinical and electrocardiographic variables, the size of the DNA mutation, and the electrophysiological indices were analysed using the linear regression method. Statistical significance was assumed for p < 0.05. To test the diagnostic value of the clinical, electrocardiographic, and genetic variables for the presence of electrophysiological abnormalities, we determined the sensitivity and specificity of each variable from different thresholds and drew receiver operating curves.
Results
CLINICAL CHARACTERISTICS OF THE PATIENTS
Thirty nine patients were recruited consecutively regardless of their clinical symptoms. They complained of dizziness (9), palpitations (5), and dyspnoea (9). Sixteen patients had no symptoms. Their clinical characteristics are summarised in table 1.
Clinical characteristics of 39 patients suffering from myotonic dystrophy
ELECTROCARDIOGRAPHIC AND ELECTROPHYSIOLOGICAL CHARACTERISTICS
Twenty three patients (59%) had one cardiac conduction disturbance or more on their resting ECG records (table 2). One patient had a sinus deficiency on the resting ECG, confirmed on 24 hour ECG. No paroxysmal atrioventricular block was recorded during the 24 hour ECG records. Twenty one patients (53.8%) had a prolonged HV interval (table 2). No patients had sinus pauses exceeding 3 s during carotid sinus massage. Ten patients (25.6%) had an RPAVN value of > 425 ms; only seven patients had a WK point of < 140 beats/min. No modification of HV interval was observed after injection of atropine in 18 patients with a normal HV interval.
ECG and electrophysiological indices in 39 patients with myotonic dystrophy
CHARACTERISTICS OF PATIENTS WITH A LENGTHENED HV INTERVAL
Patients with a lengthened HV interval did not differ statistically in terms of age, sex, cardiac symptoms, onset of the disease, Brooke score, frequency of cardiac conduction disturbances on resting ECG, or right and left ventricular ejection fraction (table 3). The size of the DNA mutation, QRSD, and LAS 40 on the signal averaged ECG was significantly greater in the prolonged HV interval group than in the normal HV interval group (table 3). RPAVN and the WK point were not significantly different in the abnormal and normal HV interval groups.
Characteristics of patients with normal and abnormal HV intervals in myotonic dystrophy
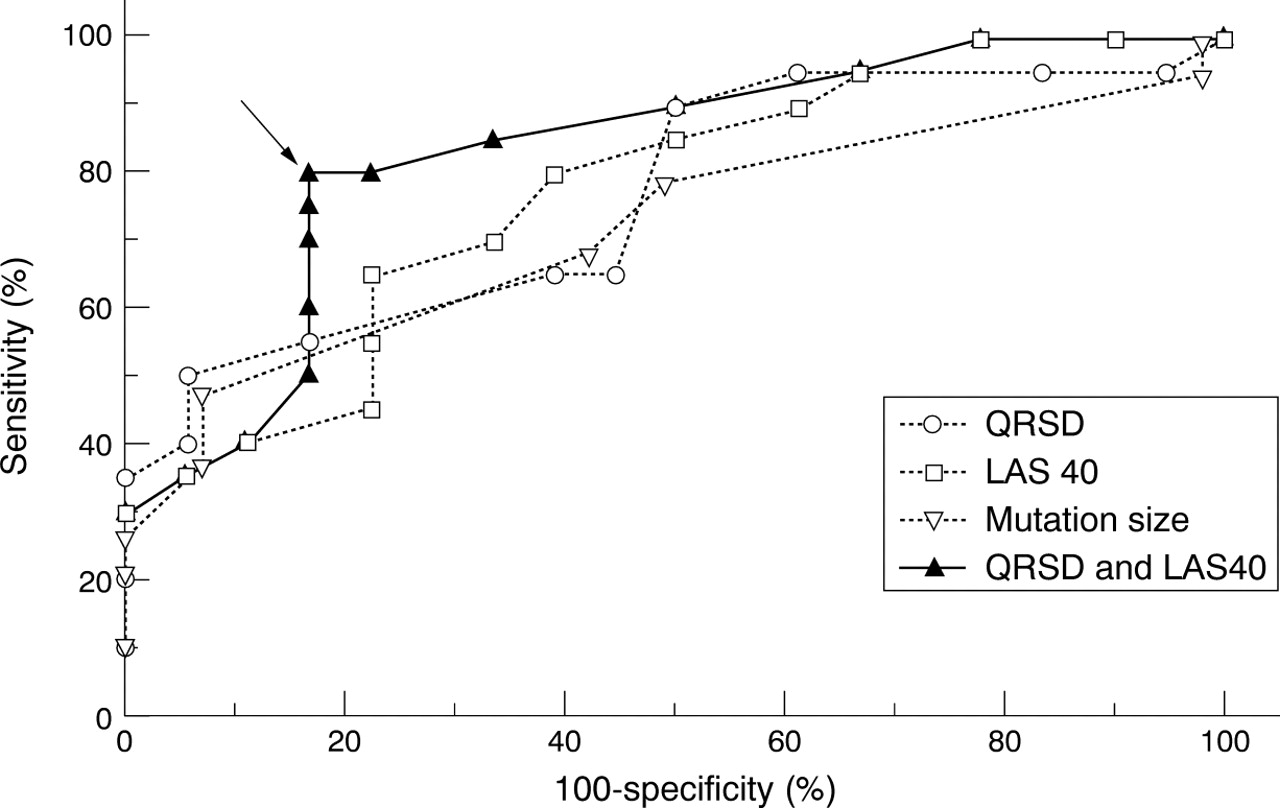
No correlation was established between the HV interval value and patient's age, disease onset, or Brooke score. Receiver operating characteristic curves did not provide a definition of a threshold in terms of age, onset of disease, or Brooke score that was capable of identifying patients with a lengthened HV interval with adequate sensitivity or specificity. Although the size of the DNA mutation was greater in the abnormal HV interval group than in the normal HV interval group, it was not capable of identifying patients with a prolonged HV interval (fig 1). On the other hand, the signal averaged ECG seemed able to identify patients with a prolonged HV interval. Though QRSD and LAS 40 alone were not useful (fig 1), the combination of both these variables increased the diagnostic value of the signal averaged ECG. The combination of QRSD ⩾ 100 ms and LAS 40 ⩾ 36 ms identified patients with a lengthened HV interval with a good sensitivity (80%) and specificity (83.3%), as shown in fig1.

Evaluation of the diagnostic value for infrahissian block of size of the DNA mutation, total QRS duration (QRSD), and duration of low amplitude signals of ⩽ 40 μV (LAS 40) on signal averaged ECG in myotonic dystrophy using receiver operating curves. The combination of QRSD ⩾ 100 ms and LAS 40 ⩾ 36 ms identified patients with a prolonged HV interval with a sensitivity of 80% and a specificity of 83.3% (arrow).
Discussion
In 39 consecutive patients with myotonic dystrophy we found a high percentage of cardiac conduction abnormalities on the resting ECG (58.9%) and during electrophysiological study (53.8%). These results are consistent with those previously reported by others, where cardiac conduction abnormalities have been observed in 50–100% of myotonic dystrophy patients,5 ,8 ,9 ,10 and a prolonged HV interval in about 50%.2 ,11 ,12 It is of note that in our study the percentage of abnormal HV intervals was not statistically different in patients with or without cardiac conduction abnormalities on the resting ECG (65.2% v 37.5%).
Cardiac conduction abnormalities expose patients with myotonic dystrophy to paroxysmal atrioventricular block and sudden death,2 ,4 ,13 ,14 and contribute to the occurrence of bundle branch block reentrant tachycardia.15 The high incidence of paroxysmal atrioventricular block in patients with an abnormal HV interval justifies the early implantation of a cardiac stimulation device in this population.4 One of the problems is to choose the ideal time to carry out an electrophysiological study, and there are at present no clinical criteria for this,13 though Hayashi et al reported that onset of disease tended to be higher in the presence of cardiac conduction abnormalities on resting ECG.16 In our study we attempted to find a threshold of age, onset of disease, and severity of neurological involvement using receiver operating characteristic curves (not shown). Sufficient sensitivity and specificity were not obtained with any of the different thresholds tested for any variable.
Since 1992 it has been possible to diagnose myotonic dystrophy by demonstrating a CTG trinucleotide expansion of ⩾ 50 triplets on chromosome 19 and by evaluating the size of the DNA mutation. A correlation has been found between the size of the mutation and the severity of the neurological symptoms,14 ,17 myocardial glucose metabolism rate, and coronary reserve.18 ,19 No correlation was found between the size of the DNA mutation and myocardial diastolic function.16 We found, as did Melaciniet al,14 a greater length of DNA mutation in patients with cardiac conduction abnormalities on ECG or electrophysiological study, but the correlation between the size of the mutation and the cardiac conduction abnormalities was insufficient. We could not define a size threshold of the DNA mutation that could permit the easy identification of patients with an abnormal HV interval (fig 1).
The signal averaged ECG has been used since the 1980s for research into late ventricular potentials in patients suffering from myocardial infarction. The origin of these potentials is delayed myocardial activation and they are considered to be a marker of ventricular arrhythmias. In patients with muscular dystrophy late ventricular potentials are frequent whereas ventricular arrhythmias are rarely documented.20 Delayed myocardial activation in muscular dystrophy is consistent with the increase in QRSD and LAS 40 in patients with infrahissian conduction abnormalities that we observed in our abnormal HV interval group. In muscular dystrophy patients, the prolongation of QRSD and LAS 40 seems to reflect delayed activation in the His and Purkinje tissues rather than scattered areas of fibrosis as in myocardial infarction. This explains the relation between the signal averaged ECG parameters and the HV interval value in our study. Thus the identification of patients with an abnormal HV interval is possible by this non-invasive technique. We tested different QRSD and LAS 40 thresholds and concluded that the best criterion for identifying muscular dystrophy patients with an abnormal HV interval is the combination of QRSD ⩾ 100 ms and LAS 40 ⩾ 36 ms. The sensitivity and specificity of this criterion were very acceptable at 80.0% and 83.3% respectively. This method is advantageous because it can easily be repeated at regular intervals, avoiding the need to carry out regular electrophysiological studies as recommended by Prystowskyet al, who showed an HV interval increase of 5 ms/year in myotonic dystrophy.21
Our results indicate that intracardiac conduction should be measured in adult myotonic dystrophy patients whatever their age and sex, onset of disease, severity of the neurological involvement and cardiac symptoms, cardiac abnormalities on resting ECG, and the size of the DNA mutation. Selection of patients who need to undergo electrophysiological studies can be made using the signal averaged ECG. A QRSD value of ⩾ 100 ms and an HFD 40 value of ⩾ 36 ms appears to be the most useful criterion for identifying patients with infrahissian cardiac conduction abnormalities.