Article Text

Abstract
OBJECTIVE To determine whether myocardial contrast echocardiography (MCE) following intravenous injection of perfluorocarbon microbubbles permits identification of resting myocardial perfusion abnormalities in patients who have had a previous myocardial infarction.
PATIENTS AND INTERVENTIONS 22 patients (mean (SD) age 66 (11) years) underwent MCE after intravenous injection of NC100100, a novel perfluorocarbon containing contrast agent, and resting99mTc sestamibi single photon emission computed tomography (SPECT). With both methods, myocardial perfusion was graded semiquantitatively as 1 = normal, 0.5 = mild defect, and 0 = severe defect.
RESULTS Among the 203 normally contracting segments, 151 (74%) were normally perfused by SPECT and 145 (71%) by MCE. With SPECT, abnormal tracer uptake was mainly found among normally contracting segments from the inferior wall. By contrast, with MCE poor myocardial opacification was noted essentially among the normally contracting segments from the anterior and lateral walls. Of the 142 dysfunctional segments, 87 (61%) showed perfusion defects by SPECT, and 94 (66%) by MCE. With both methods, perfusion abnormalities were seen more frequently among akinetic than hypokinetic segments. MCE correctly identified 81/139 segments that exhibited a perfusion defect by SPECT (58%), and 135/206 segments that were normally perfused by SPECT (66%). Exclusion of segments with attenuation artefacts (defined as abnormal myocardial opacification or sestamibi uptake but normal contraction) by either MCE or SPECT improved both the sensitivity (76%) and the specificity (83%) of the detection of SPECT perfusion defects by MCE.
CONCLUSIONS The data suggest that MCE allows identification of myocardial perfusion abnormalities in patients who have had a previous myocardial infarction, provided that regional wall motion is simultaneously taken into account.
- myocardial contrast echocardiography
- NC100100
- single photon emission computed tomography
- perfusion
Statistics from Altmetric.com
The recent emphasis on interventional manoeuvres, such as thrombolysis, coronary angioplasty, and coronary artery bypass graft surgery has intensified the desire of clinical cardiologists to obtain accurate and reproducible estimates of regional myocardial perfusion. Currently, myocardial perfusion imaging with201thallium1-3 or 99mTc sestamibi4-6 is the only commonly available method used to depict the relative distribution of myocardial blood flow, and thus to identify regional defects in myocardial perfusion. Although this modality is widely employed, images of myocardial perfusion obtained with these agents suffer from the poor resolution of the current single photon emission computed tomography (SPECT) devices, from the effects of photon attenuation which can result in false or artefactual perfusion abnormalities,7 and from the lack of concomitant information of regional contractile function.
Myocardial contrast echocardiography (MCE) is a relatively new technique that uses microbubbles to produce myocardial opacification.8 Although assessment of myocardial perfusion by MCE has been validated in experimental models9 and used in the catheterisation laboratory,10 its widespread application to coronary patients has been limited by the need to inject the microbubbles into the aorta or directly into the coronary arteries. Recently, three major advances have enabled the detection of myocardial perfusion after intravenous injections of microbubbles. The first is the development of second generation microbubbles containing non-diffusible, high molecular weight gases, with low solubility, which are more resistant than air filled microbubbles to change in size when mixed with blood, and which therefore persist long enough to reach and opacify the myocardium.11 The second advance is the detection of microbubble specific backscatter signals, which are generated at a harmonic frequency of the transmitted frequency. This results in a better contrast-to-tissue signal than with conventional fundamental imaging.12 The third advance is the use of intermittent imaging, which greatly reduces ultrasound induced microbubble destruction and hence results in a severalfold increase in myocardial opacification.12 ,13 In the present study, we made use of these recent improvements to evaluate whether MCE with NC100100, a novel second generation ultrasonic contrast agent, was able to delineate myocardial perfusion abnormalities in patients with a previous myocardial infarction, using 99mTc sestamibi SPECT as the gold standard.
Methods
STUDY POPULATION
The present study was part of a phase II trial, the protocol for which had been approved by the ethical committees of the Cliniques Universitaires St Luc, Brussels, and the Hammersmith Hospital, London. All patients gave written informed consent to participate in the study. Patients who had experienced a previous myocardial infarction (more than five days but less than one year previously) comprised the study population. Other inclusion criteria were age > 18 years and echocardiographic images of sufficient quality to allow adequate visualisation of all myocardial segments from the apical two and four chamber views, and from the apical long axis view. Exclusion criteria were pregnancy, lactation, unstable angina, and myocardial infarction within the previous five days or more than a year ago. The final population consisted of 22 patients (17 men, mean (SD) age 66 (11) years, range 49–89 years). The location of the infarction was anterior in 13 patients, inferior in seven, apical in one, and posterior in one.
SELECTIVE CORONARY ARTERIOGRAPHY
Selective coronary arteriography and contrast left ventriculography were performed from the femoral approach before the echocardiographic and scintigraphic studies. Significant coronary artery disease was defined as > 75% luminal diameter stenosis. The infarct related artery was completely occluded in 12 patients and severely stenosed in the remaining 10 patients. Twelve patients had single vessel coronary artery disease, five patients had two vessel disease, and five patients had three vessel disease.
MYOCARDIAL CONTRAST ECHOCARDIOGRAPHY
NC100100 (Nycomed, Oslo, Norway), a second generation contrast agent made of perfluorocarbon filled microbubbles with a mean diameter of 3–5 μm, was used in this study. This agent has been demonstrated to be well tolerated and safe, both in experimental animals and in healthy volunteers. Intravenous injections of a low dose (0.006–0.03 μl/kg, n = 10), a medium dose (0.10–0.15 μl/kg, n = 7) or a high dose (0.3 μl/kg, n = 5) of the agent were used in each view, followed by a 10 ml saline flush. Ultrasound images were obtained with an HP Sonos 2500 prototype system or with a commercially available ATL HDI-3000-CV system. Both echocardiographic systems were equipped with a prototype broadband transducer transmitting at either 1.67 or 1.8 MHZ and receiving at either 3.3 or 3.6 MHZ (harmonic). The dynamic range of the two echocardiographic systems was approximately 50–60 dB. Gain settings were carefully adjusted at the beginning of each study to yield a mechanical index of 0.5–0.7 and to give the myocardium a dark grey appearance. Images were recorded on videotape as well as on optical disks.
Before any contrast was injected, fundamental cross sectional echocardiographic images from the three apical views were recorded and digitised in a cineloop format, for subsequent assessment of regional wall motion. After acquisition of baseline fundamental images, the imaging mode was switched from fundamental to harmonic. Image acquisition in each view was begun before injection of contrast, and continued for approximately five minutes. As soon as the contrast agent was injected, imaging was switched from continuous to intermittent. In the intermittent mode, ultrasound is transmitted once every cardiac cycle. By gating to the peak of the T wave on the ECG, images were acquired when left ventricular cavity size was the smallest and contained the least amount of microbubbles, thereby minimising the possibility of acoustic shadowing. Although images were acquired continuously for the first five minutes after contrast injection, only the images in which minimal cavity attenuation was present were retained for analysis. For the lowest doses of contrast, attenuation was never a problem and bolus images were used for analysis. With higher doses of contrast, significant attenuation was usually noted in the left ventricular cavity. When this occurred, we only analysed the images in which attenuation had decreased sufficiently to involve only the mitral valve and the left atrium, and not the myocardium.
SPECT IMAGING
99mTc Sestamibi SPECT was obtained in every patient within 48 hours of the MCE examination. For this purpose, 30 mCi of99mTc sestamibi were injected intravenously at rest. Approximately 1–2 hours after injection, SPECT images were obtained with a wide field of view rotating camera equipped with a high resolution, parallel hole collimator centred on the 140 keV photon peak with a 20% window. The camera was rotated over a 180° arc in a circular orbit around the patient's thorax from a right anterior oblique angle of 40° to a left posterior angle of 40° at 6° increments of 30 seconds each. The data were reconstructed in short axis, vertical, and longitudinal long axis views with an in-plane and z axis resolution of 13 mm, a 6.2 mm per pixel sampling, and a 6.2 mm separation between slices.
DATA ANALYSIS AND IMAGE INTERPRETATION
The SPECT and MCE images were interpreted by pairs of observers blinded to the clinical and the other method results. A second lecture was performed > 3 months later for determination of observer variability. Differences in opinion were resolved by consensus. For both SPECT and MCE, myocardial opacification or tracer uptake were assessed in 16 myocardial segments (basal, midventricular, and apical levels of the septum, and the lateral, anterior, and inferior walls; and basal and midventricular levels of the anteroseptal and posterior walls)14 and defined as 1 = normal, 0.5 = reduced, and 0 = absent.15 Regional wall motion was analysed along the same 16 myocardial segments and graded as 1 = normal, 2 = hypokinetic, and 3 = akinetic.16
STATISTICAL ANALYSIS
Continuous variables are expressed as mean (SD). The sensitivity, specificity, and accuracy of MCE for detection of SPECT regional perfusion abnormalities were obtained in the usual way. The ability of MCE to predict SPECT results in the different coronary vascular territories was assessed by ascribing the septum and the anteroseptal and anterior walls to the left anterior descending coronary artery, the lateral all to the left circumflex coronary artery, and the inferior wall to the right coronary artery. Because of the varying vascular supply of the apex, this was allocated to any of the other involved territory. If the apex alone was involved, the left anterior descending coronary artery was imputed. Likewise, the posterior wall was ascribed to either the left circumflex or the right coronary artery if either was involved. The presence of perfusion abnormalities by either MCE and SPECT according to baseline wall motion was evaluated by the MacNemar test for paired data. Concordance between MCE and SPECT was evaluated by use of the κ statistics. Values of p < 0.05 were considered indicative of a significant difference. To determine the observer variability, 10 sets of SPECT and MCE images were read twice, by the same observers. The interval between the two consensus interpretation and readings was > 3 months.
Results
MYOCARDIAL PERFUSION BY SPECT AND MCE AMONG NORMALLY CONTRACTING AND DYSFUNCTIONAL SEGMENTS
A total of 345 segments were analysed, of which 80 showed akinesia, 62 showed hypokinesia, and 203 were normal.
Normally contracting segments
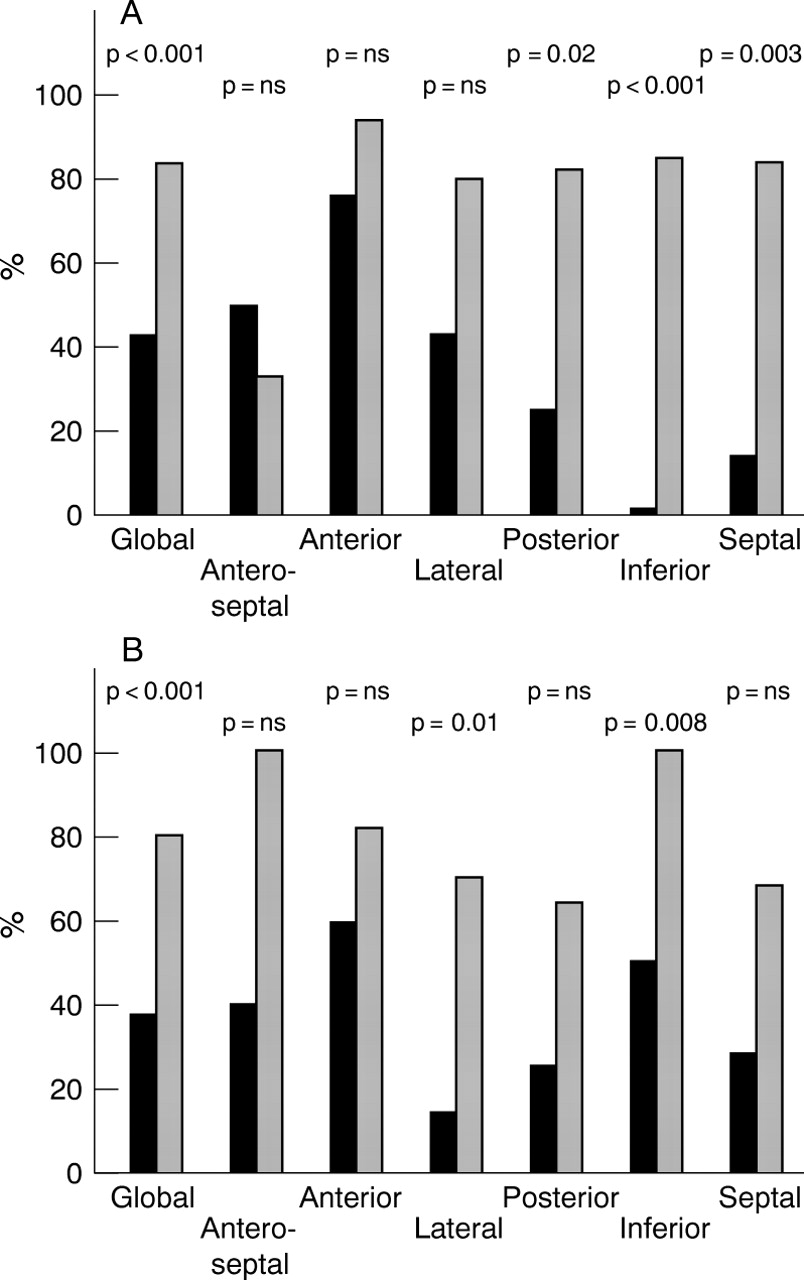
Among the 203 normally contracting segments, 151 (74%) showed normal tracer uptake by SPECT and 145 (71%) showed normal opacification by MCE. Figure 1 shows the regional distribution of perfusion abnormalities in normally contracting segments for both SPECT and MCE. With SPECT, abnormal tracer uptake was mainly found among normally contracting segments from the inferior wall. By contrast, with MCE poor or inadequate myocardial opacification was noted essentially among the normally contracting segments from the anterior and lateral walls. Similar results were obtained when segments were grouped by vascular territories (fig 2)

(A) Percentage of normally contracting segments displaying normal myocardial opacification by MCE (solid bars) and tracer uptake SPECT (grey bars). (B) Percentage of dysfunctional segments displaying poor myocardial opacification by MCE (solid bars) and reduced uptake SPECT (grey bars). Segments were grouped by echocardiographic walls.

(A) Percentage of normally contracting segments displaying normal myocardial opacification by MCE (solid bars) and tracer uptake SPECT (grey bars). (B) Percentage of dysfunctional segments displaying poor myocardial opacification by MCE (solid bars) and reduced uptake SPECT (grey bars). Segments were grouped by vascular territories.
Dysfunctional segments
Among the 142 dysfunctional segments, 87 (61%) showed abnormal tracer uptake by SPECT and 94 (66%) showed abnormal opacification by MCE. As shown in fig 3, with both methods perfusion abnormalities were seen more frequently among akinetic than hypokinetic segments. In akinetic segments, perfusion abnormalities were found more frequently in the anteroseptal and inferior walls, when using SPECT, whereas they were equally distributed across all segments, with the exception of the anteroseptal segments, when using MCE.
Percentage of hypokinetic (solid bars) and akinetic (grey bars) segments displaying poor myocardial opacification by MCE (A) or reduced tracer uptake SPECT (B).
COMPARISON OF MCE AND SPECT, USING SPECT AS THE GOLD STANDARD
Figure 4 depicts a representative perfusion study by SPECT and MCE in a patient with a previous anterior myocardial infarction. Overall, among the 345 segments available for analysis, 206 (60%) showed normal tracer uptake and 139 (40%) reduced tracer uptake by SPECT. Of the 139 segments with reduced tracer uptake by SPECT, 81 (58%) showed poor or inadequate myocardial opacification by MCE. Similarly, of the 206 segments exhibiting normal tracer uptake by SPECT, 135 (66%) showed normal or adequate myocardial opacification by MCE. Overall concordance between the two methods was 62% (κ = 0.24). As shown in fig 5, MCE best identified SPECT tracer uptake abnormalities when they involved the lateral, posterior, and anterior walls, whereas it was the least specific in segments from the lateral and anterior walls.

Representative MCE and SPECT images obtained in a patient with anterior myocardial infarction, showing a larger perfusion defect by SPECT than MCE: (top left) apical four chamber MCE; (bottom left) apical two chamber MCE; (top right) apical four chamber SPECT; (bottom right) apical two chamber SPECT. Arrows delineate the area of decreased opacification/tracer uptake.

Sensitivity (A) and specificity (B) of MCE for detection of myocardial perfusion abnormalities by SPECT before (solid bars) and after (grey bars) exclusion of possible attenuation artefacts, defined as abnormal perfusion despite normal contraction.
Because flow and function are tightly coupled at rest, we reasoned that any perfusion defect in a segment with a normal contraction could be considered as an artefact. This occurred in 52/203 (26%) normally contracting segments with SPECT and 58/203 (29%) with MCE. As shown in fig 6, the concordance between MCE and SPECT improved to 82% (κ = 0.65) when considering all normally contracting segments with poor myocardial opacification or reduced tracer uptake as artefactual. Similar results were obtained when segments were grouped by vascular territories.

Sensitivity, specificity, and overall accuracy of MCE for detection of myocardial perfusion abnormalities by SPECT before (solid bars) and after (grey bars) exclusion of possible attenuation artefacts.
OBSERVER VARIABILITY
The concordance between the two consensus interpretation and reading sessions was 98% for SPECT (κ = 0.97) and 83% for MCE (κ = 0.63).
Discussion
The results of the present study indicate that intravenous injections of NC100100 during second harmonic intermittent imaging in patients with previous myocardial infarction allows delineation of myocardial perfusion abnormalities, the anatomical location of which correlates, albeit modestly, with that of regional contraction abnormalities and that of SPECT perfusion abnormalities. The results also indicate that assessment of myocardial perfusion by either SPECT or MCE is subject to a large number of attenuation artefacts, which predominate in the inferior wall for SPECT and in the anterior and lateral walls for MCE. Consideration of these attenuation artefacts improves the ability of MCE to predict the perfusion status by SPECT. Finally, our results show that SPECT exhibit a higher degree of observer agreement than MCE.
ASSESSMENT OF MYOCARDIAL PERFUSION BY SPECT AND MCE.
With the advent of interventional strategies aimed at restoring coronary patency and improving myocardial blood flow, the non-invasive assessment of myocardial perfusion has become increasingly important, not only to establish the diagnosis of coronary artery disease, but also to evaluate the risk of adverse cardiac events and choose the most appropriate treatment strategy once the diagnosis has been made. Currently, myocardial perfusion imaging with radiolabelled flow tracers, such as 201thallium1-3 or99mTc sestamibi4-6 is the only commonly available method for assessment of myocardial perfusion in daily clinical practice. Experimentally, the myocardial retention of these flow tracers has been shown to be proportional to myocardial blood flow, measured with radiolabelled microspheres, over a wide range of pathophysiological flow conditions.6 From an imaging point of view, the myocardial distribution of 201thallium or99mTc sestamibi has been shown to depict accurately the relative distribution of myocardial blood flow, making it possible to image non-invasively regional defects in myocardial perfusion.1 ,17 Clinically, these agents have been employed successfully to establish the diagnosis of coronary artery disease,18 to evaluate the results of coronary interventions, such as thrombolysis,19 coronary angioplasty, and coronary artery bypass graft surgery, and to predict the likelihood of adverse cardiac events in patients with known ischaemic heart disease.20 Unfortunately, despite its widespread clinical use, the accuracy of SPECT perfusion imaging remains limited by the poor resolution of the current SPECT devices, by the effects of photon attenuation which can cause perfusion artefacts,7 by the non-linear relation between myocardial blood flow and tracer retention,6 and by the lack of concomitant information of regional contractile function, unless gating is used.
It has been suggested that MCE, a novel echocardiographic method that uses microbubbles to produce myocardial opacification, could obviate some of the problems encountered with radionuclide perfusion imaging. Cross sectional echocardiography is a well established method for assessment of regional and global myocardial function, whose spatial resolution is considerably better than that of SPECT. Experimental studies have shown that MCE is able to delineate myocardial perfusion abnormalities in the setting of total coronary occlusion and reperfusion, provided that the ultrasonic contrast agent is administered in the aortic root or directly into the coronary arteries.9 Recent advances in microbubble design (which prolong their half life in blood and permit them to reach and opacify the myocardium),11 and the introduction of intermittent second harmonic imaging (which greatly facilitates the detection of these microbubbles in the myocardium),12 ,13 have made it possible to produce good quality images of myocardial perfusion after intravenous injection of the ultrasonic contrast agents. These images are acquired and displayed in the same format and orientation as conventional functional imaging. MCE thus offers the unique opportunity to assess perfusion and function simultaneously. Despite this prospect, very few data exist regarding the ability of MCE to detect coronary artery disease directly in patients.
Kaul and colleagues recently reported their preliminary experience in 30 patients with known or suspected coronary artery disease undergoing dipyridamole stress, in whom they compared myocardial perfusion abnormalities by SPECT and MCE.21 By use of sophisticated postprocessing techniques of MCE images, including background subtraction and colour coding, they obtained an excellent concordance (of nearly 90%) between the two imaging modalities. Similar results had been previously reported by Porter and colleagues, who used a quantitative videodensitometric method to analyse the MCE images.22 Interestingly, in this study, the authors also reported the results of the simple visual assessment of MCE images, the sensitivity of which was merely 48% compared to 92% for the quantitative evaluation.
The results of the present investigation extend these earlier observations to the situation of patients with a previous myocardial infarction.23 To obtain a detailed description of the perfusion status of these patients, we first compared resting segmental perfusion with resting segmental contraction. This allowed us to evaluate the incidence as well as the segmental distribution of opacification or uptake artefacts with both techniques (based on the assumption that flow and function should be closely coupled under resting conditions).24 As expected, the results indicated that SPECT was associated with a significant number of artefacts, which predominate in the inferior segments of the left ventricle.7 The results also showed that MCE generates a equal number of artefacts, whose anatomical distribution differs, however, from that of SPECT and predominates in the basal and midventricular segments of the anterior and lateral walls.
We then investigated whether SPECT and MCE were equally able to identify the presence of perfusion abnormalities among dysfunctional infarcted segments. The results indicated that the prevalence of perfusion abnormalities with both techniques was much less in hypokinetic than akinetic segments. It was similar, however, between the two methods. Although in akinetic segments the concordance between SPECT and MCE was acceptable, the concordance between the two methods in the other segments was rather poor. Interestingly, analysis of the potential causes of discrepancies between SPECT and MCE indicated that they were probably related to the different way artefacts are generated with these two methods as well as to the divergent spatial distribution of these artefacts. Indeed, systematic exclusion of the segments which presented with a poor myocardial opacification or reduced tracer uptake and a normal contraction, which we therefore considered as potentially artefactual, greatly enhanced the concordance between SPECT and MCE.
STUDY LIMITATIONS
This study has several limitations which should not be ignored. First, we have chosen to compare myocardial opacification by MCE with myocardial tracer uptake by SPECT. A potential limitation inherent in many comparative studies of this type is the potential for unintentional yet important bias caused by the inadequate alignment of SPECT and echocardiographic images. This could explain in part the low accuracy of MCE to predict the perfusion status by SPECT. To minimise this problem, we used the same 16 segment model with both SPECT and MCE. Although this probably did not solve all the problems, we feel it considerably improved our ability to compare the two techniques.
Second, we recognise that the methods used for both MCE acquisition and analysis were probably suboptimal. As suggested by other investigators, it is possible that our use of a single triggering interval, as well as our lack of use of digital background subtraction or absolute quantification of the contrast effects, further contributed to the relative lack of accuracy of MCE in our study.
Third, being part of larger dose finding phase II trial, this study used different doses of NC100100 to produce myocardial opacification. From an imaging point of view, the highest doses consistently resulted in significant acoustic shadowing over the left ventricular cavity and the myocardium, whereas the lowest doses only produced transient myocardial opacification that lasted for only a few beats. This forced us to delay image acquisition until shadowing only involved the mitral valve plane and the left atrium when using the high doses, and to rely on the early bolus images for the lower doses. Although we did not observe any significant differences between the various dose groups in terms of concordance between SPECT and MCE (data not shown), we cannot exclude the possibility that use of different doses of contrast also contributed to the moderate degree of concordance between the two methods.
Fourth, the present study was conducted in a relatively small number of patients. Although the data show interesting similarities between SPECT and MCE with regard to the assessment of regional perfusion, these findings need to be confirmed in a larger group of patients before MCE could complement or even compete with SPECT in this indication. Also, we only recruited patients with a previous myocardial infarction in whom we only performed resting imaging. Further studies are thus required to verify whether the present results can be applied to patients with other pathophysiological entities or who are being evaluated under stress conditions.
Finally, the observer variability was better for SPECT than for MCE. This is not surprising as SPECT images were interpreted by observers having years of experience with this technique, whereas this was our first experience with MCE after intravenous contrast injection. It remains that the current observer variability of MCE constitutes a major limitation to its use. More reliable and probably also more quantitative analysis tools should therefore be developed before this technique can enter the clinical arena.
CONCLUSIONS
Our study shows that MCE with intravenous NC100100 allows identification of perfusion abnormalities whose anatomical distribution correlate, albeit modestly, with that of regional contraction abnormalities and that of SPECT perfusion abnormalities. Our results also indicate that MCE is subject to a large number of attenuation artefacts, that predominate in the anterior and lateral walls, which clearly affect its accuracy and therefore currently makes it unsuitable for daily clinical use.
Acknowledgments
The authors wish to thank Claudio Marelli and Yngvil Kloster from Nycomed-Amersham, AS, for their thoughtful advises in the preparation of this manuscript