Article Text

Abstract
OBJECTIVE To compare the accuracy and feasibility of harmonic power Doppler and digitally subtracted colour coded grey scale imaging for the assessment of perfusion defect severity by single photon emission computed tomography (SPECT) in an unselected group of patients.
DESIGN Cohort study.
SETTING Regional cardiothoracic unit.
PATIENTS 49 patients (mean (SD) age 61 (11) years; 27 women, 22 men) with known or suspected coronary artery disease were studied with simultaneous myocardial contrast echo (MCE) and SPECT after standard dipyridamole stress.
MAIN OUTCOME MEASURES Regional myocardial perfusion by SPECT, performed with 99mTc tetrafosmin, scored qualitatively and also quantitated as per cent maximum activity.
RESULTS Normal perfusion was identified by SPECT in 225 of 270 segments (83%). Contrast echo images were interpretable in 92% of patients. The proportion of normal MCE by grey scale, subtracted, and power Doppler techniques were respectively 76%, 74%, and 88% (p < 0.05) at > 80% of maximum counts, compared with 65%, 69%, and 61% at < 60% of maximum counts. For each technique, specificity was lowest in the lateral wall, although power Doppler was the least affected. Grey scale and subtraction techniques were least accurate in the septal wall, but power Doppler showed particular problems in the apex. On a per patient analysis, the sensitivity was 67%, 75%, and 83% for detection of coronary artery disease using grey scale, colour coded, and power Doppler, respectively, with a significant difference between power Doppler and grey scale only (p < 0.05). Specificity was also the highest for power Doppler, at 55%, but not significantly different from subtracted colour coded images.
CONCLUSIONS Myocardial contrast echo using harmonic power Doppler has greater accuracy than with grey scale imaging and digital subtraction. However, power Doppler appears to be less sensitive for mild perfusion defects.
- myocardial contrast echo
- SPECT
- coronary artery disease
- dipyridamole stress
Statistics from Altmetric.com
Assessment of myocardial perfusion is very useful in the evaluation of coronary artery disease, as the extent of jeopardised tissue is clearly related to outcome.1-3 Currently, the only clinically feasible methods for assessing this variable involve scintigraphy, which imposes limits on the performance of these studies because of cost, availability, and radiation exposure. Myocardial contrast echocardiography has been shown in several studies to correspond with the scintigraphic assessment of regional myocardial perfusion during hyperaemia.4-6 Less favourable results have been obtained in other work examining myocardial perfusion at rest and using grey scale interpretation.7 The extent to which this reflected problems with the use of contrast echo to examine perfusion in the absence of hyperaemia, lack of integration with wall motion data, or the lack of a standard approach to the assessment of perfusion was unclear.8
Substantial problems are posed by grey scale interpretation of contrast echocardiography because differences in regional myocardial brightness on the baseline images may influence the ability to recognise contrast enhancement.7 The use of digital subtraction techniques may avoid this problem because the baseline myocardial intensity is subtracted from the contrast image, but the process of subtraction and colour coding is time consuming and technically challenging.9 ,10 Triggered harmonic power Doppler11 ,12 detects bubble destruction without reference to the underlying cross sectional image and therefore is thought to be comparable to subtracted images. Power Doppler has the advantage of being available on-line and may thus be useful in facilitating the clinical application of myocardial contrast echocardiography. However, neither technique is in standard use, and the applicability in unselected groups of patients remains to be defined.
Our aim in this study was to assess myocardial perfusion with grey scale, digital subtraction and colour coding, and harmonic power Doppler, in comparison with dipyridamole single photon emission computed tomography (SPECT), and specifically to compare the relative sensitivities of these techniques for different levels of myocardial perfusion, as defined by SPECT. The underlying hypothesis was that interpretation of triggered harmonic power Doppler is comparable to subtracted colour coded cross sectional echocardiography, and that both would be superior to grey scale imaging alone.
Methods
STUDY POPULATION
We studied 49 patients who were undergoing dipyridamole SPECT for the evaluation of known or suspected coronary artery disease. These patients were an unselected group, recruited from consecutive SPECT imaging sessions subject only to the availability of personnel and equipment to perform the contrast studies. Their mean (SD) age was 61 (12) years (27 women and 22 men). Thirty four of the patients had chest pain, and the pretest probability of coronary artery disease was 34%. Previous infarction was present in 12 patients, and the ejection fraction was 54 (14)%. Two patients had left bundle branch block, and four had evidence of a cardiomyopathy.
DIPYRIDAMOLE SPECT
A standard dipyridamole SPECT protocol was employed. After a resting injection of 300 MBq of 99Tc tetrofosmin (Myoview, Amersham, UK),13 resting images were obtained using a standard camera (Siemens Orbiter, Erlangen, Germany) to acquire 64 views over 180°, using a step and shoot protocol. Four hours later, patients underwent a standard dipyridamole stress protocol (0.56 mg/kg given intravenously over four minutes).14 At the time of the hyperaemia, a larger dose of tetrofosmin (900 MBq) was injected, and the acquisition was repeated.
After image reconstruction (Siemens ICON) employing a Butterworth filter, the data were displayed as tomographic views, polar maps, and gated SPECT using the Cequal software. Perfusion was scored in the base, mid, and apical segments of the septal and lateral walls in the horizontal long axis plane, to correspond with the apical four chamber view (fig 1). Interpretations were made by two experienced observers blinded to the clinical and echo data, and differences were resolved by consensus. To correspond with the contrast interpretation, segments were scored as either 2, normal perfusion; 1, partial perfusion; or 0, no perfusion. In addition, each segment was quantified to reflect the proportion of maximum counts (NIH Image v1.62, National Institutes of Health, Bethesda, Maryland, USA).
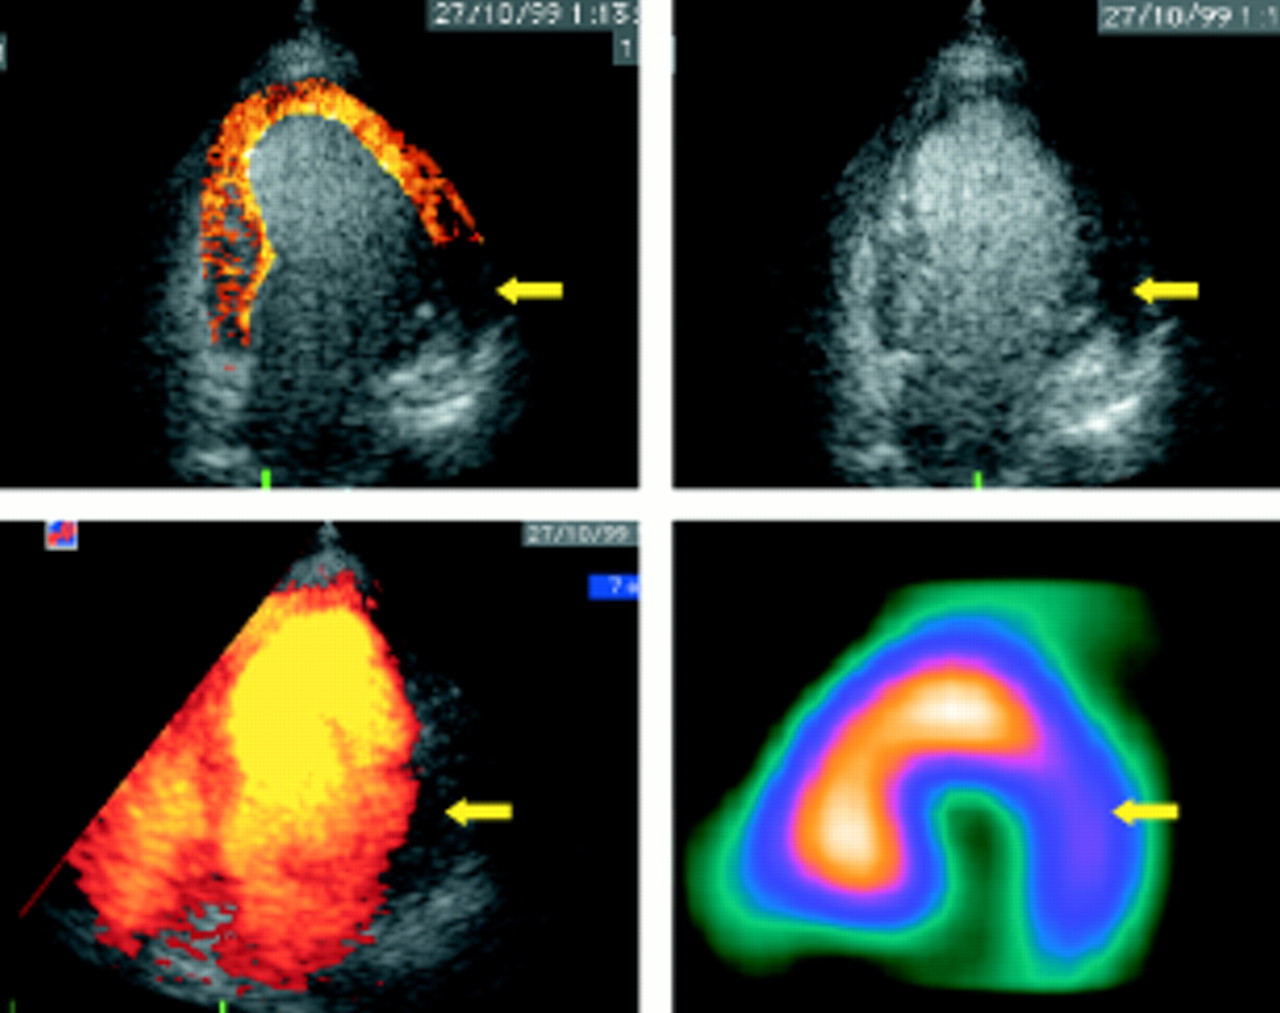
Concordant diagnosis with multiple image processing strategies. The lateral perfusion defect by single photon emission computed tomography (SPECT) is matched by lateral defects on grey scale, colour coded, and power Doppler images (arrows).
CONTRAST ECHOCARDIOGRAPHY
The echo contrast agent used in this study was Levovist (Schering), an air filled galactose microbubble (mean size 3–4 μm) coated with palmitic acid, which slows the diffusion of air and also makes the bubbles stable enough to cross the pulmonary microcirculation. A total dose of 8 g (approximately 400 mg/ml) was infused intravenously at a rate of 5 ml/min, following an initial bolus of 4 ml, and the rate was altered to maintain attenuation at the level of the mitral valve in the apical four chamber view. There were no adverse reactions to the contrast agent, but five of the 49 patients reported local irritation at the injection site.
Baseline images were performed with a standard echocardiography machine (HDI5000, Advanced Technology Laboratories, Bothell, Washington, USA) using the P4–2 ultrasound probe. All contrast images were performed during dipyridamole induced hyperaemia. For grey scale images, the machine was set up with a mechanical index of 1.1, wide dynamic range, and frame rate of 37 Hz. For harmonic power Doppler, the mechanical index was increased to 1.3, a pulse repetition frequency of greater than 2000 was used, and a slower frame rate was achieved (14 Hz). The apical four chamber view was imaged at baseline and during Levovist infusion, using end systolic triggering of 1:4 and 1:6 for grey scale and harmonic power Doppler images. Baseline and contrast triggered images were recorded on Super VHS videotape, and then digitised off-line using a Power Macintosh G3 (Apple Computers, Cupertino, California, USA).
Using software obtained from the University of Virginia, digitised baseline and contrast images at each trigger interval were averaged, and then the baseline images were digitally subtracted from the contrast images. The resulting image was then colour coded using a heated object algorithm. Only triggered images were analysed to avoid bias introduced by wall motion data. The same myocardial perfusion assessment was used for grey scale, subtracted colour coded images, harmonic power Doppler, and SPECT. Perfusion was scored in the basal, mid, and apical segments of the septal and lateral walls, confined to the apical four chamber view, by two experienced observers blinded to clinical and SPECT data, and differences were resolved by consensus. Segments were scored as either 2, normal perfusion; 1, partial perfusion; or 0, no perfusion. In addition, video intensity in each mode was quantified as per cent of maximum intensity.
STATISTICAL ANALYSIS
For overall sensitivity and specificity, segmental scores for grey scale, subtracted colour coded, and power Doppler were cross tabulated and compared with the segmental scores for SPECT using the χ2 test. For sensitivity according to level of SPECT defect severity, McNemar's test for paired data was used to compare digital subtraction with power Doppler and grey scale, and grey scale with power Doppler. Pearson correlation was used to compare quantitative measures of video intensity by grey scale versus percent of maximum count by SPECT.
Results
Of the 49 patients, 13 developed chest pain or ST segment changes during stress testing. SPECT images were interpretable in all patients. Echocardiographic images were considered uninterpretable in four patients (8%) because of poor image quality or incomplete opacification by all three methods, and were excluded from the analysis.
MYOCARDIAL PERFUSION SCINTIGRAPHY
The SPECT images were completely normal in 28 patients; the remainder showed scar in nine and ischaemia in 13. Gated SPECT showed significant left ventricular enlargement or dysfunction in 12 patients without evidence of coronary heart disease.
Of 270 left ventricular segments evaluated, 45 (17%) were identified as abnormal by SPECT (either as partial or complete perfusion defects, score 0 or 1), and 225 segments (83%) were completely normal by SPECT. Quantitative analysis of the SPECT images showed the activity (mean (SD)) in segments scored 0, 1, and 2 to be 51 (12)%, 65 (6)%, and 74 (4)%, respectively.
EFFECT OF VARIATION OF MYOCARDIAL CONTRAST ECHO DEFECT INTENSITY ON CORRELATION WITH SPECT
Detection of severe SPECT defects
Because of the likelihood that severe defects imply true perfusion abnormalities (rather than potential false positives), segmental accuracy was initially calculated based on the detection of a complete SPECT perfusion defect (that is, a severe defect with a score of 0). The specificity of a complete contrast echo abnormality (severe defect with score of 0) for severe SPECT defects was high (75–83%, table 1), and the specificity of power Doppler exceeded that of grey scale imaging. However, the sensitivity of severe (rather than all) contrast echo defects for severe SPECT defects ranged from 19% to 31% (NS).
Performance of grey scale, colour coded, and power Doppler contrast echo techniques for detecting SPECT defects
We therefore assessed the detection of a complete SPECT perfusion defect (that is, a severe defect with score of 0) byany contrast echo abnormality (that is, a score 0 and 1) (table 1). The specificity of the techniques ranged from 42–54% (NS). False positive colour coded images in areas of normal SPECT perfusion (figs 2, 3, 4, 5 and 6) reflected technical problems such as interpretation of the septal stripe, caused by areas where the regional brightness was high at baseline (fig 2). Finally, some of these “false negative” segments by contrast echocardiography were actually false positive SPECT images, for example in a patient with left bundle branch block (fig6).

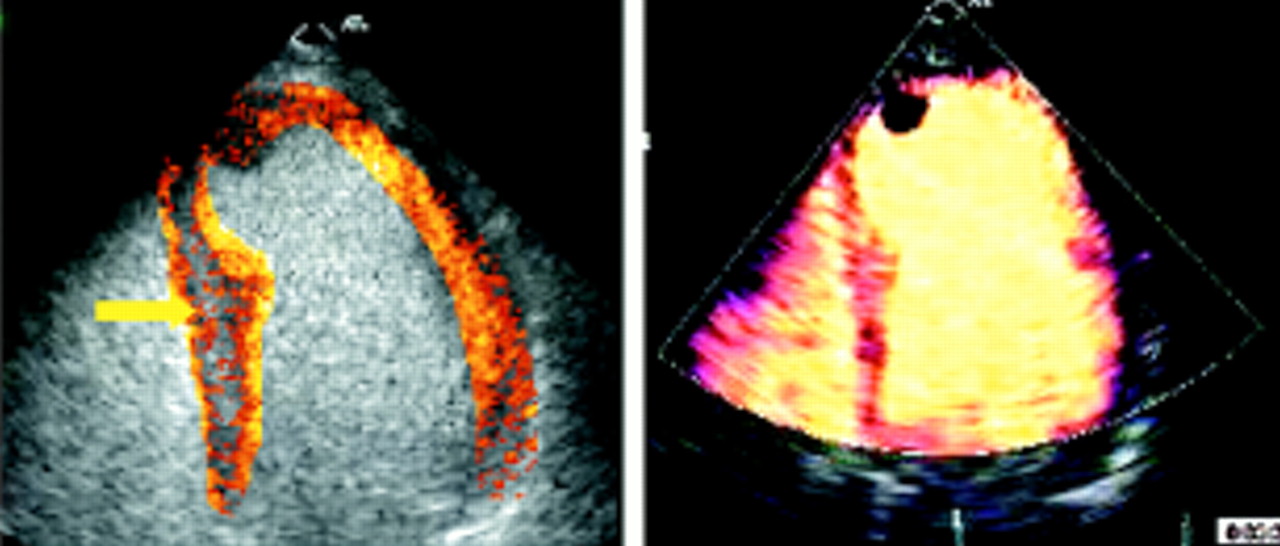
False positive contrast perfusion defect caused by a “septal stripe” (arrow). This appearance is caused by inhomogeneity of the resting image and reflects the disadvantage of simple subtraction.

False positive perfusion defect because of attenuation. An apical perfusion defect is detected using each technique. However, power Doppler shows another apparent defect in the basal septum (arrow), not matched on SPECT or colour coded imaging. This false positive is attributed to attenuation.

Apical defect shown by both single photon emission computed tomography (SPECT) and contrast echo (arrow), with unmatched lateral wall defect by contrast echocardiography (large arrow). This artefact is caused by overlying lung.

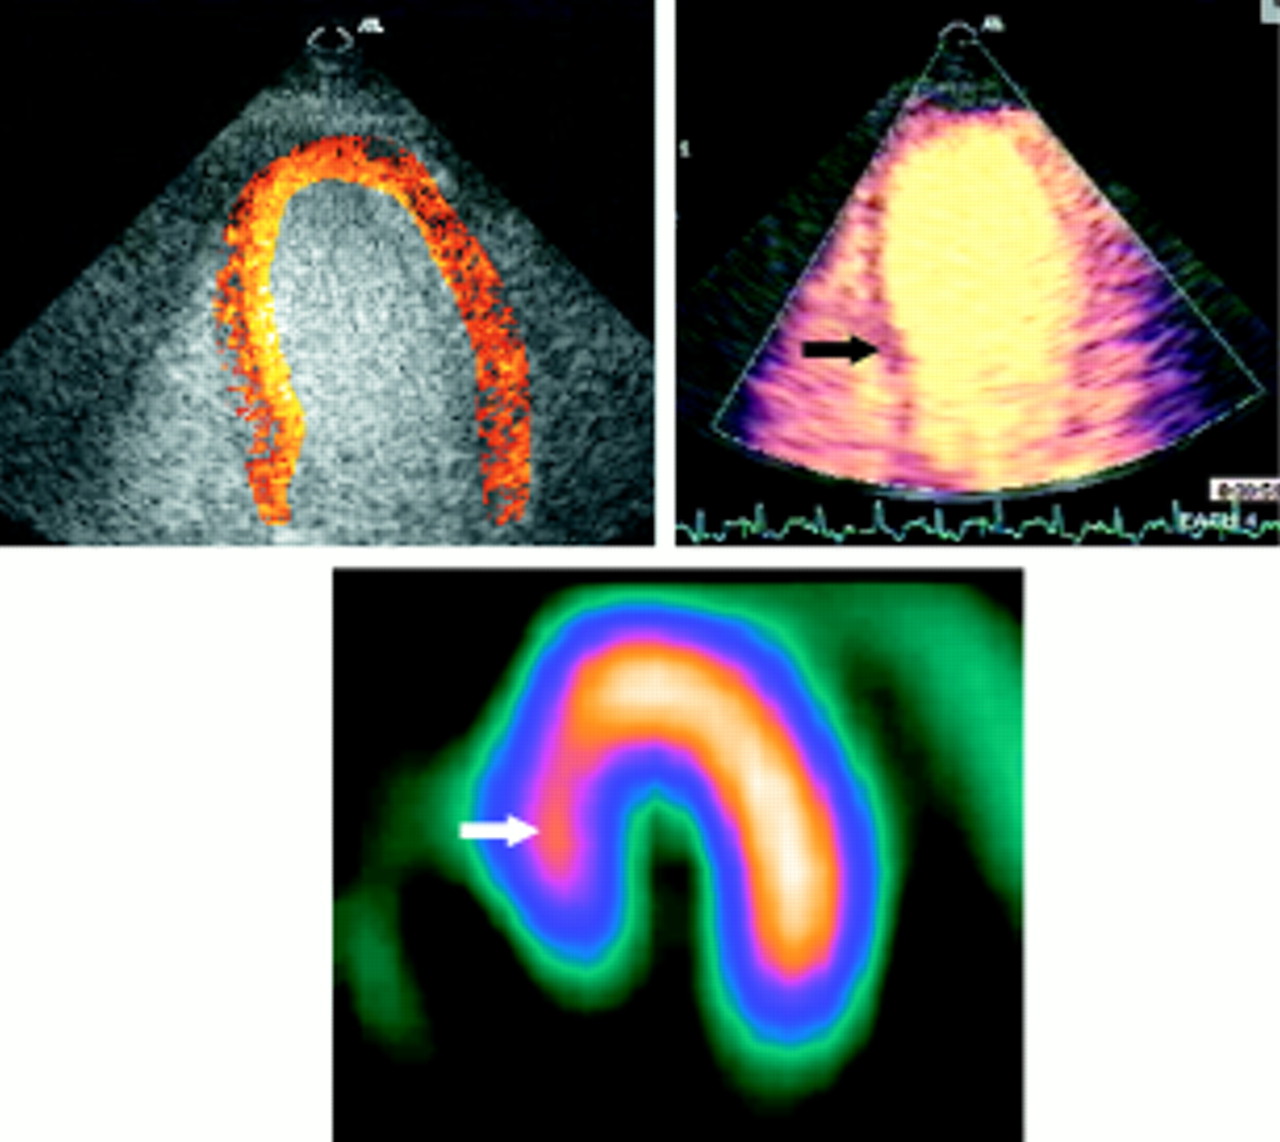
Apparently normal image with digital subtraction and colour coding in a patient with a mild perfusion defect in the basal septum on the SPECT and power Doppler images (arrows). This false negative contrast pattern with digital subtraction and colour coding reflects difficulties in alignment and superimposition of the images.

Discordance between single photon emission computed tomography (SPECT) with all echo techniques. The large septal perfusion defect by SPECT (arrow) is probably the result of left bundle branch block in a patient without a history of coronary artery disease.
Detection of any SPECT defects
Segmental accuracy was also recalculated based on the detection of any SPECT perfusion defect (that is, a score of 0 or 1) by any contrast echo abnormality (score 0 or 1). Once again, power Doppler showed a significantly greater sensitivity than subtracted colour coded imaging (p < 0.05). In this analysis, the sensitivity of all contrast echo techniques ranged from 47–56%, but the specificity became unacceptably low (42–56%, table 1).
CORRELATION OF MYOCARDIAL CONTRAST ECHO WITH SPECT DEFECT INTENSITY
The prevalence of contrast defects at different levels of quantitative SPECT activity varied according to the echocardiographic technique (fig 7). More severe SPECT defects were generally more likely to be associated with myocardial contrast echo perfusion defects, but there were some variations on this theme. First, in normal segments (activity > 80% maximum), power Doppler had the highest specificity; the subtracted colour coded images engendered a number of false positive results, reflecting technical problems such as difficulty related to the interpretation of the septal stripe. Second, in mild defects (70–80% of maximum SPECT activity), grey scale imaging had the largest number of abnormal segments, whereas power Doppler was less commonly positive in this range. The consequence of the lower dynamic range of harmonic power Doppler imaging may be that milder perfusion defects may not be identified unless the power Doppler signal exceeds a particular threshold level. Third, when the SPECT defect was severe, power Doppler was more commonly positive, and grey scale interpretation was less commonly positive.

Proportion of abnormal segments by myocardial contrast echo (defined by any defect), compared with quantitative SPECT activity (as per cent of maximum).
REGIONAL VARIATIONS IN MYOCARDIAL CONTRAST ECHO ACCURACY
Table 2 summarises the regional variations in the correlation between detection of any perfusion defect using SPECT and contrast echocardiography. For each technique, specificity was lowest in the lateral wall, although power Doppler was the least affected. Because of problems with the septal stripe, grey scale and subtraction techniques were less accurate in the septal wall. The apex seemed to pose particular problems for power Doppler. The reason for this was unclear—motion artefacts were rarely detected and easily recognised; bloom artefact is a possible cause.
Sensitivity, specificity, and accuracy by location
PATIENT ANALYSIS
The following criteria were applied on a per patient basis: an abnormal study was defined by the presence of defects in more than one segment by SPECT and myocardial contrast echo. The sensitivities were 67%, 75%, and 83% for grey scale, colour coded, and power Doppler, respectively, with a significant difference between power Doppler and grey scale only (p ⩽ 0.05). Specificity was also the highest for power Doppler, at 55%, but not significantly different from subtracted colour coded images. Combining patients with and without disease to generate accuracy data showed power Doppler to be the most accurate technique on a per patient basis, at 62% (fig8).

Sensitivity, specificity, and accuracy of grey scale, colour coded, and power Doppler techniques for contrast echocardiography.
Discussion
Our results indicate that the accuracy of harmonic power Doppler and digital subtraction with colour coding are significantly better than that of grey scale interpretation alone, especially with respect to segmental specificity. Power Doppler appeared to be less sensitive than subtracted colour coded grey scale imaging for the detection of mild perfusion defects. Although on a segmental basis the sensitivity of contrast echo was suboptimal, on a per patient basis the sensitivity of power Doppler and digital subtraction were closer to the clinically acceptable range. This discordance implies that, while the extent of defects is underestimated by myocardial contrast echo, at least one of the abnormal segments is identified in most patients with abnormal SPECT.
COMPARISON WITH SPECT DEFECT SEVERITY
The influence of criteria to designate a perfusion defect has an important effect on the results of contrast echocardiography. The relation with SPECT defect intensity (fig 7) implies that the optimal approach is to identify all perfusion disturbances as defects (rather than a severe reduction in activity). This provides moderate specificity but an unacceptably low sensitivity—clearly more work is needed to improve specificity in all segments.
The prevalence of contrast defects at different levels of perfusion defect severity varies according to the technique of echocardiography. For grey scale interpretation, the ability to recognise defects is related to overall image quality and is influenced by baseline image intensity.15 Thus differences in video intensity are hard to determine visually, resulting in a lower discrimination of clearly normal and clearly abnormal studies. The process of digital subtraction does not completely correct variations in grey level intensity in the resting image. Thus in colour coded images, partial perfusion defects may be seen in areas where the regional brightness was high at baseline, so that relative video intensity did not increase as much as in other areas. Harmonic power Doppler imaging has been recognised16 ,17 as having a smaller dynamic range than standard echocardiographic images, and this is reflected in fig 7.
ACCURACY OF MYOCARDIAL CONTRAST ECHO
In our segmental analysis the sensitivity of all three methods was low in comparison with SPECT. There are several reasons for this, technical limitations being the most common. In harmonic power Doppler, motion artefacts in the mid and apical lateral wall caused false negative results in a few patients. Image mismatch during postprocessing of digitally subtracted images can also cause false negative results owing to spillover of contrast from the left ventricular cavity. The selection of contrast agent may have an effect on the feasibility and accuracy of the technique. Levovist is an air filled bubble and its persistence is less than that of perfluorocarbon bubbles. The presence of lower concentrations on the left side of the heart may contribute to false positive perfusion defects. On the other hand, the nature of the bubble wall makes this agent quite favourable for bubble destruction protocols. While all the patients selected for analysis had a favourable contrast effect, incomplete opacification of the wall may have been an important contributor to the low sensitivity. The better sensitivity when data were analysed on a per patient basis suggests that abnormal territories may be identified even if not all segments can be.
The specificity of each method was acceptable, although important sources of false positives remain. Lower regional backscatter intensity in the lateral wall continues to account for false positives, but most commonly in grey scale interpretation, and this has been improved but not solved by digital subtraction and colour coding. Attenuation accounted for the highest false positive rate in all three methods, especially in the basal septum and basal lateral walls. Interpretation of the septal stripe on digitally subtracted colour coded images also created false positive results.
LIMITATIONS
In this study we evaluated myocardial perfusion only after induction of hyperaemia by dipyridamole. This aspect of the study was designed intentionally, because contrast intensity at rest reflects myocardial blood volume, while differences between segments during hyperaemia reflect differences in myocardial blood flow.18The lack of resting imaging, however, is an important limitation on both the ability to distinguish ischaemia from scar, and the recognition of perfusion defects from heterogeneity of contrast intensity.
Attention to the details of image processing and display will be important in the clinical application of contrast echocardiography. Contrast intensity changes using grey scale imaging may be subtle, and more readily appreciated using digital than videotape storage. Indeed, the digitisation of videotape images into the subtraction software may have compromised the potential accuracy of that technique, although at the time of the study we were unable to process digital files from the echo machine using this software. Moreover, despite previous experience with subtraction techniques,19 we found this approach to be technically challenging and labour intensive; it is probably not suitable for clinical use.
The limitations of the model of using SPECT as the gold standard should also be considered. Like all non-invasive tests, SPECT is attended by a significant proportion of false negative and especially false positive results.20 These false positive SPECT images—for example, those associated with left bundle branch block21—may be the source of discrepancies with “false negative” (actually normal) myocardial contrast images (fig 6). Similarly, the overrepresentation of women—in whom stress imaging tests were probably performed to avoid misleading stress ECG results—may have contributed discrepancies because of false positive SPECT scans (related to breast attenuation) as well as false negative results related to the smaller left ventricular cavity.22 We did not design the study with an angiographic comparator because our aim was to compare segmental perfusion, which may be difficult to identify from coronary angiography. Nonetheless, the availability of both SPECT and angiography may have improved the assessment of perfusion status.23
Recent interest in the area of contrast echocardiography has focused on techniques of imaging microbubbles at low ultrasound energy, without causing their destruction. Such approaches are not suited to Levovist, the agent used in this study (and the only ultrasound contrast agent licensed in many countries), because the bubble is fragile and is not present in the left heart in high concentration. Moreover, the use of low mechanical index may not be suitable for larger patients, where greater tissue penetration is needed. For these reasons, we believe that the techniques used in this paper remain relevant.
CONCLUSIONS
Harmonic power Doppler and digital subtraction with colour coding appear to have improved the specificity of grey scale images to a similar degree. The sensitivity of these approaches remains suboptimal, but it may be improved by the use of other agents and in combination with resting scanning, and by the nature of postprocessing. Sensitivity on a per patient basis is closer to being acceptable, suggesting that abnormal territories may be identified even if not all segments are identified. Finally, as harmonic power Doppler is available on line and no processing is needed, this technique appears promising for clinical application of myocardial contrast echocardiography.
Acknowledgments
This study was supported in part by grants in aid from the National Heart Foundation of Australia and the Princess Alexandra Hospital Research Foundation.