Article Text

Abstract
OBJECTIVE To investigate the differences in four formulae for heart rate correction of the QT interval in serial ECG recordings in healthy children undergoing a graded exercise test.
SUBJECTS 54 healthy children, median age 9.9 years (range 5.05–14.9 years), subjected to graded physical exercise (on a bicycle ergometer or treadmill) until heart rate reached > 85% of expected maximum for age.
DESIGN ECG was recorded at baseline, at maximum exercise, and at one, two, four, and six minutes after exercise. For each stage, a 12 lead digital ECG was obtained and printed. In each ECG, QT and RR interval were measured (lead II), heart rate was calculated, and QTc values were obtained using the Bazett, Hodges, Fridericia, and Framingham formulae. A pairedt test was used for comparison of QTc, QT, and RR interval at rest and peak exercise, and analysis of variance for all parameters for different stages for each formula.
RESULTS From peak exercise to two minutes recovery there was a delay in QT lengthening compared with RR lengthening, accounting for differences observed with the formulae after peak exercise. At peak exercise, the Bazett and Hodges formulae led to prolongation of QTc intervals (p < 0.001), while the Fridericia and Framingham formulae led to shortening of QTc intervals (p < 0.001) until four minutes of recovery. The Bazett QTc shortened significantly at one minute after peak exercise.
CONCLUSIONS The practical meaning of QT interval measurements depends on the correction formula used. In studies investigating repolarisation changes (for example, in the long QT syndromes, congenital heart defects, or in the evaluation of new drugs), the use of an ad hoc selected heart rate correction formula may bias the results in either direction. The Fridericia and Framingham QTc values at one minute recovery from exercise may be useful in the assessment of long QT syndromes.
- paediatric exercise testing
- QT interval
- QTc formulae
Statistics from Altmetric.com
Since early in the 20th century physicians have known about the dependence of the QT interval on the heart rate, though its precise mechanism remains speculative. The first mathematical models describing the relation between the QT interval and heart rate were published as far back as 1920 by Bazett1 and Fridericia2 and were later converted into correction formulae.3 Attempts to describe the underlying QT interval independent of actual QT interval and heart rate resulted in the initial formulae. These formulae were repeatedly criticised, and many attempts have been made to propose more appropriate ones.4-10 The shape relation between the QT and RR intervals is curvilinear. Mathematical forms used to model the relation between the QT interval and the RR interval include parabolic,1 polynomial,2linear,4 hyperbolic,8 and exponential forms.6 Empirical approaches describing the relation between the QT and RR intervals by tables and nomograms have also been attempted.
Despite these multiple approaches, none of the reported formulae universally satisfies the clinical needs. In paediatric cardiology reports, the Bazett formula remains the most widely used.
In clinical practice, the different clinical situations encountered may require different correction approaches. The autonomic and other physiological reflexes that lead to an increased heart rate are likely to influence cardiac depolarisation directly. The various mixtures and balances of reflexes involved in different situations that lead to an increased heart rate may alter the relation between the RR and the QT interval, even in the same individual when subjected to different heart rate provocations. Heart rate increase resulting from physical exercise, mental stress, pacing, or pharmacological agents may lead to different shapes of the QT/RR relation.
Our aim in this study was to attempt to test the appropriateness of the various heart rate correction formulae used to compute the QTc intervals, derived from ECGs recorded in healthy children subjected to graded exercise.
Methods
We investigated 54 healthy children, 30 boys and 24 girls (mean (SD) age 10.01 (2.5) years, median 9.9 years, range 5.05–14.9 years). All children had a completely normal physical examination, 12 lead ECG, and echocardiographic examination. No child had a history of cardiovascular disease, hypertension, or disease known to affect the autonomic nervous system. None was receiving drug treatment known to influence cardiac repolarisation or heart rate.
The medical ethics committee of the Academic Hospital of the Free University of Brussels approved the protocol, and the parents gave their consent.
The same investigation protocol (either treadmill or bicycle ergometer) was applied in all cases. Of the 54 children, 14 aged 8 years or younger underwent exercise testing on a treadmill using a modified Bruce protocol11; the remaining 40, who were older than 8 years, performed a graded exercise test on a bicycle ergometer according to a modified James protocol.11
After a sitting rest of at least five minutes, a standard 12 lead digital ECG was recorded using an MAC VU electrocardiographic system (Marquette Medical Systems, Milwaukee, Wisconsin, USA). The MAC VU was electronically programmed to run both the treadmill and bicycle ergometer, with a stepwise increase in the workload. A 12 lead digital ECG was recorded before beginning the test, every three minutes thereafter, at peak exercise during maximum workload, and during recovery at one, two, four, and six minutes after exercise. Performance of adequate exercise was accepted when the heart rate attained reached more than 85% of the expected maximum. Maximum heart rate (beats/min) was calculated from the formula: expected maximum heart rate = 205 − (0.5 × age in years) (guidelines reviewed by Hammond and Froelicher).12
The exercise test was accompanied by a continuous screen monitor display of lead II, V1, and V5, the median of lead V5, actual heart rate, and the predicted maximum and 85% of expected maximum heart rate.
All children were in sinus rhythm and none had a conduction disturbance. QT intervals were measured manually from lead II. For each stage, four consecutive QT intervals with their preceding RR intervals were manually measured and used for QTc calculation. QT intervals were measured from the onset of the QRS complex to the end of the T wave, defined as the intersection of isoelectric line and the tangent of maximal downward limb of the T wave.13 ,14 For each stage, heart rate was calculated from eight measured consecutive RR intervals. Four different heart rate corrected QTc interval values were obtained for each ECG, applying the following correction formulae:
- Bazett1: QTc = QT/RR interval;
- Hodges8: QTc = QT + 1.75 (heart rate − 60);
- Fredericia2: QTc = QT/3RR;
- Framingham4: QTc = QT + 0.154 (1 − RR).
STATISTICS
The baseline and peak exercise values obtained with each of the formulae were compared using standard paired two tailedt test. QTc values for each formula and for each of the stages of exercise were tested using analysis of variance and post hoc Fisher. Scheffé and Bonferroni/Dunn tests were performed. Data are represented as mean (SD). A probability value of p < 0.05 was considered significant.
Results
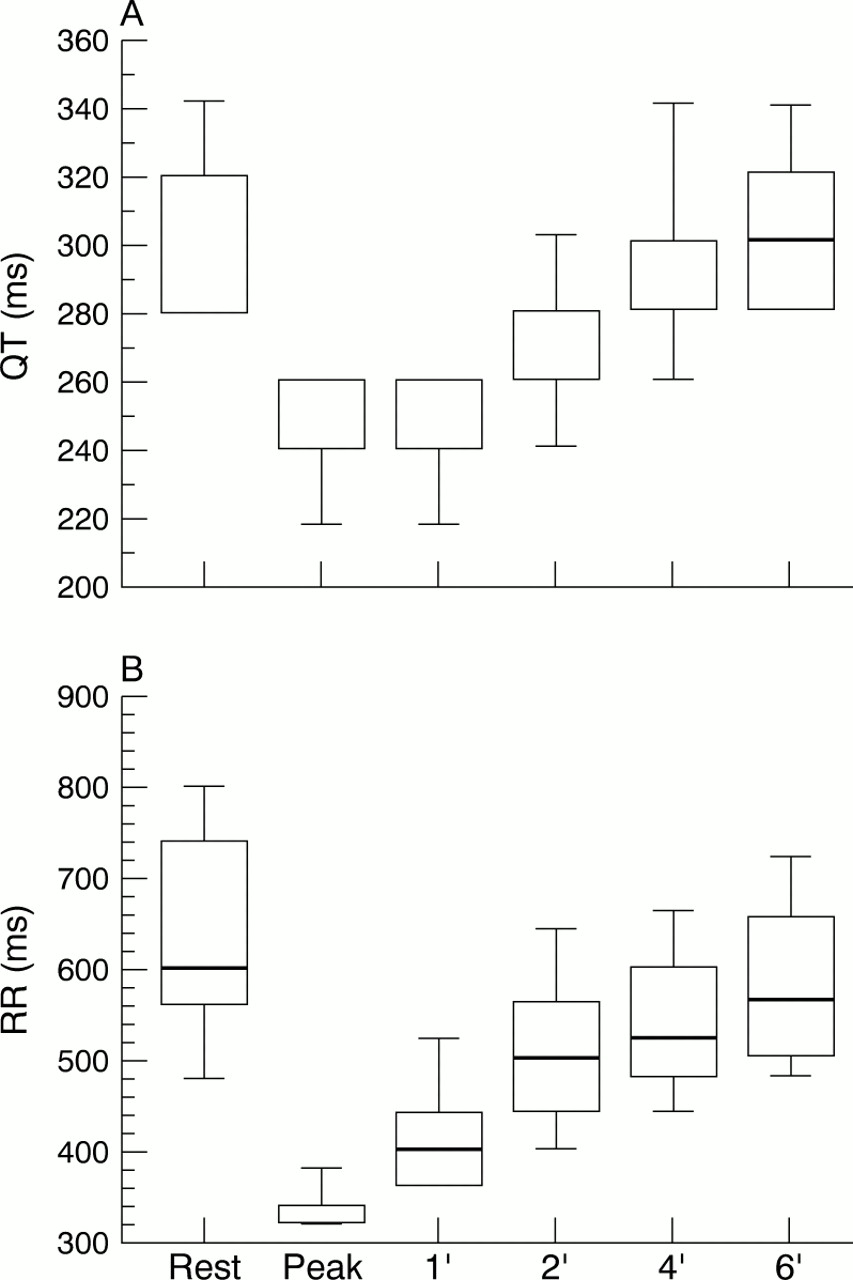
The QT, RR interval, and heart rate changes observed during the different stages of the exercise are shown in table 1. The mean (SD) maximum heart rate achieved was 0.93 (0.05) of maximum expected for age (range 0.86–1.05). As expected, there was a strong positive relation between the QT interval and the RR interval in all subjects, with significant shortening of both the QT and the RR interval during peak exercise (fig 1). At one minute of recovery from peak exercise the QT interval was not different from the value at peak exercise, while the RR interval showed lengthening. Lengthening of the QT interval began at two minutes into recovery (table 1, fig1).
QT, RR intervals, and heart rate during the different stages of exercise

(A) Absolute QT for the stages of exercise. (B) Absolute RR interval for the stages of exercise. Box plot explanation: upper horizontal line of box, 75th centile; lower horizontal line, 25th centile; horizontal bar within box, median; upper horizontal bar outside box, 90th centile; lower bar outside box, 10th centile.
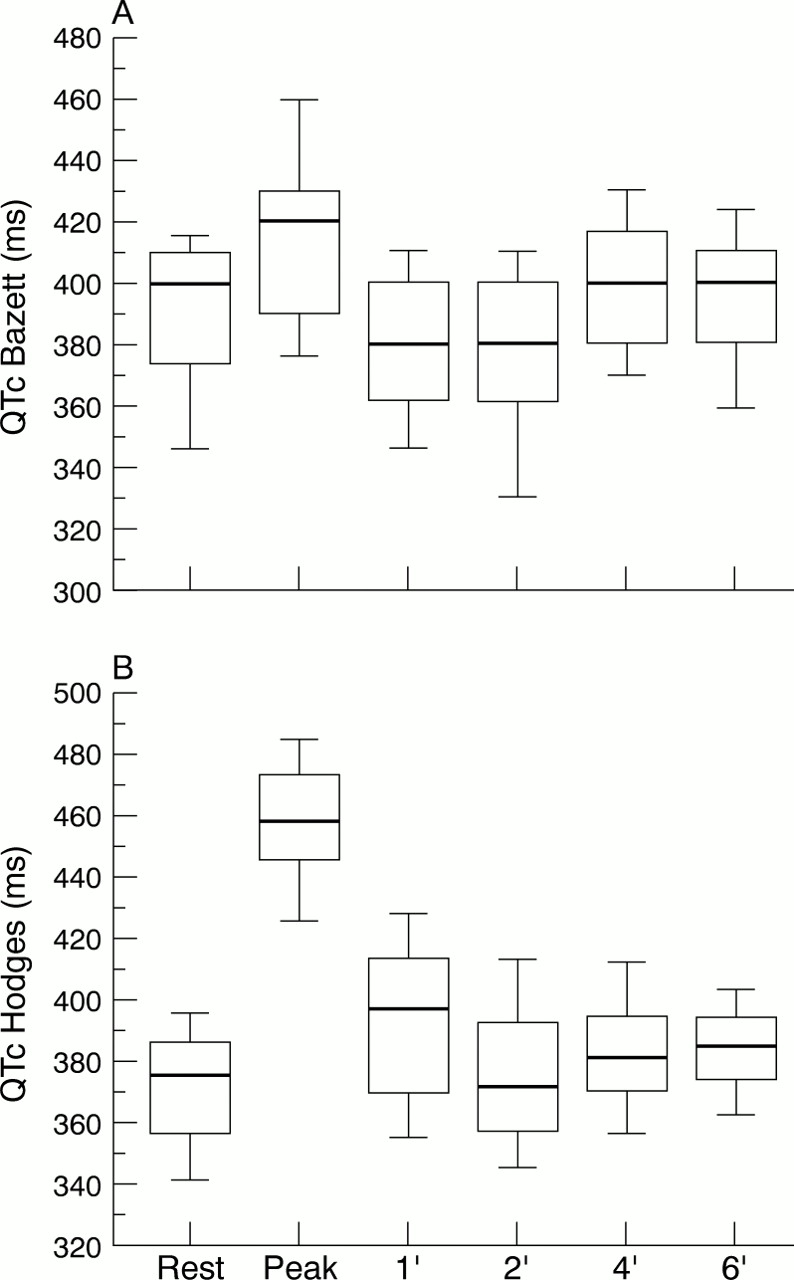
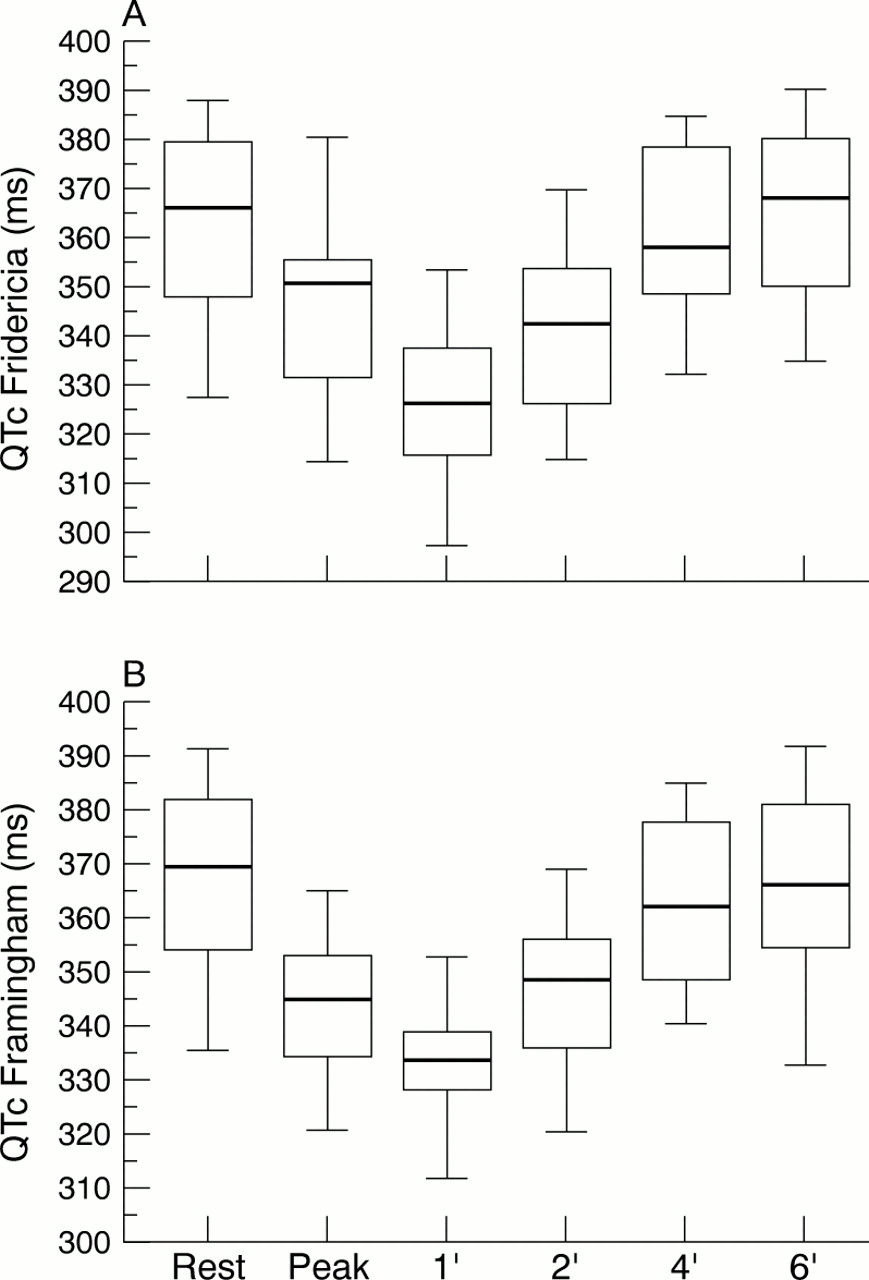
In this dataset, the Bazett and Hodges formulae led to a significant positive relation between QTc interval and heart rate (fig 2), while the Fridericia and Framingham formulae led to a significant inverse relation between QTc and heart rate (fig3).

(A) QTc Bazett during the different stages of exercise. (B) QTc Hodges for the different stages of exercise. Box plot explanation: upper horizontal line of box, 75th centile; lower horizontal line, 25th centile; horizontal bar within box, median; upper horizontal bar outside box, 90th centile; lower bar outside box, 10th centile.

(A) QTc Fridericia for the different stages of exercise. (B) QTc Framingham for the different stages of exercise. Box plot explanation: upper horizontal line of box, 75th centile; lower horizontal line, 25th centile; horizontal bar within box, median; upper horizontal bar outside box, 90th centile; lower bar outside box, 10th centile.
When comparing the QTc interval values between baseline and peak exercise, the application of the Bazett and Hodges formulae led to the conclusion that QTc interval significantly increases with exercise, while application of the Fridericia and Framingham formulae suggested a significant decrease in the QTc interval with exercise.
During early recovery, within two minutes of peak exercise there was a delay in QT lengthening compared with RR lengthening, which may account for the differences observed between peak exercise and the first two minutes of recovery seen with all the formulae. With the Bazett formula, there was a significant fall to below rest values at one and two minutes after peak exercise (p < 0.05), with return to rest values at four minutes after exercise. When applying the Hodges formula, there was an increase in QTc at peak exercise (p < 0.01), returning to rest values at two minutes after exercise (fig 2). When applying the Fridericia and Framingham formulae, there was a significant drop in QTc values, which reached a maximum with both formulae at one minute after peak exercise (p < 0.01). The values return to baseline after six minutes (fig 3). The differences in median QTc values between rest and one minute's recovery for each formula are outlined in table 2. There was no difference in heart rate response and change in QT interval or QTc between boys and girls.
Median QTc at rest and after one minute of recovery for the four formulae
Discussion
In this study of the exercise induced increase in heart rate in healthy children, none of the four formulae provided an optimum QT interval correction (that is, heart rate independent QTc values). There was an absence of sex difference in heart rate, QT, and QTc interval, as previously reported.15
The Bazett formula, the one most frequently used in paediatric cardiology, leads to significant overcorrection at peak exercise, immediately followed by significant undercorrection in the first minute of recovery. The Hodges formula leads to a significant overcorrection at peak exercise followed by a gradual return to rest values at four minutes of recovery. In contrast, both the Fridericia and Framingham formulae lead to significant undercorrection of QTc, which with both formulae is maximal at one minute of recovery.
Graded exercise leads to sympathetic overdrive, acidosis, and increased body temperature which trigger various physiological reflexes. Consequently, the mechanisms linking the repolarisation duration to heart rate are unlikely to remain stable during the entire period of exercise. Heart rate increases linearly with increasing work rate, and stroke volume increases initially at the onset of exercise, then reaches a plateau. The initial increase in heart rate is mediated by vagal withdrawal, subsequent increases being mediated at the sinoatrial node by sympathetic stimulation through the cardiac nerves and circulating catecholamines.16
This study clearly shows how exercise, with its multitude of physiological changes and adaptations, influences the QTc values obtained from different formulae. The use of these correction formulae leads either to a significant prolongation or to a shortening of the QTc interval.
If the QTc interval is used to diagnose prolongation of repolarisation, such as when investigating the cardiac safety of a pharmacological agent or in long QT syndromes, the use of only one correction formula may be inappropriate and misleading. Overcorrection or undercorrection may lead to completely artificial results, especially when the agent in question—or the underlying genetic defect—affects not only cardiac repolarisation but also heart rate, as is often the case.
Exercise testing has been reported to be helpful in the diagnosis of long QT syndrome. In patients with the congenital long QT syndrome, the QT interval does not shorten appropriately with exercise and they fail to achieve a normal maximum heart rate.17
According to Schwartz, the Bazett corrected QT one minute after exercise may be a sensitive indicator for patients with prolonged QT interval syndrome.18 Yu and colleagues published values for the Bazett corrected QT interval during exercise in adults.19 The baseline measurement was 422 ms, ranging from 440–443 ms during exercise. One minute after exercise it returned to baseline at 422 ms, in the second minute it was 408 ms, and it gradually returned to 420 ms by the 10th minute. It has been assumed that if the corrected QT interval one minute after exercise is greater than 440 ms, this is suggestive of the long QT syndrome.20 In our study, the Bazett QTc values had returned below baseline at one minute after exercise, remaining well below the baseline into the second minute after exercise (fig 2A); the Bazett QTc 98th centile at one minute after exercise was 424 ms. Further studies are required to determine the sensitivity and specificity of Bazett QTc one minute after exercise as a good indicator of the long QT syndrome.
From our study (table 2), the Fridericia and Framingham Qtc values one minute after exercise may be a more sensitive indicator of long QT syndrome than the Bazett QTc (fig 2). It has been observed that the difference in QT intervals between children with the long QT syndrome and healthy controls usually attains its maximum after physical effort.21 ,22
CONCLUSIONS
This study shows the limitations of formulae for correcting QT during exercise. Application of the Fridericia or Framingham QTc values one minute after maximum exercise may prove to be superior in the assessment of congenital long QT syndrome compared with the Bazett and Hodges formulae.