Article Text

Abstract
Objective: To measure caval and pulmonary flows at rest and immediately after exercise in patients with total cavopulmonary connection (TCPC).
Design: An observational study using the patients as their own controls.
Setting: Using a combination of magnetic resonance (MR) phase contrast techniques and an MR compatible bicycle ergometer, blood flow was measured in the superior vena cava, the tunnel from the inferior vena cava, and in the left and right pulmonary arteries during rest and on exercise (0.5 W/kg and 1.0 W/kg).
Patients: Eleven patients aged 11.4 (4.6) years (mean (SD)) were studied 6.3 (3.8) years after TCPC operation.
Main outcome measures: Volume flow measured in all four branches of the TCPC connection during rest and exercise.
Results: Systemic venous return (inferior vena cava plus superior vena cava) increased from 2.5 (0.1) l/min/m2 (mean (SEM)) to 4.4 (0.4) l/min/m2 (p < 0.05) during exercise, with even distribution to the two pulmonary arteries. At rest, inferior vena caval flow was higher than superior vena caval flow, at 1.4 (0.1) v 1.1 (0.1) l/min/m2 (p < 0.05). During exercise, inferior vena caval flow doubled (to 3.0 (0.3) l/min/m2) while superior vena caval flow only increased slightly (to 1.4 (0.1) l/min/m2) (p < 0.05). The increased blood flow mainly reflected an increase in heart rate. The inferior vena caval to superior vena caval flow ratio was 1.4 (0.1) at rest and increased to 1.8 (0.1) (p < 0.05) at 0.5 W/kg, and to 2.2 (0.2) at 1.0 W/kg (p < 0.05).
Conclusions: Quantitative flow measurements can be performed immediately after exercise using MR techniques. Supine leg exercise resulted in a more than twofold increase in inferior vena caval flow. This was equally distributed to the two lungs, indicating that pulmonary resistance rather than geometry decides flow distribution in the TCPC circulation.
- flow
- Fontan circulation
- exercise
- magnetic resonance imaging
- EPI, echo planar imaging
- MR, magnetic resonance
- TCPC, total cavopulmonary connection
- TE, echo time
Statistics from Altmetric.com
Total cavopulmonary connection (TCPC) is a palliative (Fontan type) operation used in patients with complex cardiac abnormalities that preclude a biventricular repair. By anastomosing the caval veins to the pulmonary arteries, flow is directed from the systemic veins to the pulmonary arteries. Although many patients do well clinically, exercise performance is reduced compared with normal individuals.1,2
Our understanding of the importance of cardiorespiratory interactions, fluid mechanics, and geometry of the systemic venous pathways remains limited, mainly because we have lacked methods for accurate quantification of flow in the vessels involved in the cavopulmonary connection, not only at rest but more importantly during exercise. Quantitative flow estimation in the Fontan circulation can be achieved using magnetic resonance (MR) phase velocity mapping.3–5 However, this technique is not suitable for exercise measurements as movement introduces image artefacts and compromises ECG triggering.
We have recently introduced a new MR based method for quantitative flow measurements during exercise.6 Using fast MR phase contrast techniques, data are acquired during a short intermission in exercise and while the breath is held, thereby avoiding motional and triggering problems. Exercise is performed supine on an ergometer bicycle mounted on the MR table.
In this study we focused on measurements of total systemic venous return and pulmonary blood flow in TCPC patients during rest and immediately after exercise.
METHODS
Characteristics of the study subjects
Eleven patients (six male, five female) participated in the study. Their mean (SD) age was 11.4 (4.6) years and they were studied 6.3 (3.8) years after TCPC. Their mean weight was 37 (18) kg, height 143 (22) cm, and body surface area 1.22 (0.4) m2.
Seven patients had tricuspid atresia, one had mitral atresia, and three had a double inlet left ventricle. The TCPC included an end to side anastomosis between the surgically divided superior vena cava and the right pulmonary artery, and an intra-atrial prosthetic baffle connecting the inferior vena cava through a lateral tunnel in the right atrium with the caudal part of the superior vena cava, which was further anastomosed to the right pulmonary artery or pulmonary main stem.
At the time of investigation, all patients were in New York Heart Association functional class I–II and were in sinus rhythm. Echocardiography performed within three months of MR showed qualitatively good ventricular function in all subjects. Previous cardiac catheterisations had excluded obstructions in the TCPC pathways; five had trivial baffle communications.
The study complied with the Declaration of Helsinki. Informed consent under a protocol approved by the Danish research ethics committee was obtained from all subjects or their parents.
Study design
Patients were investigated during rest and immediately after two different levels of exercise while lying in the MR scanner. Their feet were strapped to the pedals of an MR compatible bicycle ergometer (MRI cardiac ergometer, Lode BV, Groningen, Netherlands) mounted on the scanner table. The entire investigation lasted about one hour.
Heart rate was monitored by a standard MR compatible ECG monitoring system and by a pulse oximetry system (Nonin 8600 FO, Plymouth, Minnesota, USA) which also measured arterial oxygen saturation. Arm arterial blood pressure was measured at each work load interval (Colin Press-Mate 8800, Vingmed, Denmark).
Magnetic resonance
Standard gradient echo scout images of the heart and great vessels in three orthogonal planes were initially acquired at rest. At each stage of the exercise protocol measurements were obtained in random order from all four structures (the superior vena cava, the inferior vena caval tunnel, the left pulmonary artery, and the right pulmonary artery) (fig 1). Superior vena caval flow was measured immediately above the anastomosis and below any azygos vein. Inferior vena caval flow was measured at mid-tunnel level and above the coronary sinus if incorporated into the tunnel. Left and right pulmonary artery flows were measured immediately central to the branching of the pulmonary arteries. In the patients with small baffle defects flow was measured below the defects. In one patient with a minute residual fenestration, it was not possible to see whether measurements were performed above or below the fenestration.

Gradient echo scout image with positions for flow measurements marked. IVC, intra-atrial prosthetic baffle connecting the inferior vena cava with the superior vena cava; LPA, left pulmonary artery; RPA, right pulmonary artery; SVC, superior vena cava.
Measurements were performed on a Philips NT 1.5 Tesla whole body scanner equipped with 21 mT/m and 105 mT/m/ms gradients and CPR6 research software, using an 18 cm receiver coil. We used an ECG triggered hybrid phase encoded segmented k-space sequence6 lasting eight heart beats. There were seven echo planar imaging (EPI) readouts and velocity encoding in the slice selection direction, with flow compensated gradients and acquisition of central k-space lines first (low–high acquisition). The field of view was 196–256 mm (depending on patient size), with a 128 × 96 matrix giving pixel sizes of 1.5 × 1.9 mm2 to 2.0 × 2.5 mm2. Slice thickness was 6–8 mm, the heart phase interval was 43–46 ms, and an echo time (TE) of 6–7 ms was obtained. Velocity encoding was varied from 30–100 cm/s depending on the vessel of interest (caval v pulmonary), the exercise level, and the velocity values obtained in the individual during rest.
Manual segmentation of vessels of interest was performed off-line using dedicated software, and total flow during the heart cycle was computed. The antegrade triggering used does not allow measurement during the last 10% of the cardiac cycle. Flow during this period was estimated as an average between the flow value for the last heart phase and the first heart phase.
Exercise protocol
Resting flow measurements were performed with the feet in the pedals, positioned between 4–22 cm above the scanner table. After measurements of resting flows, the patients performed controlled leg exercise at workloads of 0.5 and 1.0 W/kg. At each work level, exercise was continued until the heart rate had been stable for two minutes. This rate was defined as the target heart rate for the given workload and patient. At this point, patients were asked to stop exercising and to hold their breath at the end of full expiration, during which flow measurements were made. Each measurement lasted eight heart beats, after which exercise was resumed at the same workload. When the target heart rate was reached again, measurements in the next vessel were done in the same way.
Calculations
Systemic venous return was calculated as combined superior vena caval and inferior vena caval flows, and pulmonary blood flow as the combined left pulmonary artery plus right pulmonary artery flow. Stroke volume was measured as total systemic venous return divided by heart rate. All flow values were indexed to body surface area.
Statistical analysis
All haemodynamic variables are expressed as mean (SEM). Variables measured during exercise were compared with resting values by the use of two tailed paired Student's t test. The systemic venous return was compared with the pulmonary flow values using linear regression analysis. Probability values of p ≤ 0.05 were considered significant.
RESULTS
In all subjects, the anatomy of the TCPC pathways was clearly visualised by the gradient echo scout images (fig 1). An example of velocity images from all four measurement positions at 1.0 W/kg is shown in fig 2. All patients completed the protocol.
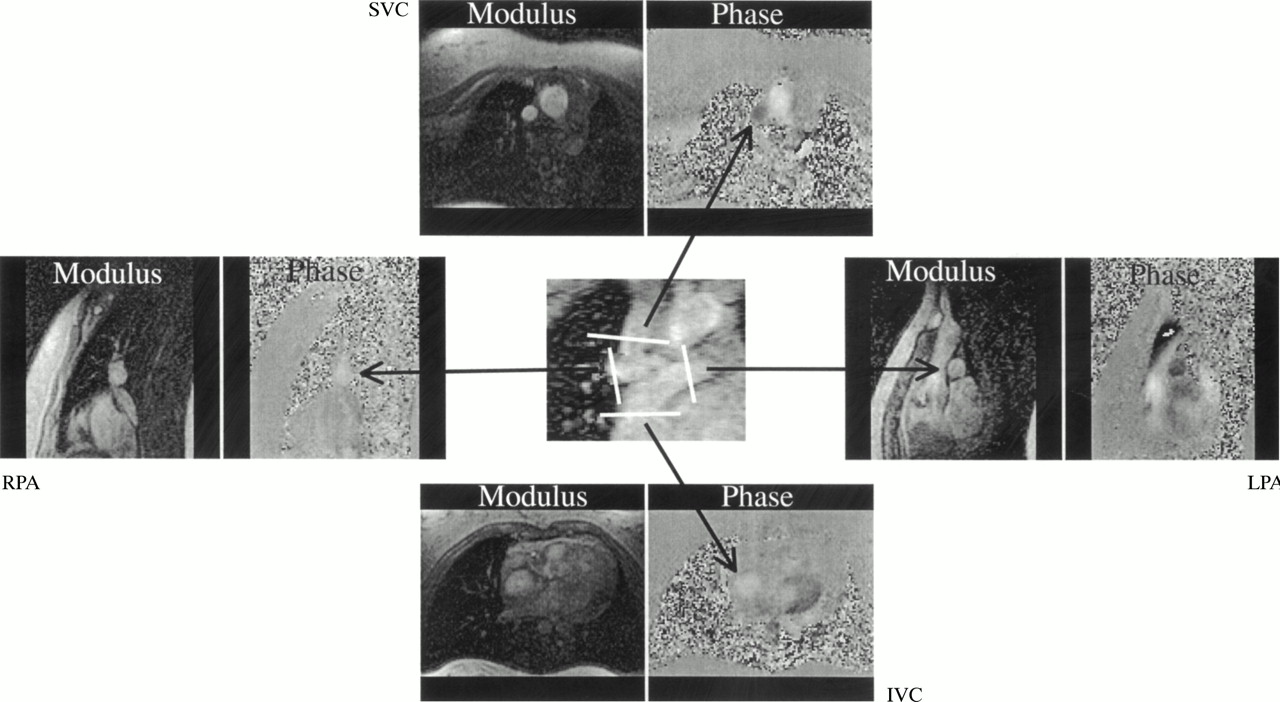
An example of anatomical (modulus) and velocity (phase) images from all four measurement positions at 1.0 W/kg. IVC, intra-atrial prosthetic baffle connecting the inferior vena cava with the superior vena cava; LPA, left pulmonary artery; RPA, right pulmonary artery; SVC, superior vena cava.
Heart rate, mean arterial pressure, systemic venous return, and pulmonary blood flow increased significantly with increasing workloads. Arterial oxygen saturation did not change during exercise (table 1).
Haemodynamic variables
Flow in the inferior vena cava, superior vena cava, left pulmonary artery, and right pulmonary artery increased significantly during exercise (fig 3); the flow increase was greatest in the inferior vena cava. Flow increments in the left and right pulmonary arteries were equal, whereas superior vena caval flow only increased slightly. The inferior vena caval to superior vena caval flow ratio was 1.4 (0.1) at rest and increased to 1.8 (0.1) (p < 0.05) at 0.5 W/kg, and to 2.2 (0.2) at 1.0 W/kg (p < 0.05). The right pulmonary artery to left pulmonary artery flow ratio was 1.3 (0.1) at baseline and did not change during exercise (1.2 (0.1) at 0.5 W/kg and 1.2 (0.1) at 1.0 W/kg).
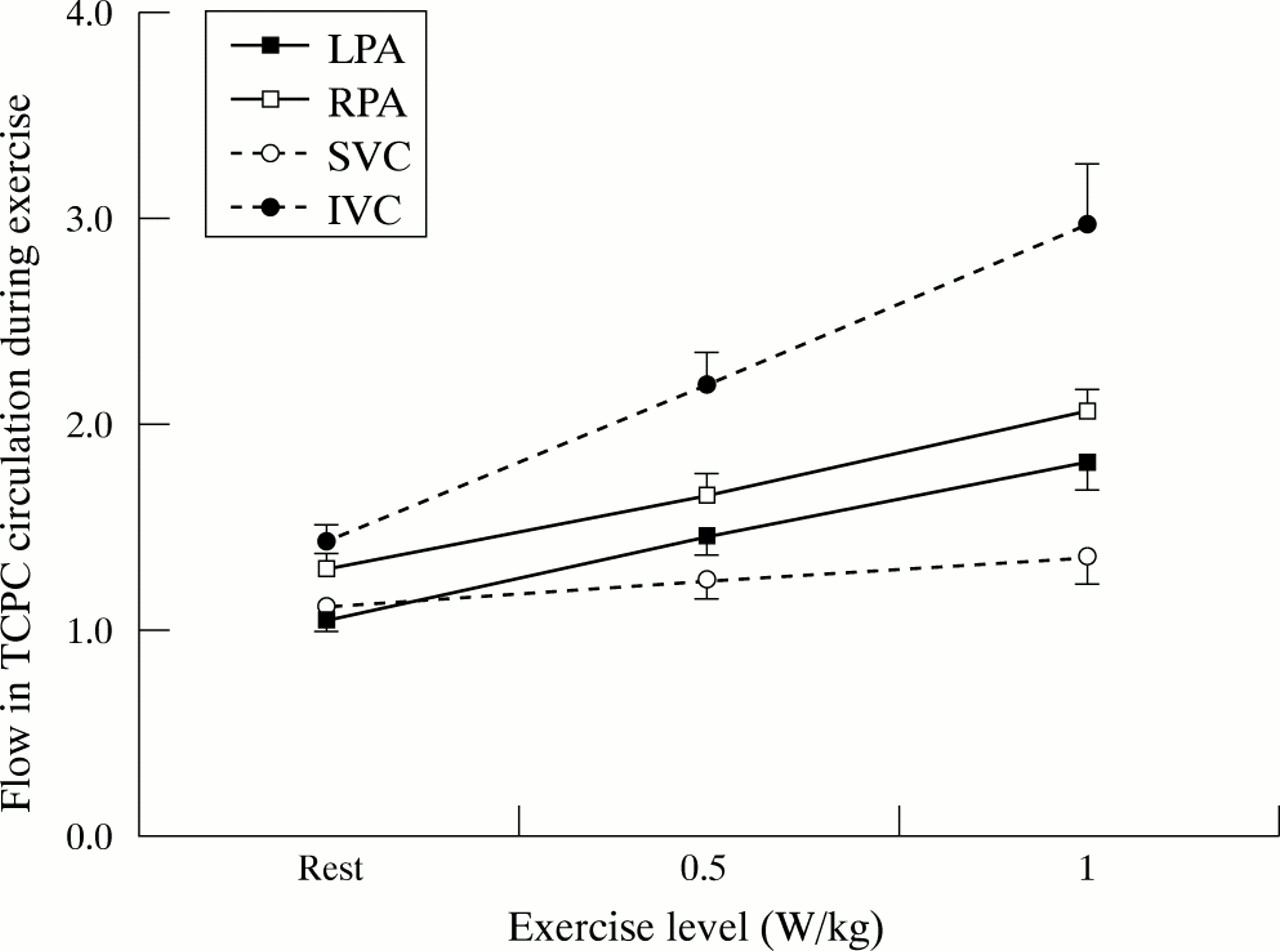
Mean flows (l/min/m2) in the left pulmonary artery (LPA), right pulmonary artery (RPA), superior vena cava (SVC), and intra-atrial prosthetic baffle connecting the inferior vena cava through a lateral tunnel in the right atrium with the superior vena cava (IVC). Error bars = SEM.
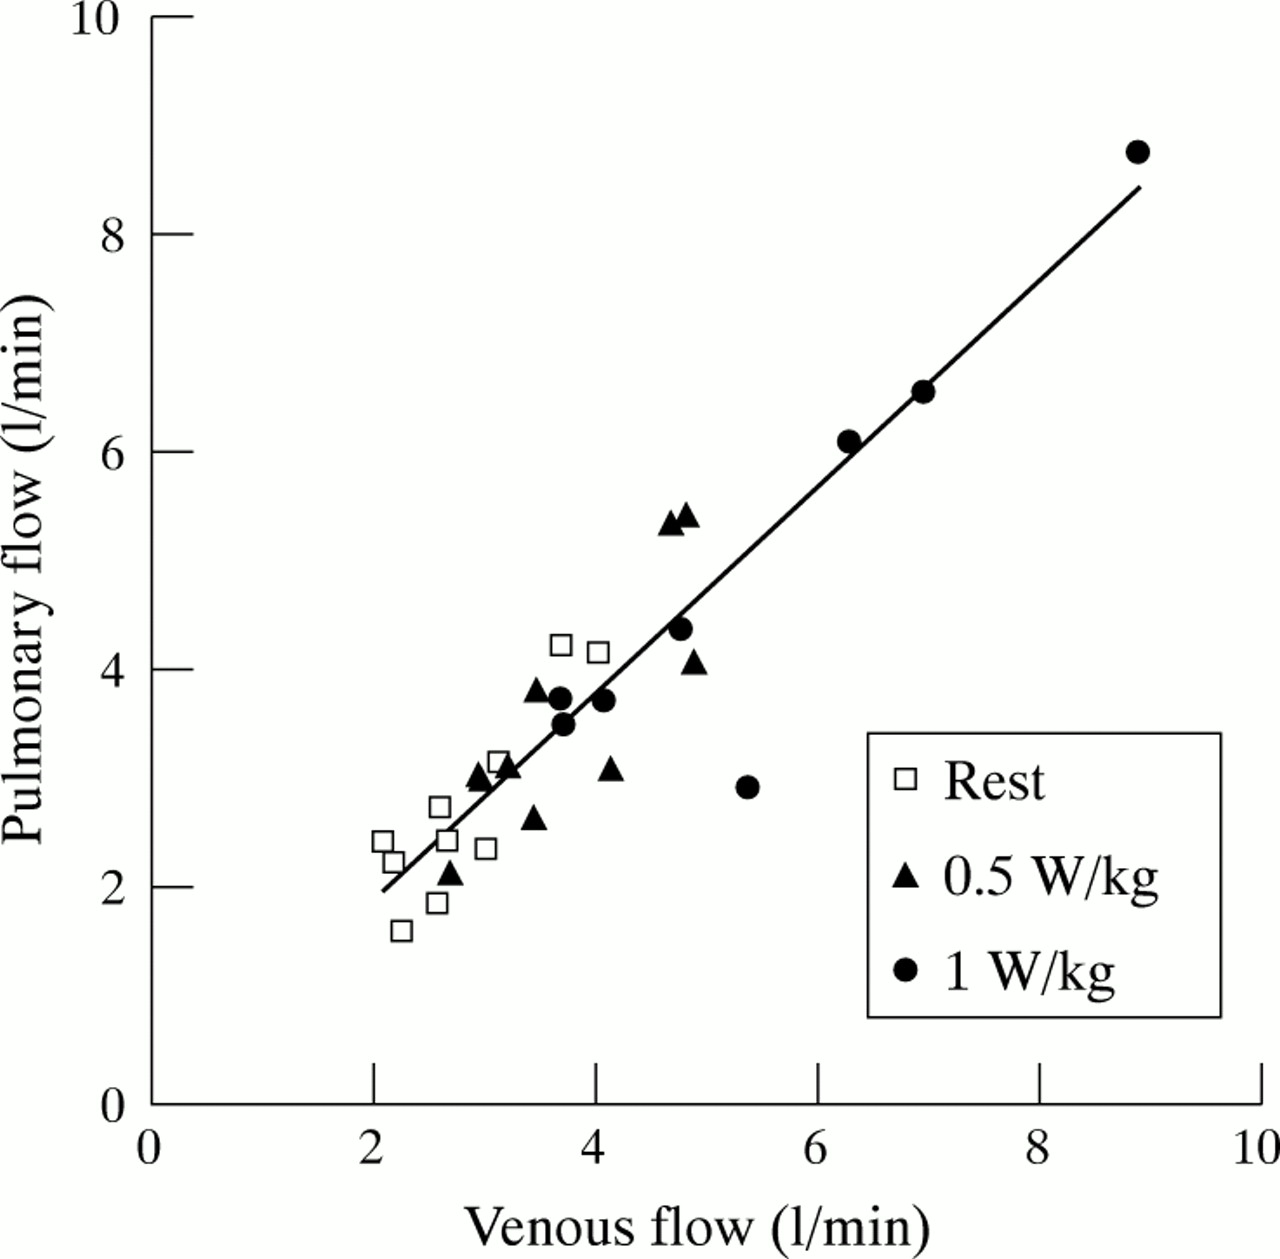
There was no difference between flow in the systemic veins (inferior vena cava plus superior vena cava) and flow in the pulmonary arteries (left pulmonary artery plus right pulmonary artery). There was a good correlation between pulmonary flow and systemic venous flows (unadjusted regression coefficient R = 0.844, p < 0.05) (fig 4).

Correlation between mean combined systemic venous return (inferior vena cava plus superior vena cava) flow and combined pulmonary artery flow (left pulmonary artery plus right pulmonary artery).
DISCUSSION
It is well recognised that patients with TCPC have reduced exercise performance.1,2,7,8 Contributing factors such as absence of a subpulmonary ventricle, imperfect geometry of the cavopulmonary anastomoses,9–12 increased pulmonary vascular resistance,1 chronotropic incompetence,13 and ventricular dysfunction14 have been suggested.
The present study is the first to make quantitative measurements of flow during exercise in patients with TCPC by fast MR phase contrast techniques. During supine bicycle ergometry the systemic venous return increased significantly, mainly because of a doubling of the inferior vena caval flow, whereas superior vena caval flow increased only slightly. This difference in the contribution of the inferior and superior venae cavae to the flow responses reflected the study set-up, which involved supine lower limb exercise. The response to exercise may be different in the upright position. As recently shown during resting conditions, gravity is responsible for reduced antegrade flow in the inferior vena cava.15 In the resting state blood flow to the right lung exceeded flow to the smaller left lung. During exercise, pulmonary blood flow increased proportionally to the increase in systemic venous return, and the relative flow distribution to the right and left lungs remained unchanged. It has been shown previously that there is preferential streaming from the inferior vena cava to the left pulmonary artery and from the superior vena cava to the right pulmonary artery at rest,5,16 and it is assumed that this reflects the geometry of the cavopulmonary anastomoses. In the present study we showed that the pulmonary vascular resistance rather than the geometry of the anastomoses was the major determinant of the flow distribution between the lungs during exercise in this series of patients.
It was technically more difficult to measure flow in the pulmonary arteries than in the systemic veins, not only because of the limited length of the pulmonary vessels accessible for measurements, but also because of the branching effect that is likely to introduce secondary flow patterns (vortices) in the pulmonary flow.17 Specifically, the right pulmonary artery is difficult because of branching close to the superior vena caval anastomosis. However, a flow void was never seen, indicating that measurements were obtained with sufficiently short echo time relative to the flow patterns developing during exercise in this low pressure system. The non-significant tendency to underestimate pulmonary flow relative to caval flow probably reflects these difficulties. If movements resulting from the exercise caused the imaging plane to be misplaced relative to the vessel of interest, the image plane was repositioned and the exercise and subsequent scan repeated.
Because of the relative differences encountered in measuring pulmonary flow, we calculated stroke index from the systemic venous return divided by heart rate. This does not take the relatively minor contribution from the coronary circulation into account in those cases where the coronary sinus was left draining outside the lateral tunnel. Assessed in this way, the increase in systemic venous return seen during exercise resulted mainly from an increase in heart rate, while stroke index played only a minor role.
Gewillig and colleagues studied patients with various types of Fontan circulation with Doppler recordings of ascending aortic flow1 and found stroke indices to be higher both at rest and during exercise than reported in the present study. This may be because they only used the highest Doppler velocity signals to compute flows, leading to an overestimation as the flow profile in the ascending aorta is not flat. Furthermore, we studied flow while the breath was held in expiration, where the lowest flow is expected (both Penny and Redington and their colleagues showed that 64% of the flow in the Fontan circulation at rest occurred during inspiration.18,19) Fogel and colleagues found that 30% of flow in the systemic venous pathways was respiration dependent,20 and Kaulitz and associates described a decrease or cessation of caval flow during expiration.21 In contrast to Kaulitz, we did not find flow cessation when breath was held in expiration, even at rest, and despite the possible negative impact of expiration the total caval and pulmonary blood flows increased greatly during exercise. Interestingly, the flow ratio between inferior vena cava and superior vena cava increased with exercise. As intrathoracic pressure changes are likely to influence the inferior and superior venae cavae equally, the change in flow ratio most probably reflects the increased demand from the working lower limbs. To define the impact of respiratory work on exercise haemodynamics, real time flow measurements with monitoring of respiration state should be performed. This has never been done during exercise, but Hsia and colleagues found that respiratory work accounted for 30% of the flow at rest using the Doppler technique.15
Measuring exercise induced flow changes in the vessels is a major challenge. The use of quantitative MR flow measurements is hampered by movement artefacts and ECG triggering problems. We have previously documented that the MR technique applied in this study is feasible for measurements of abdominal aortic flow after supine ergometer exercise using a measurement time of 12 heart beats.6 In the current study, the measurement time was further reduced to eight heart beats, while keeping the same resolution. This was made possible by the use of stronger gradients. As the central part of k-space, which largely determines the image content, was acquired first (low–high acquisition), the effective number of heart beats used to acquire the bulk of the flow information was considerably less than eight. In this study we have challenged the technique further by looking at flow in the pulmonary arteries and caval veins in children and young adults with a TCPC circulation, where skewed velocity profiles and vorticity are known to occur.17 The good correlation between the total caval flows and total pulmonary flows indicates that the technique is reliable even for this purpose.
Study limitations
As is often the case with complex congenital heart defects, only a small number of subjects could be studied and they varied in the type of defect, age, and follow up time.
Supine exercise with the legs is not the ideal model for assessing exercise response to normal daily activities, but was the closest we could get to measuring exercise haemodynamics. Preliminary reports on the use of open scanners that allow upright exercise have appeared,22 but these do not have the gradient strength necessary to perform the fast flow measurements required. It is clearly not physiological to hold one's breath during exercise, and the expiratory phase only represents part of the entire respiratory cycle. On the other hand the MR technique used produces more reproducible flow data in expiration when the lungs are less inflated. Owing to the forward triggering mode used, the last 10% of the cardiac cycle could not be measured directly.
Conclusion and perspectives
In this study we have shown that during supine ergometer exercise patients with total cavopulmonary connection increased their cardiac output predominantly by increasing their heart rate. Despite preferential streaming patterns in the TCPC anastomoses during rest, a predominant increase in flow from the inferior vena cava was equally distributed to the two lungs, indicating that peripheral pulmonary resistance rather than anastomosis geometry determined pulmonary flow in this specific series of TCPC operated patients.
Acknowledgments
We received financial support from the Karen Elise Jensen Foundation, the Elin Holms Research Foundation, the Danish Heart Foundation (grants No 97-2-1-5-22549 and 99-2-3-82-22769), and the Danish Medical Research Council Grant 28809.
REFERENCES
Footnotes
-
↵* Also at the MR Centre, Institute of Experimental Clinical Research, Aarhus University Hospital